Reliance Infrastructure Ltd - Investor Presentation
←
→
Page content transcription
If your browser does not render page correctly, please read the page content below
Reliance Infrastructure Ltd.
     Investor Presentation
Disclaimer
By attending this presentation, you are agreeing to be bound by the restrictions set out below. Any failure to comply with these restrictions may constitute a
violation of applicable securities laws. These materials are being shown to you solely for your information and may not be reproduced, retransmitted,
further distributed to any other person or published, in whole or in part, for any purpose.

These materials have been prepared by Reliance Infrastructure Limited (the "Company") solely for use at this presentation and have not been
independently verified. No representations or warranties, express or implied, are made by the Company or its subsidiaries (collectively, the “Group”) or any
of their respective members, directors, officers or employees or any other person as to, and no reliance should be placed on, the fairness, accuracy,
completeness or correctness of the information or opinions presented or contained in these materials.

It is not the intention to provide, and you may not rely on these materials as providing, a complete or comprehensive analysis of the financial or trading
positions or prospects of the Company or the Group. None of the Company or the Group or any of its directors, officers, employees, agents, affiliates,
advisers or representatives accepts any liability whatsoever in negligence or otherwise for any loss howsoever arising from any information or opinions
presented or contained in these materials or otherwise arising in connection with these materials. The information and opinions presented or contained in
these materials are provided as at the date of this presentation and are subject to change without notice and the accuracy of the information is not
guaranteed.

This presentation is for information purposes only and is not and does not constitute or form part of any offer, invitation or recommendation to purchase or
subscribe for any y securities and no p
                                      part of it shall form the basis of or be relied upon
                                                                                       p in connection with any
                                                                                                              y contract, commitment or investment decision in
relation thereto. This presentation may not be used or relied upon by any other party, or for any other purpose, and may not be reproduced, disseminated
or quoted without the prior written consent of the Company. This presentation should not be relied upon as the basis of an investment decision in securities
of the Company or the Group.

The information presented here is not an offer for sale within the United States of any shares or any other securities of the Company or the Group. The
distribution of this presentation in certain jurisdictions may be restricted by law and persons into whose possession this presentation comes should inform
themselves about,
             about and observe,
                          observe any such restrictions
                                               restrictions.

This presentation and the discussion that follows may contain “forward looking statements” by the Group that are not historical in nature. These forward
looking statements, which may include statements relating to future results of operation, financial condition, business prospects, plans and objectives, are
based on the current beliefs, assumptions, expectations, estimates, and projections of the directors and management of the Company about the business,
industry and markets in which Reliance Infrastructurethe Group operates. These statements are not guarantees of future performance, and are subject to
known
   o   a
       andduunknown
                 o     risks,
                         s s, u
                              uncertainties,
                                ce ta t es, aand
                                               d ot
                                                 other
                                                    e factors,
                                                       acto s, so
                                                               some
                                                                  eoof which
                                                                          c aare
                                                                               e beyo
                                                                                 beyond
                                                                                      d tthe
                                                                                           e Co
                                                                                             Company’s
                                                                                                 pa y s o
                                                                                                        or tthe
                                                                                                              eGGroup’s
                                                                                                                  oup s co
                                                                                                                        control
                                                                                                                           to a and
                                                                                                                                  dddifficult
                                                                                                                                         cu t to p
                                                                                                                                                 predict,
                                                                                                                                                   ed ct, tthat
                                                                                                                                                             at
could cause actual results, performance or achievements to differ materially from those in the forward looking statements. Such statements are not, and
should not be construed, as a representation as to future performance or achievements of the Group. In particular, such statements should not be regarded
as a projection of future performance of the Company or the Group. It should be noted that the actual performance or achievements of the Company and
the Group may vary significantly from such statements.

                                                                                                                                                       Slide 2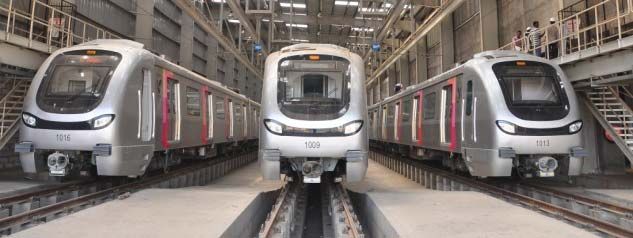
Family
      YOUNG GROUP - 8 YEAR OLD
ASSETS CREATED ORGANICALLY IN INDIA
Million Shareholders; Amongst largest in the world

Milli Customers;
Million C t      1 outt off 6 IIndians
                                 di    Every
                                       E     Single
                                             Si l Day
                                                    D

Young, trained & motivated manpower

Assets worth more than ` 2.6 Lakh crore

Net Worth more than ` 91,000
                      91 000 crore

Revenues of ` 56,000 crore

Operating Profit of ` 10,500 crore
                                                 Numbers as of FY14

                                                        Slide 3
Reliance Group
p – Key
y Businesses
Financial Services Infrastructure Power Communication
Asset Management Power Sector Power Generation Wireless
Distribution Thermal
Generation Coal
Life Insurance Enterprise
Gas
Transmission
T i i
Renewable
General Insurance Urban Transport Hydro Telecom Infrastructure
Solar
Road Wind
Commercial Finance Metro Direct to Home
Resources
Airports
Ai t
Coal Mining
Broking & Distribution Cement India Worlds largest
Indonesia submarine cable
EPC Services - In all network
infrastructure areas Coal Bed methane
Reliance has played a key role in nation building with strong presence in Core Sectors
Slide 4
Infrastructure in India – US$
$ 1 Trillion Opportunity
pp y
Investment across infrastructure sectors expected to
increase significantly
Infrastructure development set to accelerate with
Government impetus to revive economy
1 000
1,000 60%
48%
900
50%
800 Strong private participation along with Government
700 37% 40% initiatives to boost infrastructure development
600
2 %
25% 30%
500 876 ~75% of investments expected in Power, Roads,
400 20% Telecom and Railways
300
389 10%
200
153
~50%
50% of investments expected from private sector
100 0%
10th Plan 11th Plan 12th Plan
(2002-2007) (2007-12) (2012-2017)
Investments during 2007-12 expected to be 2.3x in
Total Investment (US$ bn) Private sector Participation next 5 years
Source: CMIE, Planning Commission (2011-12 prices)
RInfra is present in sectors to have ~60% of infra spend during 2012-17
Slide 5
Power Sector – Priority
y Sector for the Government
Strong demand push for 24x7 uninterrupted power supply Huge investments planned in power transmission sector
2,500 350
290 50
300
2,000
250 40
198
1 500
1,500 200 30
136
1,000 1,993 150
20 36.0
1,403 100 25.6
500 10
936 50 8.9
0 - 0
10th Plan 11th Plan 12th Plan
11th plan 12th plan 13th plan
Transmission spend (US$ mn)
Energy demand (BUs) (LHS) Load (GW) (RHS)
Installed power capacity at ~250 GW with
Distribution - Total pie of 900 bn units growing @ 5% >108 GW capacity addition in last 10 years
` 15,000 bn investments planned to achieve
Pvt. 88.5 GW capacity additions during 2012-17
10%
Govt.
90%
` 2,100
2 100 bn investments planned for strengthening
transmission network during 2012-17
55% of investments expected from private sector
Source: 18th Electric Power survey ,CEA, Planning Commission - Working group on Coal, Planning Commission, Ministry of Power
RInfra is one of the largest integrated private sector power companies
Slide 6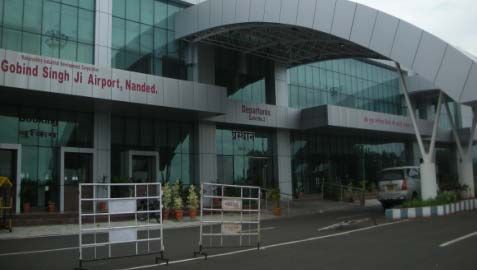
Road Sector – Key
y Driver for Capex
p Revival Cycle
y
Increasing private sector participation
Road to be a key beneficiary of Government focus
on reviving investment activity
S$bn at 2011-12 prrices
45 35% 40%
33%
40 30% 32%
35 28%
30%
30
25
20%
Government has planned ` 9,100 bn investment
20
15 in Road sector during 2012-17
10 10%
US
5
-
2013 2014 2015 2016 2017
0%
~32% of the total planned outlay in the sector is
expected from the private players
Public sector Private sector Private as % of total
In FY15
FY15, Government plans to award 8,500
8 500 km
Source: NHAI, Interim Report of the High Level Committee, Financing of
Infrastructure (Aug 2012) roads worth ` 375 bn
I
Increased
d autonomy
t to
t Ministry
Mi i t will
ill speed
d up project
j t awards
d
Proposed changes in Concession Agreement to provide comfort to developers & lenders
RInfra is amongst the top 3 private players in the Road sector
Slide 7Cement – Strong
g Focus Area
Indian Cement Industry Demand from various industries for Cement
350 (mn tonnes)
296 306
300 277 Irrigation
250 231 230 23%
209 205 216
200 186
172
150
100 Roads
Housing
5%
50 53%
0
2007-08 2008-09 2009-10 2010-11 2011-12
Infrastructure
15%
Capacity (mn tonnes) Production (mn tonnes) Defense
Source: Report of the Working Group on Cement Industry for 12th Plan 4%
Infrastructure
I f t t and
dhhousing
i sectors
t will
ill b
be th
the iimmediate
di t ddrivers
i lleading
di tto cementt d
demand
d
Concreting of roads will be a mega opportunity for the cement sector
Cement sector to benefit since FDI investment in Real Estate reduced from 50,000 sq mtrs to
20,000 sq mtrs area
Government endeavour of “Housing
Housing for all by 2022”
2022 should be another booster for the sector
RInfra to be a noteworthy player over the next few years
Slide 8EPC – Growth Driver for Infrastructure Development
p
Fund allocation during 2012-17 in following sectors will create opportunities for private players:
• Power : ` 15,000 bn
• Roads : ` 9,100 bn
• Rail : ` 6,400 bn
• Ports : ` 2,000
2 000 bn
Almost 40% - 50% of investments could be through EPC route
` 70 bn investment in FY15 for development of 100 smart cities
Development of 15,000 km gas pipeline through EPC route
India is largest PPP market in the world with over 900 projects in various stages of development
RInfra to benefit due to it’s leadership position in EPC
Slide 9100 Smart Cities – A Significant
g Growth Opportunity
pp y
Prime Minister’s vision of 100 ‘Smart Cities’ Government recent positive initiatives
Sectors that will be key beneficiaries ` 70 bn investment in FY15 for development
Power Telecom off 100 smartt cities
iti
Road Water Master planning of smart cities in Delhi-
Mumbai, Amritsar-Kolkata & Chennai-
Waste Bengaluru Industrial Corridor to be completed
Railways (MRTS)
Management
Allocated ` 1 bn each for Metro projects in
Airports Ports
Lucknow & Ahmedabad and setting g upp
National Industrial Corridor Authority
Cement
Pooled Municipal Debt Obligation corpus of
EPC activity ` 500 bn proposed
Proposed ‘Smart Cities’ will be satellite towns Amendments to labour / industrial laws & land
of larger cities and modernization of acquisition bill being pushed
existing mid
mid-sized
sized cities
RInfra will capitalize on the opportunities available in smart cities
10
Slide 10Recent Govt. Initiatives for Infrastructure Sector
Benefits to RInfra
Availability of long term funding for infrastructure sector Improve credit availability
& maturity
Flexible long term 5/25 loan structures Will lower cost of capital
(25 year loan with 5 year reset)
10 year tax holiday extended for another 3 years Will bring new investment
Will improve project NPV
Conducive tax regime for Infrastructure Investment Trusts
Land Acquisition Act to be amended
Facilitate speedy execution
3P India formed for developing sophisticated contracts and Faster dispute redressal
dispute redressal for PPP projects
Slide 11Leadership position across all businesses
Well diversified portfolio with stable cash flows
Proven track record of completing large infrastructure projects
Key
Investment
Highlights
Capex cycle nearly complete; Cash inflow started
Strong balance sheet with Networth of ` 280 bn
Experienced management team
Well placed to capitalize on the growth opportunities
Slide 12RInfra Existing
g Businesses
Assured
A d returns
t
Negligible Capital
with Performance Free Market & High Growth
& High Growth
incentives
• Distribution • Road • Plants in
Madhya • Power
• Generation • Metro Rail
Pradesh & • Road
• Transmission • Airport Maharashtra
Urban
Power Transport Cement EPC
Presence across all key infrastructure sectors
Slide 13Presence across Power Value Chain
Distribution Generation* Transmission
Over 10 mn consumers Operational Capacity : 6,225 MW Own 4,000 circuit kms of
operational lines
Serving 2 out of 3 homes in Under Development : 20,000 MW
Mumbai, Delhi & Odisha Enable flow of 4,000 MW
Coal Reserves : 4 bn tonnes in western region
g
* Includes Reliance Power Ltd (RPower)
RInfra has 42.2% stake in RPower
Leading integrated private sector power company in India
Slide 14Power Generation Under Construction/
Development
(~20 GW)
14,940
Hydro Projects *
(672 MW)
Operational Capacity
Hydro Project * Hydro Projects * (6 225 MW)
(6,225
(400 MW) (4,220 MW) 5,285 5,292
Solar CSP #
(100 MW) Rosa #
Barmer 4 (1,200 MW) 941
Chitrangi^
Barmer 5 (3,960 MW)
Solar PV #
RI f
RInfra RP
RPower C l/G
Coal/Gas R
Renewables
bl
(40 MW) Sohagpur
Sasan#^ Tilaiya^
(3,960 MW) (3,960 MW) Dahanu Power Plant operated at 100%
Butibori#
Wind #
(45 MW) (600 MW) PLF for 9 years since inception
Kothagudem
Dahanu
(500 MW) Samalkot^ RPower has well diversified portfolio by
(2,620 MW)
Goa
fuel type, offtake and location
Krishnapatnam^
(48 MW) Karnataka (3,960 MW)
Wind #
(8 MW) Largest
g integrated
g p
private sector p
power
Kerala
generation and coal resources in India
(165 MW)
Reliance to supply power to 20 states
Coal Gas Renewable Hydro Coal Mines CBM blocks
comprising 80% of India’s population
# Operating Projects; ^ Projects Under Construction; * Projects Under Development
All future power generation will be through RPower
Slide 15Coal Resource Reliance Power Ltd
Two billion tonnes coal reserves in India with target
production of 65 MTPA
Set to become ~100 million tonnes per
annum (MTPA) coal resource company
Sasan coal mines
(Moher, Moher Amlori Ext
(Moher Ext.
and Chhatrasal) • Sasan coal mines : 25 MTPA
Reserves: 707 MT • Tilaiya coal mines : 40 MTPA
Production: 25 MTPA
Tilaiya coal mines
(Kerandari B&C)
• Indonesian mines : 30 MTPA
Reserves: 1,230 MT
Production: 40 MTPA Use of world class mining equipment
Two billion tonnes coal resources in Indonesia with
target production of 30 MTPA
India’s largest private sector coal resource company
Slide 16Power Distribution
AT&C loss levels of ~24% in India Serving consumers in mega metros
i.e. Mumbai & Delhi
1% reduction in loss level can
save ` 60 bn
Identified 255 cities for private
participation - Franchisee route Serving over 10 million consumers
Investment of ` 3,000 bn
envisaged during 2012-17
Distributing ~8,500 MW of power
Have 50% market share of total private
sector distribution
Largest power distribution player in the private sector
Slide 17Mumbai Distribution
Serving over 2.9 mn customers
9% loss levels versus India avg. of ~24%
24%
Reliability of 99.98% : Avg. interruption ofDelhi Distribution
Serving over 3.4 mn customers
Loss levels reduced from 55% to 18%
Delhi Govt. saved ~` 400 bn since 2002
~` 50 bn spend on network upgradation
Provides 24x7 reliable & quality power
Average power outage reduced from 5 hrs/day to
3 mins/day
Implemented tariff hike of ~80%
80% in last 4 years
Regulator approved recovery of ~` 21 bn arrears
including carrying cost
India’s most admired power distribution company by Forbes
Slide 19Power Transmission
Operating / Developing 3 projects worth ` 46 bn
Enable transmit >4,000 MW of power in western region
~4,000 circuit kms of transmission lines operational
Benefiting over 45 utility companies
Transformation capacity of 3,000 MVA
1 2 3
Western Region
g Mumbai Transmission# Parbati Koldam#
Strengthening Scheme*
First 100% privately owned 8 Extra High Voltage (EHV) Signed bulk transmission
transmission line in India sub-stations charged agreement with 13 beneficiaries
8 out of 9 lines commissioned High System availability of 99.9% Both the lines commissioned
in Maharashtra & Gujarat - Ensuring incentives and revenue generating
Project to be operational within Developing ` 80 bn HVDC project
FY15 #Regulated
*Competitive Based Project Return Project
Largest private player in the transmission sector
Slide 20Roads Business
Amongst the top 3 NHAI concessionaires
10 out of 11 projects are revenue operational
All projects expected to be revenue operational within this year
High
Hi h ttraffic
ffi growth
th urban
b corridors
id eg. Delhi,
D lhi BBangalore,
l J i
Jaipur, G
Gurgaon, A
Agra, P
Pune, etc.
t
Concession period ranges between 18 - 30 years
11 Projects I 7 States I 970 kms I ` 115 bn
Slide 21Metro Rail Business
Project Cost Length Concession
Project COD
` bn (Kms) Period*
Mumbai Metro ` 40.3 12 June 2014 35 years^
Line handed over to DMRC
Delhi Airport Metro Express Link ` 28.9 23
wef July 1, 2013
* Including construction period ^ Concession period extended by 755 days
Successfully executed projects in Mumbai and Delhi in challenging environment
First mover advantage and technical expertise will enable RInfra to bid for new projects
Exploring opportunities through EPC,
EPC O&M contract or as a developer of metro rail
First private player to commission metro rail in the country
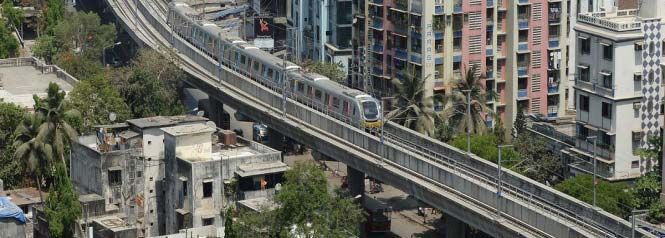
Slide 22Mumbai Metro
Only East to West rail connectivity in Mumbai
Travel time reduced from 90 to ~21 mins
40 mn ridership since commencement
Around 45,000 trips made with >99% service efficiency
Capacity
C to carry 1.1 mn commuters/day
/
Comfortable, Affordable and Safe journey
– Lifeline of Mumbai
Commercial operations commenced in June 2014
Slide 23Cement Business
Operational
Location
Capacity Operational cement capacity of 5.8 MTPA with
Project (mtpa) presence across 6 states in India
Maihar Madhya Pradesh 3.0 Greenfield project in Madhya Pradesh completed at
` 6 bn/ton in a record time of 24 months
Kundangunj Uttar Pradesh 2.0
Aiming 90% clinker capacity utilization by FY15 end
Butibori Maharashtra 0.5
Started exporting clinker
Durgapur West Bengal 0.3 Expanding
p g capacity
p y to 15 MTPA in next 3 yyears
Amongst the top 3 brands in India in terms of pricing
Slide 24Cement Business – Major
j Growth Plans
Upcoming projects in 6 states i.e. Madhya Pradesh, Uttar Pradesh, Bihar, West Bengal,
Jharkhand and Maharashtra
Signed 10 MOUs with various State Governments
11 limestone mineral concessions in various states with cumulative reserve of 1.1 bn MT
Land in possession for future projects ~2,145 acres
Majority of statutory clearance available
Aiming to become the leading player in the sector
Slide 25EPC Business
Amongst the largest EPC player in India with projects completed/undertaken worth ` 900 bn
over last 5 years
Current order book comprises of 11 projects worth ` 61 bn as on September 30, 2014
Consistently maintained EBITDA margin of 8% - 10% over last 6 years
Proven track record of executing large projects
Established “Centre of Excellence” to enhance technical capabilities
p
RInfra is well positioned to capture EPC Opportunities
Slide 26Airport
p Business
Operating 5 brownfield airports in Maharashtra i.e.
Nanded, Latur, Yavatmal, Baramati & Osmanabad
• Lease period : 95 years
• Land area : 1,487 acres
All airports have Charter flight & Corporate Jets
operations
Opportunities :
• Upcoming Navi Mumbai International airport
• 200 low cost airports to connect Tier II & III cities
• 15 new Greenfield airports
Aims to expand its footprint in the airport sector
Slide 27Specialty
Spec a ty Real
ea Estate
state Business
us ess
Developing a 100 storey Trade Tower & Business District
on 80 acres of land in Hyderabad
Strategic location – 6 kms from new international airport
Unlimited FSI & no restriction on mix use
Plans to build 25 mnsqft area – Land in possession
Environmental clearance received for the project
Slide 28Financial Performance - Consolidated
(All figures in ` bn)
Particulars FY11 FY12 FY13 FY14 H1FY15
Conservatively financed
Operating Income 152.2 242.2 223.7 190.3 82.1 Debt : Equity of 0.91x
EBITDA 24.9 35.3 40.2 40.7 22.4
PAT 15.5 15.9 18.7 19.1 8.9
Capex cycle nearing
Networth 236.1 241.3 261.2 271.4 280.4
completion
Debt 116.7 182.9 219.8 242.9 256.6
EPS (`/share) 58.2 60.1 71.2 72.8 33.8
Book Value Reverse Cash flow started
883 918 993 1,032 1,068
(`/share)
Note: PAT and EPS in FY13 excludes exceptional item of “Profit from sale of RPower shares”
Strong balance sheet to drive growth
Slide 29Shareholding
S a e o d g Pattern
atte
MF & Banks Corporate
1% Bodies
2%
Public
10%
Insurance
17% Promoters
49%
FII
22%
A on September
As S t b 30 30, 2014
Largest shareowner family in the sector : 1.2 mn
Slide 30RInfra in 2015
1
All projects to be revenue operational
within FY15
6 2
To capitalize on US$ 1 tn Operating one of the most
infrastructure opportunity efficient distribution networks
5
Amongst lowest leveraged 3
company in infra sector Increase EPC orderbook
4
First mover advantage in
infrastructure sector
Slide 31Human Capital – Our Strength
Young Rev/Employee
8000+ Workforce Productivity
E
Employees
l Average A
A Age ` 2.5 crore
35 years
“People are our Real Assets”
Slide 32Corporate Social Responsibility
Young Energy Savers (YES) campaign about
C
energy conservation
Change for Mumbai : Energy efficient
appliances to consumers at discounted rates
Health Programmes : Free Medical checkup &
S
Blood Donation
Sponsorships : Educational kits, scholarships
computers, sports ground, rainwears, etc.
Earth Hour Participation : Energy conservation
R Vanmahotsav Saptah : Tree Plantation by
employees
Slide 33Awards & Recognition
10 50
HR Quality
Excellence
Award
Award
21 15
BUSINESS Environment
Excellence &
Award Safety Award
Slide 34Thank You
You can also read