Reduced Nitrous Oxide Emissions From Drained Temperate Agricultural Peatland After Coverage With Mineral Soil - Frontiers
←
→
Page content transcription
If your browser does not render page correctly, please read the page content below

ORIGINAL RESEARCH
                                                                                                                                            published: 03 March 2022
                                                                                                                                      doi: 10.3389/fenvs.2022.856599

                                           Reduced Nitrous Oxide Emissions
                                           From Drained Temperate Agricultural
                                           Peatland After Coverage With Mineral
                                           Soil
                                           Yuqiao Wang 1,2*, Sonja M. Paul 1, Markus Jocher 1, Christine Alewell 2 and Jens Leifeld 1,2
                                           1
                                             Climate and Agriculture Group, Agroscope, Zürich, Switzerland, 2Environmental Geosciences, University of Basel, Basel,
                                           Switzerland

                                           Peatlands drained for agriculture emit large amounts of nitrous oxide (N2O) and thereby
                                           contribute to global warming. In order to counteract soil subsidence and sustain
                                           agricultural productivity, mineral soil coverage of drained organic soil is an increasingly
                                           used practice. This management option may also influence soil-borne N2O emissions.
                                           Understanding the effect of mineral soil coverage on N2O emissions from agricultural
                        Edited by:         peatland is necessary to implement peatland management strategies which not only
                 Rosa Francaviglia,
                                           sustain agricultural productivity but also reduce N2O emissions. In this study, we aimed to
        Council for Agricultural and
   Economics Research (CREA), Italy        quantify the N2O emissions from an agriculturally managed peatland in Switzerland and to
                        Reviewed by:       evaluate the effect of mineral soil coverage on these emissions. The study was conducted
                          Ülo Mander,      over two years on a grassland on drained nutrient-rich fen in the Swiss Rhine Valley which
           University of Tartu, Estonia
                      Nicola Dal Ferro,
                                           was divided into two parts, both with identical management. One site was not covered with
            University of Padua, Italy     mineral soil (reference “Ref”), and the other site had a ~40 cm thick mineral soil cover
              *Correspondence:             (coverage “Cov”). The grassland was intensively managed, cut 5–6 times per year, and
                    Yuqiao Wang
                                           received c. 230 kg N ha−1 yr−1 of nitrogen fertilizer. N2O emissions were continuously
  yuqiao.wang@agroscope.admin.ch
                                           monitored using an automatic time integrating chamber (ATIC) system. During the
                    Specialty section:     experimental period, site Ref released 20.5 ± 2.7 kg N ha−1 yr−1 N2O-N, whereas the
         This article was submitted to     N2O emission from site Cov was only 2.3 ± 0.4 kg N ha−1 yr−1. Peak N2O emissions were
                        Soil Processes,
                a section of the journal   mostly detected following fertilizer application and lasted for 2–3 weeks before returning to
   Frontiers in Environmental Science      the background N2O emissions. At both sites, N2O peaks related to fertilization events
        Received: 17 January 2022          contributed more than half of the overall N2O emissions. However, not only the fertilization
       Accepted: 10 February 2022
                                           induced N2O peaks but also background N2O emissions were lower with mineral soil
        Published: 03 March 2022
                                           coverage. Our data suggest a strong and continued reduction in N2O emissions with
                            Citation:
Wang Y, Paul SM, Jocher M, Alewell C       mineral soil cover from the investigated organic soil. Mineral soil coverage, therefore,
and Leifeld J (2022) Reduced Nitrous       seems to be a promising N2O mitigation option for intensively used drained organic soils
      Oxide Emissions From Drained
Temperate Agricultural Peatland After      when a sustained use of the drained peatland for intensive agricultural production is
          Coverage With Mineral Soil.      foreseen, and potential rewetting and restoration of the peatland are not possible.
     Front. Environ. Sci. 10:856599.
    doi: 10.3389/fenvs.2022.856599         Keywords: organic soil, mineral soil coverage, peatland management, fertilizer, GHG mitigation

Frontiers in Environmental Science | www.frontiersin.org                          1                                          March 2022 | Volume 10 | Article 856599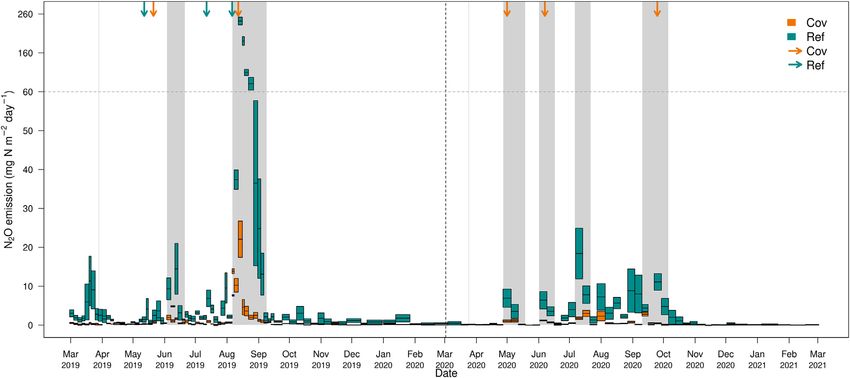
Wang et al.                                                                                                               N2O Reduction for Drained Peatland

1 INTRODUCTION                                                             TABLE 1 | Surface (0–10 cm) soil properties of drained organic soil with (Cov) and
                                                                           without (Ref) mineral soil coverage (n = 11).

Nitrous oxide (N2O) is the third most important long-lived                 Parameter                                      Cov                        Ref
greenhouse gas (GHG) and also an important reactant with                                        −3 a
                                                                           Bulk density (g cm )                         1.1 ± 0.04                0.5 ± 0.01
stratospheric ozone (Ravishankara et al., 2009; Prather et al.,
                                                                           pH                                               7.3                       5.2
2015). In the last centuries, N2O emission increased from                  Sand (%)a                                       31.8                       0.6
~12 Tg N yr−1 in the preindustrial period to ~19 Tg N yr−1                 Silt (%)a                                       52.3                      67.3
(Syakila and Kroeze, 2011). To a large extent, the rapid                   Clay (%)a                                       15.9                      32.1
increase in N2O emissions is driven by soil-borne N2O, which               Total pore volume (%)a                       58.4 ± 1.5                75.1 ± 0.5
                                                                           Field capacity (%)a
increased from ~6.3 Tg N yr−1 to ~10 Tg N yr−1 over the same
                                                                                                                        51.4 ± 0.9                57.9 ± 0.6
                                                                           Total N (%)                                 0.30 ± 0.03               1.46 ± 0.04
period, accounting for ~53% of the total N2O increase (Tian et al.,        SOC (%)                                     3.57 ± 0.52              17.68 ± 0.47
2019). Therefore, lowering soil N2O emission is of great                   C to N ratio                               11.68 ± 1.15              12.12 ± 0.16
importance for global N2O mitigation, and consequently for                 NH4+(N mg kg−1 dry soil)b                   2.62 ± 0.96              37.33 ± 12.07
                                                                           NO3−(N mg kg−1 dry soil)b                   2.81 ± 1.21               5.16 ± 1.13
meeting the climate target.
    Peatlands only account for 3% of the terrestrial land surface          a
                                                                               Measured at depth of 3–8 cm, n = 12.
                                                                           b
but store around 644 Gt organic carbon (C) (Yu et al., 2010).                  n = 8.

Peatlands are also an important pool of organic nitrogen (N) of
8–15 Gt N (Leifeld and Menichetti, 2018). To date, more than
10% of the global peatland areas have been drained for agriculture         soil N2O production (Stehfest and Bouwman, 2006; Flechard
and forestry, with a much higher share in some European                    et al., 2007). Second, mineral soil coverage alters soil hydraulic
countries, where around half of the peatlands are artificially              properties and soil aeration due to the changing pore size
drained to enhance agricultural and forest productivity in                 distribution. Soil moisture and concomitantly the amount of
Europe, and even ~90% in Switzerland (Bragg et al., 2013;                  oxygen are important regulators for microbial activity, thus
Wüst-Galley et al., 2015; Kasimir et al., 2018). However, long-            affecting nitrification, denitrification, and subsequent N loss as
term drainage causes peatland subsidence due to physical                   N2O (Davidson et al., 2000).
processes and mineralization of the surface peat. These                       In Switzerland, peatlands covered an area of ca.
processes cause soil degradation and induce very high GHG                  1,000–1,500 km2 in preindustrial times. Today, most of the
emissions, which turned the global peatland biome from a net               former organic soils are already lost, with only ~280 km2 left.
GHG sink to a net source. It has been estimated that with the              Ninety percent of the remaining organic soils are still drained for
ongoing peatland degradation, c. 2.3 Gt N will be released globally        agriculture (Wüst-Galley et al., 2020) and continuously
(Leifeld and Menichetti, 2018). In Europe, peatland management             contribute to the national economic values of agriculture
induces N2O emission of c. 145 Gg N yr−1 (Liu et al., 2020). Full          output. It is estimated that these soils emit around 1.2–7.9 kg
peatland restoration or other steps involving rewetting decrease           N2O-N ha−1 yr−1 (Leifeld, 2018), corresponding to an annual
the peat oxidation by re-raising the water table (Blodau, 2002)            N2O emission of c. 65 kt CO2-eq, or ~10% of the national GHG
and might save substantial parts of the N mineralization and also          emissions from drained organic soil (FOEN, 2021). However,
halt peatland subsidence (Knox et al., 2015; Hemes et al., 2019).          hitherto neither N2O flux measurements from organic soil do
However, with rewetting, intensive agricultural production is in           exist for Switzerland nor are experimental data available to
many cases not possible anymore. Hence, there is a trade-off               quantify the impact of mineral soil coverage on N2O
between environmental goals and agricultural production                    emissions from drained peatland.
demands that creates challenges to implementing peatland                      In this study, we utilized an automatic time integrating
restoration (Ferré et al., 2019). Therefore, peatland                      chamber system (ATIC) to determine the N2O emission from
management strategies, which could not only sustain the                    long-term intensively managed temperate drained peatland with
productive use of organic soil but also counterbalance soil                (Cov) and without (Ref) mineral soil coverage. Our specific
subsidence and reduce N2O emission, are urgently needed. It                objectives were to 1) quantify the N2O emission from a
has been reported that artificial mineral soil coverage with                drained nutrient-rich managed peat meadow in the Swiss
thicknesses of 0.2–0.5 m is becoming an increasingly used                  Rhine valley and 2) explore the effect of mineral soil coverage
practice in Switzerland and other European countries                       on N2O fluxes from this soil.
(Schindler and Müller, 2001; Ferré et al., 2019). Mineral soil
coverage may have two main impacts on N and C transformation
and N2O emissions. First, it changes the topsoil properties of             2 MATERIAL AND METHODS
drained organic soil and influences substrate availability for N2O
production. As the soil depth from which emitted N2O originates            2.1 Study Site
is only 0.7–2.8 cm, the topsoil properties are particularly relevant       The measurements were carried out in the Swiss Rhine Valley, at
for N2O emission (Neftel et al., 2000). After mineral soil coverage,       the site Rüthi (47°17′ N, 9°32′ E), a drained fen with a peat
the topsoil contains much less organic matter than the degrading           thickness of ~10 m. The site has a cool temperate moist climate
peat. With this, carbon and nitrogen availability for                      with a mean annual precipitation of 1,297 mm and a mean annual
denitrification might become limiting, thereby also influencing              temperature of 10.1°C (1981–2010, https://www.meteoswiss.

Frontiers in Environmental Science | www.frontiersin.org               2                                              March 2022 | Volume 10 | Article 856599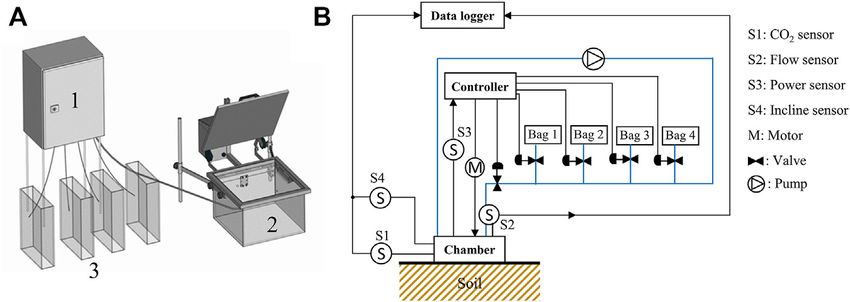
Wang et al.                                                                                                                          N2O Reduction for Drained Peatland

 FIGURE 1 | Brief overview of the automatic time integrating chamber system ATIC (A) and basic outline of ATIC gas sampling (B); black line indicates the control
 signal pathway, and blue line indicates the sample gas pathway.

admin.ch). Drainage with ditches commenced before 1890                                  City, NY, United States), lid inclinometer sensor (DIS Sensors,
(https://map.geo.admin.ch). An integral drainage system with                            Netherland), and motor connected with the lid of the chamber
drainage pipes (depth 1 m, distance between pipes 14 m) and a                           through pulley and rope (Figure 1A, unit 2); 2) an associated
pump was built in 1973; at the same time, the site was used as                          controller system, including the main control module (Siemens,
pasture until 2013, and since then as an intensively managed                            Germany), and the data logger (Onset, MA, United States) for the
meadow with mineral and slurry fertilization and 5–6 grass cuts                         sensors attached with the chamber (Figure 1A, unit 1); and 3) 4
per year. In 2006–2007, one part of the field (1.7 ha) was covered                       replaceable foil gas bags (Supelco, Germany; Figure 1A, unit 3).
with mineral soil material (thickness around 40 cm, see details in                      The controlling system opens and closes the chamber lid through
Table 1) to improve the trafficability and agriculture usability by                      the motor. Each chamber was placed on a PVC frame, inserted
raising the soil surface and counterbalancing peat subsidence. We                       5 cm into the soil. Flexible silicone attached below the chamber
established our field experiment at this mineral soil coverage site                      and the foam sealing above the chamber was used to achieve gas
(Cov) and used the adjacent drained organic soil without mineral                        tightness of the chamber.
soil coverage as the reference (Ref, see details in Supplementary
Figure S1). Both sites have identical farming practices and similar                     2.2.2 N2O Sample Accumulation and Analysis
vegetation. Dominant grass species are Lolium perenne,                                  N2O fluxes were measured quasi-continuously for two entire
Alopecurus pratensis, Festuca arundinacea, Trifolium spec., and                         years from 28 February 2019 to 02 March 2021. Here, we
Festuca pratensis. The atmospheric N deposition at the study site                       designate the first sampling year period (from 28 February
as estimated for 2015 is 20–30 kg N ha−1 yr−1 (Rihm and Künzle,                         2019 to 28 February 2020) as the first year and the second
2019).                                                                                  sampling year period (from 28 February 2020 to 02 March
                                                                                        2021) as the second year. In the study site, the ATIC systems
2.2 N2O Flux Measurements                                                               (four on Cov, four on Ref) were installed on 13 February 2019 for
2.2.1 Automatic Time Integrating Chamber System                                         testing. On 28 February 2019, eight ATIC systems (four on Cov
The ATIC system used here was developed based on the                                    and four on Ref) started to collect gas samples with a frequency
automatic chamber system design introduced by Flechard                                  (time between measurement cycles) of 3–9 h per individual
et al. (2005), and the air sampling follows the system                                  chamber, differing between growing season and non-growing
introduced by Ambus et al. (2010). The ATIC is operated as a                            season. Here, we define a measurement cycle as a lid closing phase
non-steady-state flow-through chamber with a main loop that                              of 15 min with sequential gas sampling into each of the four foil
recirculates the headspace chamber air (Figure 1). The lid of the                       gas bags.
chamber closes automatically for 15 min. During this period, four                           The bags were filled at 3.50, 7.25, 11.50, and 14.25 min after
headspace gas samples are collected (at 3.50, 7.25, 11.50, and                          chamber closure, respectively, and the gas samples from
14.25 min after chamber closure) for 15 s and flushed into four                          individual cycles were accumulated in these four foil gas bags.
different foil gas bags through a valve manifold. The use of the                        The final bag samples represented an average over a time period
ATIC system allows flux measurements at relatively high                                  of 3–14 days (hereafter referred to as “sampling period”),
frequency (like for online automatic chamber systems) but                               depending on the sampling frequency and the total number of
reduces the frequency of gas analysis and avoids the use of                             measurement cycles. Usually, gas samples accumulated in the
online trace gas analysis, which lowers the cost and energy                             bags over 30–40 cycles, which was limited by the volume of the
consumption in the field. The ATIC runs with a battery                                   foil gas bag (10 L) and the flow rate of the pump (1 L min−1). After
(12 V) or power line, and the latter is used in our experiment.                         the sampling period, the foil gas bags were replaced with empty
It consists of three parts: 1) a stainless steel chamber (L = l =                       ones, and the filled gas bags were transferred to the lab to
300 mm, H = 220 mm) with a pump (Thomas, Germany), CO2                                  determine their gas concentration using the gas analyzer
sensor (Senseair, Sweden), flow sensor (McMillan, New York                               (G2308, Picarro, Santa Clara, CA, United States). Overall, each

Frontiers in Environmental Science | www.frontiersin.org                            3                                           March 2022 | Volume 10 | Article 856599
Wang et al.                                                                                                       N2O Reduction for Drained Peatland

ATIC system was working for ~3,200 cycles during the two entire              the real-time headspace chamber CO2 concentration and the
years. The foil gas bags have been tested and proven to be suitable          incline angle between the lid and chamber allowed us to detect
for long-term storage of N2O near ambient concentrations in air              any operational chamber problem (e.g., leakage and power
(Supplementary Figure S2).                                                   failure). The CO2 fluxes during each chamber closure time
                                                                             were evaluated by linear regression, and an overall R2 ≥ 0.9
2.3 N2O Flux Calculation                                                     was taken as an indicator for a fully functional ATIC within the
For static (non-steady-state) chamber measurement, the increase              sampling period. With the comparison between the average CO2
in headspace gas concentration is widely thought to be linear                fluxes during each chamber closure time and the CO2 fluxes from
during a short closure time (Charteris et al., 2020). The analysis of        the ATIC system within each sampling period, we determined
the gas bags as described in the previous section resulted in four           whether the gas fluxes from the ATIC system represented the
average concentrations, C1.  . . C4,
                                    for each chamber and                    average gas fluxes within the sampling period (Supplementary
sampling period. Calculating a linear regression of the four                 Figure S3). N2O fluxes calculated from the concentration
concentrations against their sampling times (3.50, 7.25, 11.50,              gradient from the four foil gasbags were selected for post-
and 14.25 min after chamber closure) yielded the regression slope            processing after fulfilling certain quality criteria. First, R2 of

zC/zt  (mg m−3 min−1) from which the average flux of the                      CO2 fluxes calculated from the regression lines of the four
sampling period was derived as:                                              bags had to exceed 0.9, indicating that within the sampling
                                                                            days, the ATIC worked properly. R2 ≤ 0.9 indicated a failure
                                      V zC
                                F     ×   ,                      (1)        of gas sampling within the sampling days, which led to a rejection
                                      A zt                                   of the N2O flux data. Second, R2 > 0.9 of the N2O regression lines
where V and A are the volume (m3) and the covered area (m2) of               was used as critical to accept the data for further analysis.
the static chamber, 0.02 m3 and 0.09 m2, respectively. Since each            However, low fluxes (±0.5 mg N m−2 day−1, calculated based on
average bag concentration C   a is the arithmetic average of the            the detection limit of the Picarro) were accepted regardless of R2.
respective concentrations in each cycle (Ca,b ), where a (a = 1, 2, 3,       With low fluxes, the random error of the measurement could be
4) is the number of bags and b is the number of cycles, the average          larger than the N2O concentration difference between different

slope zC/zt    also represents the average of the individual                 sampling points, which could result in low R2, and therefore,
concentration increases of each measurement cycle (zCb /zt) in               rejection of the N2O emission based on low R2 would lead to an
the sampling period. Therefore, F (Eq. 1) represents the average             underestimation of the overall fluxes. After two years of
gas flux of each sampling period.                                             continuous field observation, the N2O data could cover ~86%
    The multiplication of gas fluxes during each sampling period F            of the sampling days, that is, a data gap of ~14%.
(mg N m−2 day−1) and the duration of each sampling period T
(days) yielded the cumulative gas fluxes of each sampling period.             2.4.2 Gap Filling
Finally, the annual cumulative N2O fluxes (Fa, kg N ha−1) were                For any missing N2O emissions outside the fertilization event
calculated from the cumulative gas fluxes of each sampling period             (background N2O emissions), that is, values missing owing to a
as given below:                                                              failure of ATIC systems or a rejection of data, a look-up table
                                                                             approach with two parameters (soil moisture and soil
                                        in
                             Fa  i1 Fi pTi ,                   (2)        temperature) was used to fit the missing values (RMSE =
                                                                             0.62 mg N m−2 day−1, R2 = 0.60), and tested by the available
where Fi is the N2O emission (mg N m−2 day−1) from sampling                  background N2O values through cross-validation. For each
period i, and Ti is the duration of each sampling period i                   chamber, background N2O emissions were divided into 16
(days).                                                                      classes based on soil moisture (0–25th percentile, > 25th
   N2O fluxes resulted from fertilization induced N2O peaks                   percentile–median, > median–75th percentile, and > 75th
(F-peak) and background N2O emissions. The comparison of                     percentile), and soil temperature (0–25th percentile, > 25th
N2O emissions before and after a fertilization event allowed for             percentile–median, > median–75th percentile, and > 75th
the detection and quantification of F-peak N2O emissions.                     percentile). With the assumption that without extra fertilizer
Quantifying background N2O emissions after fertilization                     input background N2O should respond similar to similar soil
event is challenging, and here, we use mean N2O emissions                    temperature and moisture conditions at each site, the mean N2O
one week before fertilization to represent the background N2O                fluxes from each class were used to fit the missing value under the
emissions during the fertilization event and for further analysis of         same soil temperature and moisture condition. To check the
the F-peaks. Only when the observed N2O emissions during a                   sensitivity of the N2O gap-filling method for the background
fertilization event were higher than the background N2O                      fluxes, two other methods were compared with the look-up table
emissions, we consider this as F-peak induced by the                         approach: 1) linear interpolation (RMSE = 0.65 mg N m−2 day−1,
fertilization event.                                                         R2 = 0.51) to bridge the missing values and 2) taking mean values
                                                                             from the properly operating chambers for each site (RMSE =
2.4 Data Quality Control and Gap Filling                                     1.3 mg N m−2 day−1, R2 = 0.36). For an N2O gap caused by a
2.4.1 Data Quality Control                                                   power failure during the fertilization event on 30 August 2019
The accuracy of the ATIC system was accessed by the CO2 and                  (site Ref), data were linearly interpolated to fill the data gap. For
inclinometer sensors inside the chamber. The measurement of                  the failure of individual chambers (n = 6) during fertilization

Frontiers in Environmental Science | www.frontiersin.org                 4                                    March 2022 | Volume 10 | Article 856599
Wang et al. N2O Reduction for Drained Peatland
events, mean values from the properly operating chambers at 72 h, ground using mortar and pestle, and then milled in a ball
each site were used to fill the data gap. mill (Retsch, MM 400, Germany) at 25-rotation s−1 for 3 min.
Samples containing carbonate (soil surface from Cov) were
2.5 Additional Measurements fumigated with hydrochloric acid overnight in a desiccator
2.5.1 Environmental Variables before being analyzed by elemental analysis (Hekatech,
The air temperature was measured using a Vaisala Weather Germany). For soil pH, soil (unground) was suspended 10 g in
Transmitter (WXT520, Finland) and continuously logged 0.01 M calcium chloride (CaCl2), shaken at 160 cycles min−1 for
every 10 min on a CR1000 data logger (Campbell Scientific, 15 min, and left overnight before the soil pH was measured
United Kingdom). Rainfall data and missing air temperature with a flat surface electrode (pH3310, WTW, Germany). For
(27 December 2020 to 2 February 2021) were filled with data ammonium and nitrate measurements, 16 soil samples
from a nearby meteorological station operated by MeteoSwiss were taken in July 2021, with eight replications at each site.
(https://www.meteoswiss.admin.ch). Soil temperature and soil Soil N was extracted from 20 g field-moist soil with 0.01 M
moisture (GS3 and 5 TE decagon devices, NE Hopkins Court, CaCl2 solution and filtered. The filtrate was analyzed by
United States) were continuously recorded half-hourly at a depth segmented flow injection analysis (Skalar Analytical B.V.,
of 5 cm for both Cov (n = 3) and Ref (n = 3). On 4 December Breda, Netherlands). The C and N content in the slurry
2019, 24 additional soil temperature sensors (UA-001-64 devices, was determined in a central laboratory (Labor für Boden
Onset, MA, United States) were installed near each chamber at und Umweltanalytik, Eric Schweizer AG, Thun, Switzerland.
three depths (0, 2.5, and 5 cm) for recording surface soil For details about N application rate and frequency, see
temperature in winter. These sensors were taken out on 21 Table 2).
April 2020 for reading out the data, and the same process was
followed for winter 2020/2021. Close to the chambers, the soil 2.6 Data Analysis
volumetric water contents at −5 cm depth were consistently Plots and statistical analysis were performed using open-source
recorded every 10 min with soil moisture sensor (EC-5, software R (version 3.6.0, The R Project, 2014). N2O emissions as
decagon devices, NE Hopkins Court, United States). Missing measured by the ATIC systems were calculated based on linear
soil temperature data—due to a failure of a data logger between regression in R. Environmental parameters including soil
November to December 2019 and April to May 2020 (site Cov)— temperature, soil moisture, air-filled porosity, and Dp/D0 were
were fitted using linear regression between temperatures of the calculated and plotted as daily means. A multiple linear
two sites with a similar temperature range (RMSE = 0.07°C, R2 regression (MLR) model with unstandardized explanatory
= 0.98). variables was used to evaluate the drivers for the F-peak and
daily background N2O emissions, with soil temperature, water-
2.5.2 Soil Properties and Fertilizer Nutrient filled pore space, and nitrogen (N) input as explanatory variables.
To determine the soil pore volume, on 12 April 2019, 72 For each of those variables, its statistical significance to the MLR
undisturbed cylindrical soil samples (100 cm−3) were collected model was chosen as p < 0.05. The adjusted coefficient of
at three depths (3–8, 18–23, and 58–63 cm) with 12 replications at determination (R2adj) is then given by the number of driving
each site and transferred to the laboratory. In the laboratory, variables and the sample size, and is used to describe the
different pore diameters were measured following the approach explained variation of the dependent variable. For the daily
by Keller et al. (2019). For this, samples were saturated from background N2O emissions, the minimum N2O flux plus one
below and then drained to soil matric potentials of −30, −60, (which was determined by the minimum observed N2O emission
−100, −300, and −1,500 kPa. data) was added to N2O fluxes separately for the two sites and log-
Air porosity was calculated based on the difference between transformed before being applied to the MLR model. The
volumetric water content (VWC) and total pore volume. The difference in soil temperature, soil moisture, air-filled porosity,
relative gas diffusion coefficient (Dp/D0) was calculated based daily N2O emission, annual N2O emission, daily N2O emission
on air-filled porosity by following the approach by Keller et al. from fertilization events (daily F-peak N2O), fertilization-induced
(2019). A Dp/D0 of 0.02 has been suggested as the critical N2O peaks, daily background N2O emission, and cumulative
threshold for adequate soil aeration, and the Dp/D0 value background N2O emission were analyzed for statistical difference
lower than 0.02 indicates insufficient soil aeration between Cov and Ref by using a t-test. An error probability of p <
(Schjønning et al., 2003). The water-filled pore space was 0.05 was chosen. Results are always reported as mean ±1 standard
determined by the ratio of volumetric water content and error (se).
total pore volume, and field capacity was determined by For the annual N2O emission from Cov and Ref, we
water retention at −30 kPa. Here, we used the threshold of calculated the standard error based on the spatial variability
80% of the field capacity for each site to roughly distinguish dry among the four ATIC systems for both sites. The annual
and wet conditions separately for Cov and Ref. Soil moisture of cumulative se of each N2O flux calculation by linear
below 80% of the field capacity was designated as dry, and >80% regression within each chamber contributed only 0.1% to
of the field capacity as wet. the se derived from the spatial variability of the four
For soil organic carbon (C) and total nitrogen (N) content replicates. Therefore, we believe that the se derived from
measurement, 22 soil samples were taken in 2018, with 11 spatial variability covers the overall se inherent to our N2O
replications at each site. Soil samples were dried at 105°C for flux calculations.
Frontiers in Environmental Science | www.frontiersin.org 5 March 2022 | Volume 10 | Article 856599Wang et al. N2O Reduction for Drained Peatland
TABLE 2 | Fertilization event-induced nitrous oxides (N2O) fluxes (mean ± se, n = 4) and associated environmental parameters, soil temperature (Tsoil), and water-filled pore
space (WFPS) from drained organic soil with (Cov) and without (Ref) mineral soil coverage.
Date Fertilization F-peak N2O flux (kg N ha−1) Fraction of N loss* (%) Tsoil (°C) WFPS (%)
(kg N ha−1)
Cov Ref Cov Ref Cov Ref Cov Ref
28 March 19a 87 0 0 0 0 8.0 8.1 53.7 53.6
03 June 19b 32 0.01 ± 0.009 0.07 ± 0.02 0.03 ± 0.02 0.22 ± 0.04 18.6 18.8 57.8 65.6
06 August 19a 85 2.01 ± 0.32 25.50 ± 2.15 2.37 ± 0.38 30.04 ± 2.53 20.8 20.3 67.6 69.0
24 March 20a 62 0 0 0 0 5.8 5.5 73.3 73.4
27 April 20a 65 0.16 ± 0.05 0.77 ± 0.31 0.25 ± 0.07 1.18 ± 0.47 15.0 14.8 67.6 69.7
02 June 20b 26 0.13 ± 0.008 0.70 ± 0.23 0.50 ± 0.03 2.69 ± 0.88 17.8 17.7 67.1 69.4
07 July 20b 26 0.28 ± 0.07 1.43 ± 0.56 1.08 ± 0.27 5.50 ± 2.16 21.4 20.9 66.9 70.3
10 74 0.003 ± 0.005 0.62 ± 0.16 0.004 ± 0.007 0.84 ± 0.21 20.6 19.8 61.1 62.9
September 20a
*Equivalent fraction of fertilization induced N2O emission and the fertilizer N input, mean ± SE (n = 4).
a
Nitrogen (N) inputs as slurry.
b
Nitrogen (N) inputs as synthetic fertilizer.
3 RESULT emissions were ~2 times higher than the second year ones. The
annual N2O fluxes for the two years were different for both sites,
3.1 Environmental Conditions but the N2O emissions from Ref were still clearly higher (p < 0.01)
The two sampling years had a mean annual air temperature of than those from Cov. In the first year, the cumulative annual N2O
10.7°C (Figure 2A) and annual precipitation of 1,535 mm. The flux from Ref was 32.71 ± 3.87 kg N ha−1 yr−1, around 11 times
latter was higher in the first (1,690 mm) than in the second year higher than Cov (3.18 ± 0.35 kg N ha−1 yr−1; Figure 4A). In the
(1,380 mm, Figure 2B). The two years and two sites had similar second year, the annual N2O fluxes from Ref was 8.28 ±
daily mean soil temperature on average. At both sites, 5 cm soil 1.77 kg N ha−1 yr−1 (Figure 4B), which was around six times
temperature was continuously above 0°C during the two sampling higher than Cov (1.33 ± 0.23 kg N ha−1 yr−1). The difference of
years despite frequent winter frost (Figure 2A). In the second N2O emissions between the sites was not only related to higher
year, spring and summer were moister with ~10.9 and ~11.4% (p < 0.01) fertilization-induced peak N2O emissions from Ref
higher (p < 0.01) soil water-filled pore space (WFPS) during (42.48 ± 3.34 mg N m−2 day−1) than Cov (3.41 ±
March to June and June to August, respectively, than in the first 0.54 mg N m−2 day−1) but also driven by higher (p < 0.05)
year. Soil WFPS was not different between sites but more background N2O emissions from Ref (1.63 ±
variable for Cov (30.8–91.6%) than for Ref (24.2–76.4%, 0.46 mg N m−2 day−1) than Cov (0.27 ± 0.04 mg N m−2 day−1,
Figure 2B). During spring and summer of 2019, air-filled see Figure 4C). A similar pattern was seen in the second year
porosity was higher (p < 0.05) than that in 2020 by ~ 3.9 (Figure 4D).
and ~5.4%. Air-filled porosity was almost continuously higher
(p < 0.01) at Ref than at Cov (Figure 2C). Consequently, the 3.3 Main Driving Factors of N2O Emissions
relative gas diffusion coefficient of Ref exceeded that of Cov (p < 3.3.1 Fertilization Effect
0.01). At Cov, the relative gas diffusion coefficient was lower At both sites, high N2O emission peaks were primarily triggered
than the critical threshold for adequate soil aeration (0.02) at by fertilization events (F-peak) and lasted for 2–3 weeks before
172 days, whereas it never passed the critical threshold at Ref returning to background N2O emissions (Figure 3). There were
(Figure 2D). eight fertilization events during the experimental period, but we
only observed six F-peaks during summer and autumn when the
3.2 N2O Emissions soil temperature was high (Table 2). To further explore the
The N2O emissions integrated over two years of continuous field influence of N input on N2O emissions, we defined a
measurement from Ref exceeded that of Cov by a factor of 9 corresponding fraction of N loss as the ratio of the N2O
(Figure 3). Daily N2O emissions showed a larger variability during emissions during each F-peak and the corresponding fertilizer
the first year, ranging from −0.02 to 242.01 mg N m−2 day−1 for N input. We found the fraction of N loss to be higher at Ref than
Ref, and from −0.04 to 22 .08 mg N m−2 day−1 for Cov. During the at Cov (p < 0.01) for each of the six individual F-peaks. In the first
second year, daily N2O emission ranged from −0.04 to year, F-peaks contributed ~78% to the annual N2O emissions at
18.41 mg N m−2 day−1 for Ref and from −0.04 to 2.80 mg N m−2 Ref, corresponding to 25.56 ± 2.15 kg N ha−1. At Cov, F-peaks
day−1 for Cov (Figure 3). At Ref, the average daily N2O emissions contributed ~64% to the annual N2O emissions, corresponding to
during the first year was 8.98 ± 1.03 mg N m−2 day−1, which was 2.02 ± 0.32 kg N ha−1 (Figure 4A). For the second year, at both
higher (p < 0.01) than that of Cov (0.86 ± 0.10 mg N m−2 day−1, see sites, F-peak fluxes only contributed ~43% to the annual N2O
Figure 4C). emissions, corresponding to 3.51 ± 0.84 kg N ha−1 for Ref and
Overall, N2O emissions differed largely between the two sites 0.57 ± 0.11 kg N ha−1 for Cov (Figure 4B). It needs to be noted
and the two years. At Ref, emissions were ~4 times higher during that during the fertilizer event in August 2019, we observed a
the first year than during the second year. At Cov, the first year relatively high peak at both sites (Figure 3), which extended over
Frontiers in Environmental Science | www.frontiersin.org 6 March 2022 | Volume 10 | Article 856599Wang et al. N2O Reduction for Drained Peatland
FIGURE 2 | Daily mean soil (dark green and orange lines are overlaying because of the high similarity of the soil temperature at Cov and Ref) and air (light green)
temperature (A), soil water-filled pore space and rainfall (B), air-filled porosity (C), and relative gas diffusion coefficient (DP/D0, D) from drained peatland with (Cov) and
without (Ref) mineral soil coverage at 5 cm depth. The horizontal dashed line in panel (D) indicates the critical threshold for adequate soil aeration, which was set at 0.02
by Schjønning et al. (2003). The vertical dashed line separates the first year (28.02.2019–28.02.2020) from the second year (28.02.2020–02.03.2021). The shaded
areas indicate time periods influenced by fertilization events.
25 days (8 sampling periods). The N2O emissions from this high variability of F-peak emission was mainly driven by soil
peak contributed ~78% to the annual N2O emissions to Ref and temperature and N inputs (p < 0.05; p < 0.01), and the two
~64% to Cov. parameters were positive drivers for F-peak N2O emissions. In
addition, the average WFPS during the fertilization events also
3.3.2 Environmental Parameters contributed significantly to the variability of the F-peak N2O
In order to identify the main driving factors for N2O emissions, emissions at both sites. For background N2O emissions, the
regression analyses were applied separately on fertilization- variation in N2O emissions explained by the MLR model was
induced and background N2O emissions. For fertilization- low with R2 of 0.10 (Cov) and 0.16 (Ref). The impact of the two
induced N2O emissions, the regression analysis was performed potentially driving parameters soil temperature and soil WFPS
on each individual fertilization-induced F-peak. We found that 50 differed between Cov and Ref. Overall, soil temperature was a
to 60% of the variation in F-peak N2O emissions could be significant driver for background N2O emissions at both sites (p <
explained by the multiple linear regression model with soil 0.01), but the effect of soil WFPS on background N2O emissions
temperature, soil water-filled pore space, and amount of N was not significant (Table 3). A threshold of 80% of the field
input as explanatory variables (Table 3). At both sites, the capacity was used to define dry and wet conditions in the field. At
Frontiers in Environmental Science | www.frontiersin.org 7 March 2022 | Volume 10 | Article 856599Wang et al. N2O Reduction for Drained Peatland
FIGURE 3 | Comparison of gap-filled N2O emissions (mean ± se, n = 4) from drained organic soil with (Cov) and without (Ref) mineral soil coverage for the period
28.02.2019–02.03.2021. The width of the box represents the length of each sampling period. Each box shows the mean ± se (n = 4) value of N2O emissions from four
chambers per site. The shaded areas indicate time periods influenced by fertilization events. Arrows on the top indicate when field conditions changed from long-term dry
to wet. The vertical black dashed line separates the first year (28.02.2019–28.02.2020) from the second year (28.02.2020–02.03.2021). For better readability, the
scale of the y-axis is expended ten times for N2O emission higher than 60 mg N m−2 day−1, indicated by a gray dashed line.
Ref, soil WFPS was a positive driver for background N2O normally positive correlation between soil temperature and N2O
emissions during dry conditions in the field, whereas it was emission that we found, in line with previous studies
negative under wet conditions (p < 0.01). At Cov, soil WFPS (Marushchak et al., 2011; Parn et al., 2018). Regarding
only exerted limited influence on background fluxes. fertilizer input, our site received c. 230 kg N ha−1 yr−1, which is
much above the average rate of ~44 kg N ha−1 yr−1 for drained
grassland organic soils across Europe (Leppelt et al., 2014), and
4 DISCUSSION ~52 kg N ha−1 yr−1 of drained fens managed as grassland in
Germany (Tiemeyer et al., 2016). Moreover, for some of the
4.1 Magnitude of N2O Fluxes From the Two study sites mentioned by Tiemeyer et al. (2016), where fertilizer
Sites input was higher than 300 kg N ha−1 yr−1, these authors also
Our continuous two years of field N2O observation showed that reported higher N2O emissions of 6.4–27.2 kg N ha−1 yr−1.
the drained nutrient-rich fen (Ref) emitted 20.5 ± With mineral soil coverage, the N2O emissions were strongly
2.7 kg N ha−1 yr−1. This was substantially higher than the IPCC reduced (2.3 ± 0.4 kg N ha−1 yr−1) and also lower than the IPCC
default value and its 95% confidence interval, 8.2 (4.9–11) emission factor for managed deeply drained nutrient-rich
kg N ha−1 yr−1 (IPCC, 2014). Moreover, the study site also grassland on organic soil (8.2 kg N ha−1 yr−1; IPCC, 2014). It is
emitted substantially more N2O than 25 measured fen peats in not possible to compare the N2O emission from Cov with former
Germany (average 2.9 ± 2.7 kg N ha−1 yr−1; Tiemeyer et al., 2016), studies, because no N2O emission data from drained peatland
and also more than the average from drained grassland organic with artificial mineral soil coverage exist up to date. The observed
soils from 217 annual budgets across Europe (5.8 ± N2O emissions from Cov were in the range of N2O emissions
10.3 kg N ha−1 yr−1; Leppelt et al., 2014). However, the annual from mineral grassland soils in Switzerland. These have been
N2O emissions from the study site were lower than the N2O reported to be 1.0–2.6 kg N ha−1 yr−1 N2O-N from an intensively
emissions from drained fens with high organic carbon in Slovenia used grassland in the temperate Swiss Central Plateau with a
(37.1 ± 0.2 kg N ha−1 yr−1; Danevčič et al., 2010). In our opinion, fertilization rate of ~200 kg N yr−1 (Flechard et al., 2005);
these differences in the N2O emissions from drained fens between 2.2–7.4 kg N ha−1 yr−1 from another intensively used grassland
our site and the bulk of measurements from temperate grasslands in the Swiss Central Plateau during 2010–2011 and 2013–2014
are mainly driven by climate conditions and the amount of with extra total N inputs of ~350 kg N yr−1 (Merbold et al., 2021);
fertilizer input. Compared with the overall peatland and 3.9–5.9 kg N ha−1 yr−1 from an intensively used grassland in
distribution across Europe (Tanneberger et al., 2017), our site the Swiss Plateau during 2013–2016 with extra total N inputs of
and the Slovenian site (Danevčič et al., 2010) are situated in ~270 kg N yr−1 (Fuchs et al., 2020). Based on IPCC (2019), a
regions with relatively high soil temperatures, particularly during fertilizer N input of c. 45 kg N ha−1 yr−1 mineral and c.
summer. This may foster higher N2O emissions, owing to the 185 kg N ha−1 yr−1 organic fertilizer nitrogen (N) as in our
Frontiers in Environmental Science | www.frontiersin.org 8 March 2022 | Volume 10 | Article 856599Wang et al. N2O Reduction for Drained Peatland
FIGURE 4 | Cumulative N2O emissions (mean ± se, n = 4) and contribution of the emission types to the overall field N2O emission from drained organic soil with
(Cov) and without (Ref) mineral soil coverage during the first year (A) and the second year (B); and average daily N2O emission (mean ± se, n = 4) for two emission types
during the first year (C) and the second year (D). Significant differences between the two sites are indicated with asterisks (“**” p < 0.01, “*”p < 0.05).
TABLE 3 | Regression analysis using log-transformed background N2O fluxes, and fertilization-induced N2O fluxes from each chamber as the dependent variable and soil
temperature (Tsoil), water-filled pore space (WFPS), and nitrogen input (N input) as explanatory variables.
Site Parameters R2 (R2adj) a (Tsoil) b (WFPS) c (N input) d (intercept)
Log-transferred background N2O fluxes
Cov (n = 392) Overall 0.11 (0.10)** 0.007** 0.0006 — −0.17**
WFPS ≥80% field capacity 0.28 (0.28)** 0.015** 0.01** — −1.04**
WFPSWang et al. N2O Reduction for Drained Peatland
fertilization-induced N2O emissions (F-peak; Table 3). Higher emissions, soil temperature was still a significant driver at both
F-peaks were found with warm temperatures and lower with cold sites, but the influence of the soil water-filled pore space was
temperatures (Table 2), most likely due to the reduced soil limited (Table 3). Moreover, the variance of background N2O
microbial activity (Holtan-Hartwig and Bakken, 2002). The emissions explained by the MLR model with soil temperature and
fertilizer N inputs and the high WFPS did not compensate for soil water content was low, indicating that for both sites, the
the effect of cold temperatures (Table 2), indicating that in our influence of soil temperature and soil moisture on background
field, high N2O peaks only occur if all the driving variables (soil N2O emission was limited. In our study, background N2O
temperature, soil water content, and N availability) are emissions were also significantly reduced (p < 0.05) with
supporting high N2O production. Previous research also mineral soil coverage, indicating that the higher N2O emission
highlighted that peak N2O emissions were not observed if one from Ref was not only directly related to fertilization but also to
driving factor was below thresholds for soil temperature and the properties of the surface soil itself, for example, soil pH and
moisture (Holtan-Hartwig and Bakken, 2002; Meng et al., 2005). soil N availability. Surface soil properties are of particular
In turn, if these driving factors were above the threshold, a relevance for the amount of N2O release as it has been shown
fertilization event will lead to very high N2O emissions. In the that the soil depth from which emitted N2O originates is only
first year, we observed a very high F-peak after fertilization in 0.7–2.8 cm (Neftel et al., 2000).
August, which contributed more than half to the annual N2O Second, surface soil pH increased from 5.2 to 7.3 (Table 1)
emissions for both sites and even 78% for Ref. This led to a with mineral soil coverage in our study site. It has been reported
significantly higher annual N2O release in the first year than in that the net production of N2O from denitrification is strongly
the second year. One explanation might be the time line of the dry dependent on soil pH (Nadeem et al., 2020); N2O emissions are
summer period followed by a wetting event together with the negatively correlated with soil pH in organic soil, due to the
fertilizer application (Figure 3). This interpretation is supported by decreased N mineralization with increasing soil pH under aerobic
a large body of former research works that after dry and wet cycles conditions of peat (Chapin et al., 2003; Weslien et al., 2009) and
for both mineral soils and organic soils, a greater amount of N2O is the possible enhancement of the synthesis of functional N2O
emitted from grassland owing to the enhanced availability of C and reductase from denitrification (Liu et al., 2014), resulting in a
N as related to soil organic matter mineralization (Priemé and higher share of N2. Hence, the relatively high soil pH at Cov may
Christensen, 2001; Beare et al., 2009; Harrison-Kirk et al., 2013). The have contributed to the lower background N2O emissions.
differences in fertilization-induced N2O emissions under different Third, the two topsoils differed in soil N content and soil N
soil temperatures and soil WFPS suggest that as one N2O mitigation availability (Table 1). Soil available N from SOM mineralization
option for the study site, fertilizer application should be avoided in is considered to be the main source for background N2O
hot summer periods or during frequent precipitation. production (Lampe et al., 2006). Our study site revealed a
carbon loss of 3,100–6,300 kg C ha−1 yr−1 from peat oxidation
4.2.2 Drivers of N2O Reduction After Mineral Soil after drainage based on a former study using a radiocarbon
Coverage approach to estimate the soil carbon loss (Wang et al., 2021).
Despite receiving the same amount of N input and having similar Considering the C to N ratios of ~25 (at a depth of 2 m) as
soil temperatures and WFPS, as well as the same agricultural representative for nitrogen stored in peat without fertilization, the
management, Ref had much higher N2O emissions after study site has an N mineralization potential of
fertilization. The different N2O releases after fertilization 120–250 kg N ha−1 yr−1. This relatively high soil N supply at
might be related to various mechanisms. First, exogenous N Ref, as also indicated by higher available soil N (Table 1),
inputs might prime the mineralization of SOM, thereby becomes available for microbial processing and consequently
influencing N2O production differently in Cov and Ref. N2O production. After mineral soil coverage with a thickness
Priming effects are defined as short-term changes of SOM of ~40 cm, N release from peat mineralization of topsoil SOM as
mineralization in response to external stimuli, for example, an N source for N2O formation is no longer available. Instead,
exogenous N addition, and they alter the subsequent N2O mineralization of SOM from the mineral soil coverage, whose soil
production from SOM-N (Kuzyakov et al., 2000; Daly and N content and the corresponding soil available N are much lower
Hernandez-Ramirez, 2020; Thilakarathna and Hernandez- (Table 1), becomes a major N source. The decreased surface soil
Ramirez, 2021). Priming may affect N2O emissions positively N availability due to mineral soil coverage for nitrification and
or negatively, depending on soil moisture and SOM content denitrification may then restrain the N2O production (Senbayram
(Roman-Perez and Hernandez-Ramirez, 2020). Former studies et al., 2012). As one consequence for management, the high soil N
revealed positive N2O priming effects to be associated with wetter supply in drained peatland suggests that the fertilization demand
soil conditions (WFPS >60%) and higher SOM content for organic grassland soils might be substantially lower than that
(Schleusner et al., 2018; Thilakarathna and Hernandez- for mineral grassland soils.
Ramirez, 2021). In our study site, soil moisture for Cov and Fourth, although the organic soil at site Cov still has the
Ref were similar during the fertilization events (Table 2), but SOC potential to produce N2O, the mineral soil coverage might have
content in surface soil of Ref was five times higher than that in pushed the organic soil underneath into a deeper zone with higher
surface soil of Cov (Table 1), which might have induced stronger soil moisture and lower oxygen availability as compared to the
priming by adding N, subsequently leading also to higher N2O organic topsoil at site Ref. Higher soil moisture could influence the
emissions for Ref (Perveen et al., 2019). For the background N2O exchange of N2O between the site of production and the aerated
Frontiers in Environmental Science | www.frontiersin.org 10 March 2022 | Volume 10 | Article 856599Wang et al. N2O Reduction for Drained Peatland
pore space, thereby affecting the balance between N2O production measurements. Mineral soil coverage of drained organic soil could
and consumption. With high soil moisture, a reduction of N2O significantly reduce both fertilization-induced N2O emissions and
emission is expected owing to the higher consumption of N2O background N2O emissions. The large potential of N2O reduction
when gas diffusion is slow (Kuang et al., 2019; Harris et al., 2021). after mineral soil coverage, which itself is a measure applied by
Moreover, under strongly anaerobic conditions, N2 as the end farmers to counterbalance soil subsidence, provides an opportunity
product of denitrification will be produced preferentially for not only reducing the environmental footprint of using drained
(Davidson et al., 2000). Thus, the amount of formed N2O from organic soils but also for maintaining their agricultural productivity,
the organic soil underneath might be reduced at site Cov via and hence, farmers income. We are not aware of any management
enhanced dissolution in soil water (Clough et al., 2006; Goldberg options apart from peatland restoration and rewetting that have the
et al., 2008) or full denitrification before escaping into the atmosphere potential to substantially reduce N2O emissions from organic soils.
(Davidson et al., 2000). These effects are further pronounced by the Mineral soil coverage of intensively used drained peatlands, which
lower gas diffusivity of the surface soil of Cov compared to Ref are not suitable for rewetting owing to soil conditions or socio-
(Figure 2D). We suppose these effects in combination lead to lower economic constraints, may therefore be a prospective management
N2O emissions after mineral soil coverage. strategy for the sustained use of these soils. Our findings encourage
further research on this measure, particularly for tropical conditions
where drained peatlands are GHG hotspots and contribute the most
4.3 Potential of N2O Reduction by Mineral to the overall emissions from managed organic soils (Dommain
Soil Coverage et al., 2018; Leifeld and Menichetti, 2018).
Based on two years of continuous field observation, the results
from our study site showed that mineral soil coverage as a
management option for organic soils induced a strong DATA AVAILABILITY STATEMENT
reduction of N2O emissions from drained organic soil in the
Swiss Rhine valley. In Switzerland, ~ 250 km2 organic soils are The original contributions presented in the study are included in
still drained for agricultural production (Wüst-Galley et al., the article/Supplementary Material; further inquiries can be
2020), and N2O release contributes by ~ 10% to the overall c. directed to the corresponding author.
650 kt CO2 -eq yr−1 GHG emissions from these soils (FOEN,
2021). Globally, c. 2.7 × 10⁵ km2 peatlands are drained for
agricultural (grassland and cropland) production, those areas AUTHOR CONTRIBUTIONS
are estimated to result in c. 1,046 Mt CO2 -eq yr−1 GHG
emissions, and N2O release contributes by ~ 24% to it YW, SP, CA, and JL: conceived and designed the study. YW and MJ:
(FAOSTAT, 2019; Evans et al., 2021). Rewetting has been collected and analyzed the samples. JL: managed the project. MJ:
suggested as key to reducing those GHG emissions from designed experimental instrument. YW: performed data analysis and
drained organic soils (Hemes et al., 2019; Günther et al., 2020; drafted the original manuscript. SP, CA, MJ, and JL: edited the
Ojanen and Minkkinen, 2020). However, in many areas, rewetting manuscript. All the authors read and approved the final manuscript.
of all of those areas will be difficult to be achieved. First, for some
countries, cultivation on drained organic soils is continuously
making significant contributions to the economic development; FUNDING
therefore, rewetting of those areas might cause economic losses.
Second, global demand for food and feed production and pressure The research was supported by funding received from the Swiss Federal
on land is continuously increasing (FAO, 2017). These set barriers Office for the Environment (contract number 06.0091. PZ/R261-2425),
for full rewetting of drained agricultural organic soil despite the and the China Scholarship Council (NSCIS 201806350221).
need for GHG reduction (Biancalani and Avagyan, 2014). Thus,
in situations where full rewetting is not possible, mineral soil
coverage might become a promising building block for GHG ACKNOWLEDGMENTS
mitigation and, at the same time, counterbalance soil subsidence
and maintain the productivity of drained organic soil. We acknowledge the help of Stefan Gloor, Robin Giger, Urs Zihlmann,
and Marlies Sommer at Agroscope during field sampling and lab
analysis. We are thankful for many insightful discussions with Christof
5 CONCLUSION Ammann and Karl Voglmeier at Agroscope. We thank Bernhard
Schneider for collaboration on his farm.
Draining organic soil for intensive agricultural production induced
N2O emissions of 20.5 ± 2.7 kg N ha−1 yr−1 at our study site, which
were reduced to 2.3 ± 0.4 kg N ha−1 yr−1 by mineral soil coverage. SUPPLEMENTARY MATERIAL
Most of the N2O emissions were related to fertilization, and a single
fertilization event under suitable soil temperature and soil moisture The Supplementary Material for this article can be found online at:
may contribute by more than half to the annual N2O emissions in https://www.frontiersin.org/articles/10.3389/fenvs.2022.856599/
our study site, underpinning the need for high-frequency flux full#supplementary-material
Frontiers in Environmental Science | www.frontiersin.org 11 March 2022 | Volume 10 | Article 856599Wang et al. N2O Reduction for Drained Peatland
REFERENCES Protocol. Bern: Federal Office for the Environment. Available at: http://www.
climatereporting.ch.
Fuchs, K., Merbold, L., Buchmann, N., Bretscher, D., Brilli, L., Fitton, N., et al.
Ambus, P., Skiba, U., Drewer, J., Jones, S. K., Carter, M. S., Albert, K. R., et al. (2020). Multimodel Evaluation of Nitrous Oxide Emissions from an Intensively
(2010). Development of an Accumulation-Based System for Cost-Effective Managed Grassland. J. Geophys. Res. Biogeosci. 125, e2019JG005261. doi:10.
Chamber Measurements of Inert Trace Gas Fluxes. Eur. J. Soil Sci. 61, 1029/2019jg005261
785–792. doi:10.1111/j.1365-2389.2010.01272.x Goldberg, S. D., Knorr, K.-H., and Gebauer, G. (2008). N2O Concentration and Isotope
Beare, M. H., Gregorich, E. G., and St-Georges, P. (2009). Compaction Effects on Signature along Profiles Provide Deeper Insight into the Fate of N2O in Soils†.
CO2 and N2O Production during Drying and Rewetting of Soil. Soil Biol. Isotopes Environ. Health Stud. 44, 377–391. doi:10.1080/10256010802507433
Biochem. 41, 611–621. doi:10.1016/j.soilbio.2008.12.024 Günther, A., Barthelmes, A., Huth, V., Joosten, H., Jurasinski, G., Koebsch, F., et al.
Biancalani, R., and Avagyan, A. (2014). Towards Climate-Responsible Peatlands (2020). Prompt Rewetting of Drained Peatlands Reduces Climate Warming
Management Series. Rome, Italy: Food and Agriculture Organization of the Despite Methane Emissions. Nat. Commun. 11, 1644. doi:10.1038/s41467-020-
United Nations. 15499-z
Blodau, C. (2002). Carbon Cycling in Peatlands - A Review of Processes and Harris, E., Diaz-Pines, E., Stoll, E., Schloter, M., Schulz, S., Duffner, C., et al. (2021).
Controls. Environ. Rev. 10, 111–134. doi:10.1139/a02-004 Denitrifying Pathways Dominate Nitrous Oxide Emissions from Managed
Bragg, O., Lindsay, R., Risager, M., Silvius, M., and Zingstra, H. (2013). Strategy Grassland during Drought and Rewetting. Sci. Adv. 7 (6), eabb7118. doi:10.
And Action Plan for Mire and Peatland Conservation in central Europe: Central 1126/sciadv.abb7118
European Peatland Project (CEPP). Wageningen: Wetlands International. Harrison-Kirk, T., Beare, M. H., Meenken, E. D., and Condron, L. M. (2013). Soil
Chapin, C. T., Bridgham, S. D., Pastor, J., and Updegraff, K. (2003). Nitrogen, Organic Matter and Texture Affect Responses to Dry/wet Cycles: Effects on
Phosphorus, and Carbon Mineralization in Response to Nutrient and Lime Carbon Dioxide and Nitrous Oxide Emissions. Soil Biol. Biochem. 57, 43–55.
Additions in Peatlands. Soil Sci. 168, 409–420. doi:10.1097/01.ss.0000075286. doi:10.1016/j.soilbio.2012.10.008
87447.5d Hemes, K. S., Chamberlain, S. D., Eichelmann, E., Anthony, T., Valach, A., Kasak,
Charteris, A. F., Chadwick, D. R., Thorman, R. E., Vallejo, A., Klein, C. A. M., K., et al. (2019). Assessing the Carbon and Climate Benefit of Restoring
Rochette, P., et al. (2020). Global Research Alliance N2O Chamber Degraded Agricultural Peat Soils to Managed Wetlands. Agric. For.
Methodology Guidelines: Recommendations for Deployment and Meteorology 268, 202–214. doi:10.1016/j.agrformet.2019.01.017
Accounting for Sources of Variability. J. Environ. Qual. 49, 1092–1109. Holtan-Hartwig, L., Dörsch, P., and Bakken, L. R. (2002). Low Temperature Control
doi:10.1002/jeq2.20126 of Soil Denitrifying Communities: Kinetics of N2O Production and Reduction.
Clough, T. J., Kelliher, F. M., Wang, Y. P., and Sherlock, R. R. (2006). Diffusion of Soil Biol. Biochem. 34, 1797–1806. doi:10.1016/S0038-0717(02)00169-4
15
N-Labelled N2O into Soil Columns: a Promising Method to Examine the Fate IPCC (2014). in 2013 Supplement to the 2006 IPCC Guidelines for National
of N2O in Subsoils. Soil Biol. Biochem. 38, 1462–1468. doi:10.1016/j.soilbio. Greenhouse Gas Inventories: Wetlands. Editors T. Hiraishi, T. Krug,
2005.11.002 K. Tanabe, N. Srivastava, J. Baasansuren, M. Fukuda, et al. (Switzerland:
Daly, E. J., and Hernandez-Ramirez, G. (2020). Sources and Priming of Soil N2O IPCC). Available at: https://www.ipcc.ch/site/assets/uploads/2018/03/
and CO2 Production: Nitrogen and Simulated Exudate Additions. Soil Biol. Wetlands_Supplement_Entire_Report.pdf.
Biochem. 149, 107942. doi:10.1016/j.soilbio.2020.107942 IPCC (2019). in 2019 Refinement to the 2006 IPCC Guidelines for National
Danevčič, T., Mandic-Mulec, I., Stres, B., Stopar, D., and Hacin, J. (2010). Greenhouse Gas Inventories. Editors E. Calvo Buendia, K. Tanabe,
Emissions of CO2, CH4 and N2O from Southern European Peatlands. Soil A. Kranjc, J. Baasansuren, M. Fukuda, S. Ngarize, et al. (Switzerland: IPCC).
Biol. Biochem. 42, 1437–1446. doi:10.1016/j.soilbio.2010.05.004 Availableat: https://www.ipcc-nggip.iges.or.jp/public/2019rf/vol4.html.
Davidson, E. A., Keller, M., Erickson, H. E., Verchot, L. V., and Veldkamp, E. Kasimir, Å., He, H., Coria, J., and Nordén, A. (2018). Land Use of Drained
(2000). Testing a Conceptual Model of Soil Emissions of Nitrous and Nitric Peatlands: Greenhouse Gas Fluxes, Plant Production, and Economics. Glob.
Oxides. Bioscience 50, 667–680. doi:10.1641/0006-3568(2000)050[0667: Change Biol. 24, 3302–3316. doi:10.1111/gcb.13931
tacmos]2.0.co;2 Keller, T., Hüppi, R., and Leifeld, J. (2019). Relationship between Greenhouse Gas
Dommain, R., Frolking, S., Jeltsch-Thömmes, A., Joos, F., Couwenberg, J., and Emissions and Changes in Soil Gas Diffusivity in a Field experiment with Biochar
Glaser, P. H. (2018). A Radiative Forcing Analysis of Tropical Peatlands before and Lime. J. Plant Nutr. Soil Sci. 182, 667–675. doi:10.1002/jpln.201800538
and after Their Conversion to Agricultural Plantations. Glob. Change Biol. 24, Knox, S. H., Sturtevant, C., Matthes, J. H., Koteen, L., Verfaillie, J., and Baldocchi,
5518–5533. doi:10.1111/gcb.14400 D. (2015). Agricultural Peatland Restoration: Effects of Land-Use Change on
Evans, C. D., Peacock, M., Baird, A. J., Artz, R. R. E., Burden, A., Callaghan, N., et al. Greenhouse Gas (CO2 and CH4) Fluxes in the Sacramento-San Joaquin Delta.
(2021). Overriding Water Table Control on Managed Peatland Greenhouse Gas Glob. Change Biol. 21, 750–765. doi:10.1111/gcb.12745
Emissions. Nature 593, 548–552. doi:10.1038/s41586-021-03523-1 Kuang, W., Gao, X., Tenuta, M., Gui, D., and Zeng, F. (2019). Relationship between
FAO (2017). The Future of Food and Agriculture – Trends and Challenges. Rome. Soil Profile Accumulation and Surface Emission of N2O: Effects of Soil Moisture
Faostat (2019). Food and Agriculture Organisation of the United Nations. and Fertilizer Nitrogen. Biol. Fertil. Soils. 55 (2), 97–107. doi:10.1007/s00374-
Available at: https://www.fao.org/faostat/en/#data/GV. (Accessed May 20, 018-01337-4
2020). Kuzyakov, Y., Friedel, J. K., and Stahr, K. (2000). Review of Mechanisms and
Ferré, M., Muller, A., Leifeld, J., Bader, C., Müller, M., Engel, S., et al. (2019). Quantification of Priming Effects. Soil Biol. Biochem. 32, 1485–1498. doi:10.
Sustainable Management of Cultivated Peatlands in Switzerland: Insights, 1016/S0038-0717(00)00084-5
Challenges, and Opportunities. Land Use Policy 87, 104019. doi:10.1016/j. Lampe, C., Dittert, K., Sattelmacher, B., Wachendorf, M., Loges, R., and Taube, F.
landusepol.2019.05.038 (2006). Sources and Rates of Nitrous Oxide Emissions from Grazed Grassland
Flechard, C. R., Ambus, P., Skiba, U., Rees, R. M., Hensen, A., van Amstel, A., et al. after Application of 15N-Labelled mineral Fertilizer and Slurry. Soil Biol.
(2007). Effects of Climate and Management Intensity on Nitrous Oxide Biochem. 38, 2602–2613. doi:10.1016/j.soilbio.2006.03.016
Emissions in Grassland Systems across Europe. Agric. Ecosyst. Environ. 121, Leifeld, J. (2018). Distribution of Nitrous Oxide Emissions from Managed Organic
135–152. doi:10.1016/j.agee.2006.12.024 Soils under Different Land Uses Estimated by the Peat C/N Ratio to Improve
Flechard, C. R., Neftel, A., Jocher, M., Ammann, C., and Fuhrer, J. (2005). Bi- National GHG Inventories. Sci. Total Environ. 631-632, 23–26. doi:10.1016/j.
directional Soil/atmosphere N2O Exchange over Two Mown Grassland Systems scitotenv.2018.02.328
with Contrasting Management Practices. Glob. Change Biol. 11, 2114–2127. Leifeld, J., and Menichetti, L. (2018). The Underappreciated Potential of Peatlands
doi:10.1111/j.1365-2486.2005.01056.x in Global Climate Change Mitigation Strategies. Nat. Commun. 9, 1071. doi:10.
Foen (2021). Switzerland’s Greenhouse Gas Inventory 1990–2019: National 1038/s41467-018-03406-6
Inventory Report, CRF-Tables. Submission of April 2021 under the United Leppelt, T., Dechow, R., Gebbert, S., Freibauer, A., Lohila, A., Augustin, J., et al.
Nations Framework Convention on Climate Change and under the Kyoto (2014). Nitrous Oxide Emission Budgets and Land-Use-Driven Hotspots for
Frontiers in Environmental Science | www.frontiersin.org 12 March 2022 | Volume 10 | Article 856599You can also read