Real Estate Market Study and Strategic Recommendations Analysis
←
→
Page content transcription
If your browser does not render page correctly, please read the page content below
Real Estate Market Study and
    Strategic Recommendations Analysis
                                               in the
                          City of Powell, Ohio

      For:
      Mr. David Betz, Director of Development
      City of Powell
      47 Hall Street
      Powell, Ohio 43065

      Effective Date: October 4, 2018
      Job Reference Number: 14948AM

Phone: (614) 224-4300   Fax: (614) 225-9505   1310 Dublin Rd., Columbus, Ohio 43215   VSInsights.com
Market Study and Strategic Recommendations Analysis                                           Powell, OH

Market Study and Strategic Recommendations Analysis
Certification
This certifies that Robert Vogt, Andrew Mazak, Mark Ferritto and Kevin Cannon of Vogt Strategic Insights
(VSI), and Rick Stein and Drew Merrill of Urban Decision Group (UDG), all contributed to the analysis
contained within this report. Further, the information contained in this report is true and accurate as of
October 11, 2018.

This market study and strategic recommendations analysis has been prepared by VSI, a member in good
standing of the National Council of Housing Market Analysts (NCHMA). This study has been prepared in
conformance with the standards adopted by NCHMA for the market analysis industry where applicable in
this housing needs assessment. The NCHMA market study standards focus on site-specific market studies,
rather than larger-scale housing needs assessments. However, the general themes and concepts have
been applied to this city-wide analysis.

The NCHMA standards include the Standard Definitions of Key Terms Used in Market Studies for Affordable
Housing Projects and Model Content Standards for the Content of Market Studies for Affordable Housing
Projects. These standards are designed to enhance the quality of market studies and to make them easier
to prepare, understand and use by market analysts and by the end users. These standards are voluntary
only and no legal responsibility regarding their use is assumed by the National Council of Housing Market
Analysts.

Vogt Strategic Insights is duly qualified and experienced in providing market analyses housing. The
company’s principals participate in the National Council of Housing Market Analysts (NCHMA) educational
and information sharing programs to maintain the highest professional standards and state-of-the-art
knowledge. Vogt Strategic Insights is an independent market analyst. No principal or employee of VSI
has any financial interest whatsoever in the development for which this analysis has been undertaken.

Certified:

_________________               __________________               __________________
Andrew W. Mazak                 Robert Vogt                      Rick Stein
Market Analyst                  Market Analyst                   Certified Planner (AICP)
Vogt Strategic Insights         Vogt Strategic Insights          Urban Decision Group
1310 Dublin Road                1310 Dublin Road                 455 W. Broad Street
Columbus, Ohio 43215            Columbus, Ohio 43215             Columbus, OH 43215
(614) 224-4300                  (614) 224-4300                   (614) 383-8447
andrewm@vsinsights.com          robv@vsinsights.com              rstein@urbandecisiongroup.com

                                   Market Study and Strategic Recommendations Analysis Certification         1
Market Study and Strategic Recommendations Analysis                                            Powell, OH

1. Executive Summary and Conclusions
The purpose of this market study and strategic recommendations analysis is to evaluate housing
characteristics and economic/employment trends impacting the city of Powell, which is located in the
southern portion of Delaware County, within the Columbus, Ohio Metropolitan Statistical Area (MSA) and
to project the future housing and commercial/retail needs of Powell based on current and anticipated
demographic, economic and housing trends. The projections for housing and commercial/retail
development represent the gross support potential of Powell. That is, the aggregate projections likely
exceed the current capacity of the community to support the projections. This study is not recommending
a specific development, but rather providing the gross potential of the city to support real estate
development. The community should make decisions on which strategies and development options they
prefer.

Considering the demographic characteristics, economic trends and forecast, as well as the performance
of the housing and commercial/retail markets in Powell, the city has the potential to support significant
levels of additional housing and commercial/retail development. Additional development in Powell can
be accomplished through the development of existing, vacant parcels, as well as the potential annexation
of adjacent Delaware County land. The following is a summary of the overall commercial/retail and
housing potential for the city of Powell.

Commercial/Retail Trade Analysis

Methods

The evaluation of the retail/commercial and office markets requires a novel and nuanced approach that
reflects the uncertainty of the markets themselves. To account for all this change, we employed a multi-
pronged approach that blends traditional market analysis with recent trends and expert-level, informed
speculation.

Businesses in Powell are not simply competing against one another. A business’ trade area is not
contained to a political boundary. A good or service’s elasticity of demand is dependent upon several
factors such as price, scarcity, supply and demand; as such, the size of the trade area varies accordingly.

Using a combination of demographic and expenditure data, interviews with local stakeholders and
experts, and our own expertise and experience, we identified three overlapping Commercial Trade Areas
(CTA) for the purpose of analyzing the retail/commercial markets: CTA North, CTA Central and CTA South.
Each CTA has its own characteristics, but they share common traits as well. The information gleaned from
the CTA analysis helps us better understand the opportunities and threats that face the retail/commercial
nodes that are contained within each area.

We identified eight retail/commercial nodes within the city of Powell. Some of them are contiguous while
others stand alone, surrounded by other land uses. Each one was defined by common sets of organizing
principles, such as land use, development character, and physical boundaries. The micro-level analysis of
the businesses, office complexes and shopping centers was informed by the applicable macro-level
Commercial Trade Area analysis, or analyses if in an area of overlap. Detailed of this commercial/retail
trade analysis can be found in Section 3 of this report.

                                                                   Executive Summary and Conclusions          1.1
Market Study and Strategic Recommendations Analysis                                           Powell, OH

Commercial Trade Area (CTA) Delineation

A Commercial Trade Area (CTA) is defined as the area from which a business will draw the majority of
support from its customers in terms of sales volume. The establishment of each CTA was based on a
variety of factors, including the location and types of businesses relative to existing and anticipated
residential development. We also used knowledge of the area gained through field analysis and
discussions with commercial realtors familiar with the area to solidify the boundaries.

Although each CTA is analyzed separately, they are not exclusive of one another in terms of geography.
The Central CTA overlaps both the North CTA and South CTA while a portion of the Central CTA is exclusive
of both. Businesses located in these overlapping areas are likely to draw similar levels of support from
both the north and the south. Those businesses located in the non-overlapping portion of the Central CTA
tend to be more reliant on local customers purchasing relatively inelastic goods. The map on the following
page illustrates the location of the three CTA’s relative to one another and the city of Powell.

                                                                  Executive Summary and Conclusions          1.2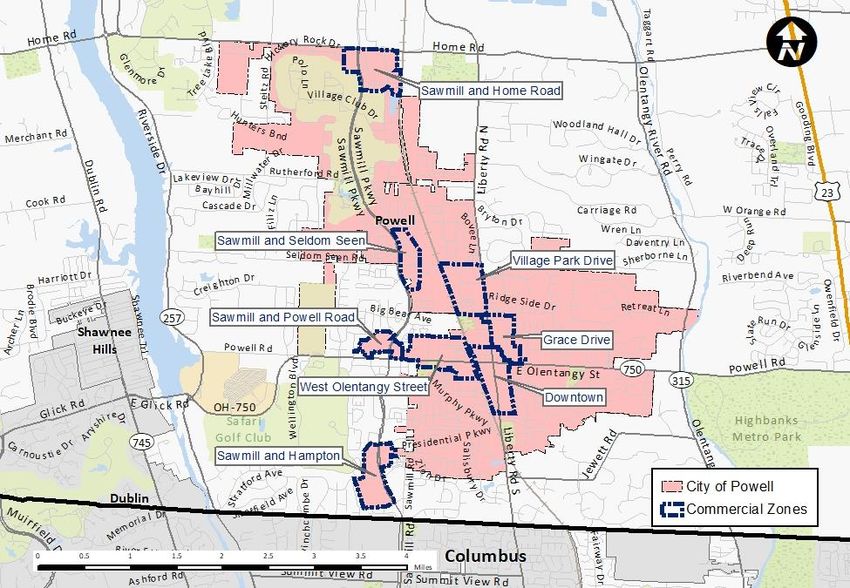
Market Study and Strategic Recommendations Analysis                                               Powell, OH

North CTA

The North CTA is defined by Hyatts Road (north), Olentangy River (east), Seldom Seen Road and Sherborne
Lane (south) and the Scioto River (west). A high median income and a low median age for the residents
within this CTA bodes well for the emerging goods and delivery services such as grocery, hot food and
miscellaneous department store types of goods. While the density and daytime population numbers may
not support much more than auto-dependent uses, higher income-earning households that spend one
hour or more commuting will increasingly utilize delivery services.

A retail gap analysis evaluates the retail potential for specific business types within a trade area. Demand,
or retail potential, is calculated by estimating the spending habits of residents living within the trade area
and aggregating those spending totals by North American Industry Classification System (NAICS) code - a
federal standard used for classifying businesses by their primary function. The supply is calculated by
estimating the total retail sales within the trade area. Once supply and demand are calculated for the
trade area, the retail gap amount is calculated by subtracting the supply from the demand. This figure is
then divided by the demand and multiplied by 100 to create a leakage/surplus factor. The higher the
leakage/surplus factor, the higher the retail potential.

According to the leakage/surplus data for the North CTA, the area is undersupplied in the Retail Trade and
Food and Drink sectors by a total $342 million. The bulk of this unmet demand is in four categories: Motor
Vehicle and Parts Dealers, Furniture and Home Furnishings Stores, General Merchandise Stores and Food
and Beverage Stores. These four categories combined have a retail gap of $198 million.

The primary driver in terms of sales for Food and Beverage Stores is Grocery Stores. No grocery stores are
in this CTA, although a Giant Eagle and Kroger are just south near Sawmill Parkway and Powell Road. A
grocery store in the central or northern portion of this CTA makes sense given the growth potential and
purchasing power of households in this area. For comparison purposes, a three-mile trade area emanating
from the intersection of Sawmill Parkway and Powell Road (representing a point between the Kroger and
Giant Eagle) contains approximately 12,500 households which are effectively supporting two grocery
stores with a combined 120,000 square feet of grocery space. A three-mile trade area emanating from
the center of the North CTA contains just under 6,000 households today. If the North CTA continues to
experience residential development at the same or higher densities, we would expect another grocery
store to emerge in this area shortly.

Central CTA

The Central CTA is defined by Rutherford Road (north), Olentangy River (east), Summit View Road (south)
and the Scioto River (west). This CTA includes the majority of the city of Powell and parts of northern
Franklin County. The population in this CTA is projected to grow by 7% over the next five years. According
to the business data provided by ESRI and Infogroup, the Retail Trade and Food and Drink sectors were
undersupplied by about $433 million in 2017. The largest gap in in this CTA is in the Motor Vehicle and
Parts Dealers sector, which was undersupplied by $118 million; however, demand in this sector tends to
be very elastic, which means consumers are willing to travel to purchase these goods.

                                                                     Executive Summary and Conclusions           1.3
Market Study and Strategic Recommendations Analysis Powell, OH
Because retail potential exists in all sectors of this CTA, it is imperative to take a more detailed approach
when recommending specific types of retail in specific locations. For instance, while there is high demand
for clothing stores overall within the CTA, it makes more sense to cluster these stores in and near the
downtown Powell area to enhance the overall shopping experience, rather than locating these stores
along Sawmill Parkway—a location where they may see more commuter traffic, but would likely not spur
additional “spillover” purchases at adjacent and nearby businesses.
South CTA
The South CTA is defined by Jewett Road, Presidential Parkway and State Route 750 (north), Olentangy
River (east), Interstate 270 (south) and the Scioto River (west). In terms of total land area, the South CTA
is the smallest; however, it has the highest population (35,772 people). Although this area is expected to
continue growing slightly, there are far less opportunities for newer, large-scale single-family home
development. Growth will most likely come from higher density infill development – primarily multifamily
development.
Despite the higher amount of retail demand existing in this CTA, the leakage/surplus factor is only 13.3—
the lowest of the three CTA’s. This is due to the relatively large amount of businesses that exist in the
southern portion of this CTA and the high sales volume, particularly in the subsector of Motor Vehicle and
Parts Dealers, which was oversupplied by $1.2 million in 2017. This subsector includes auto dealerships,
which exist in large supply on the periphery of Interstate 270.
Key Observations and Recommendations – Commercial Zones
In addition to the three CTA analyses, separate analyses were conducted for smaller “commercial zones”
identified within the city of Powell. The information gleaned from the CTA analyses was used to inform
the broader supply and demand characteristics of the areas, resulting in targeted recommendations
within each Commercial Zone. Those separate zonal analyses follow the CTA analyses.
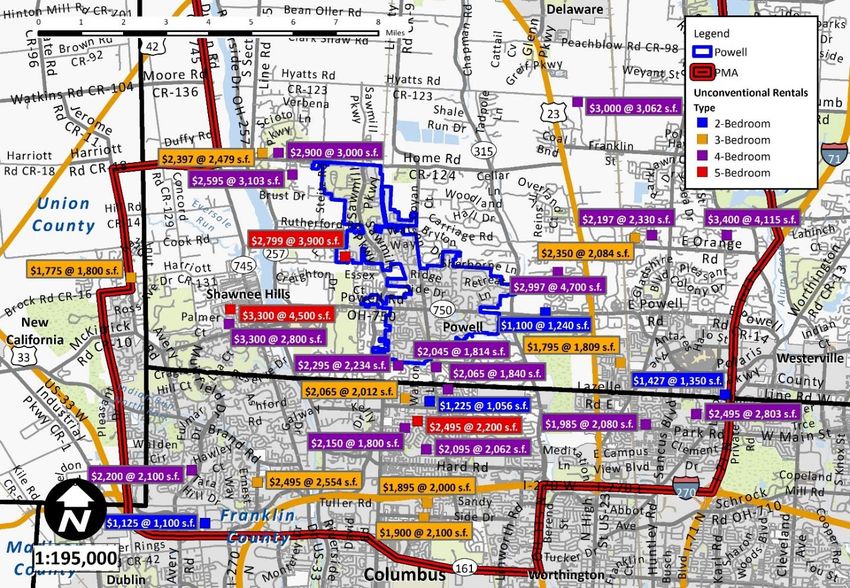
We identified eight commercial/retail zones within the city of Powell. Some of them are contiguous while
others stand alone, surrounded by other land uses. Each one was defined by common sets of organizing
principles, such as land use, development character, and physical boundaries. The micro-level analysis of
the businesses, office complexes and shopping centers was informed by the applicable macro-level CTA
analysis, or analyses if in an area of overlap.
The map on the following page illustrates the locations of the eight commercial zones. A summary of the
key observations and recommendations for each zone follows the map. Additional details and analysis
can be found in Section 3.
Executive Summary and Conclusions 1.4
Market Study and Strategic Recommendations Analysis                                              Powell, OH

Key Observations and Recommendations – Downtown Commercial Zone

The Downtown Commercial Zone in Powell is defined by Grace Drive to the east, Village Academy campus
to the south, CSX railroad tracks to the west and East Case Street and the Powell Cemetery to the north.
This zone is characterized by local shops residing in historic village homes, several popular restaurants and
a mix of office and retail uses existing in a variety of spaces.

Although there are very little vacant parcels to be redeveloped within the Downtown Commercial Zone,
redevelopment scenarios should consider a mix of office and other uses, whether they be retail or
multifamily residential. The city should also consider establishing a parking management district as part
of any new development agreement in which all maintenance costs are split between several parties. This
would allow visitors to park anywhere within the district to visit any of the businesses.

Another recommendation to alleviate some of the parking concerns downtown is to add wayfinding tools
like additional signage on all sides of the Four Corners intersection directing drivers to the free public
parking lots. These signs could incorporate a digital component to give real time updates of the space
count in each lot.

                                                                    Executive Summary and Conclusions           1.5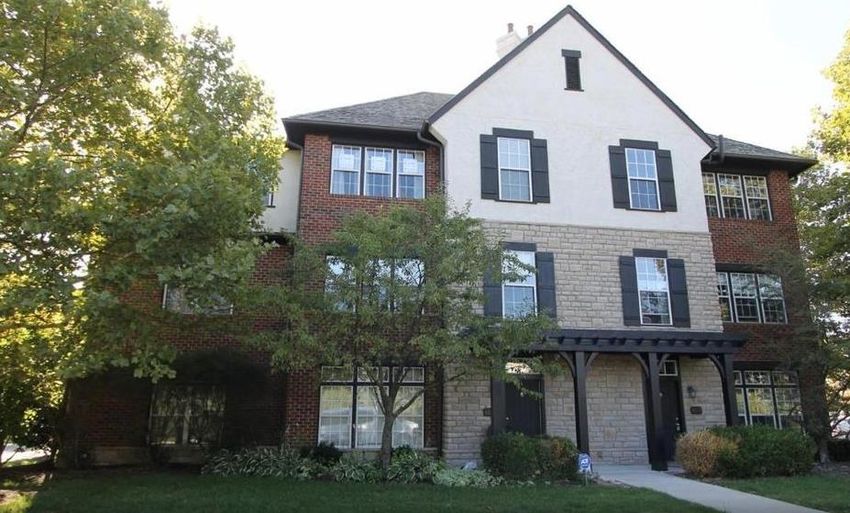
Market Study and Strategic Recommendations Analysis                                             Powell, OH

One sign of a vibrant downtown is its ability to keep people entertained 18 hours a day. In downtown
Powell, most of the businesses outside of the restaurants close down by 6:00 p.m. A lack of residents living
in and around downtown also contributes to the low nighttime population. One way to encourage people
to explore Powell at night is to create a recurring monthly or bi-weekly event that encourages the
downtown shops to extend their hours.

One way to support businesses downtown while relieving some of the congestion and parking issues is to
add more housing downtown. For instance, if a new restaurant were to open downtown it would have
enough support from customers just within a one-mile radius based on a surplus of $1.3 million in
demand. This is based on an average of $1 million in sales annually for a restaurant located downtown.
However, within a half-mile radius the surplus demand is only $557,000, meaning that a restaurant would
need to rely on about half of its customers living outside of a reasonable walking distance.

According to spending data within the CTA, the average household spends $8,020 on food and drink
establishments. With 786 households living within a half-mile of the Four Corners Intersection that is a
total of $6.3 million spent at food and drink establishments annually. If just 100 households were added
with the same level of spending power that equates to $7.1 million on food and drink. This difference
combined with a leakage amount of $757,859 is more than enough to support a new restaurant almost
entirely from local customers.

Key Observations and Recommendations – Grace Drive Commercial Zone

The Grace Drive Commercial Zone includes all the parcels along Grace Drive extending from Olentangy
Street to Liberty Road. This zone also includes one commercial office building on the west side of Liberty
Road. This zone is characterized by a mix of neighborhood retail centers, Class C office space, flex
office/warehouse buildings and large-lot single-family homes.

In terms of development opportunities, Grace Drive has a much larger footprint of vacant land to work
with than what is available downtown. The key to any redevelopment of these parcels will be to
incorporate a mix of uses. One use that should be strongly considered in this zone is commercial office.
Based on discussions with a commercial realtor and the lack of Class A multistory office space within a 15-
minute drive from Grace Drive, we believe that new office space is a viable use and would perform well
in this zone if it is complimented by other uses.

A strategy should be put in place to redevelop the entirety of Grace Drive and create uniform zoning across
the district. Currently there are three zoning categories for the properties that front Grace Drive:
Downtown Business District, Planned Commercial District and Residence District. A new, single planned
zoning district would streamline the development process along Grace Drive and allow the city to
implement a clear vision for the entire corridor. Given the proximity to downtown and the lack of available
commercial space, the vacant space along Grace Drive should be maximized in terms of density. Higher
density commercial uses would also allow the city to collect much-needed income taxes to support the
infrastructure improvements both along Grace Drive and downtown.

The obvious challenge (and opportunity) in this zone is Powell Center. Frankly, the option that would be
most beneficial to businesses, residents, the entire downtown Powell district and the city of Powell itself,
is a wholesale redevelopment of the center. A mixed-use development with residential units above would
be one suitable redevelopment option. The key to any redevelopment effort would be orienting buildings
to front Olentangy Street and employ a minimal setback.

                                                                   Executive Summary and Conclusions           1.6
Market Study and Strategic Recommendations Analysis                                            Powell, OH

An example of this is already taking shape in the form of the newly constructed Armita Plaza on Olentangy
Street, west of the railroad tracks and between Traditions Way and Lincoln Street. A similar design with
an orientation towards Olentangy Street would immediately connect (both physically and psychologically)
the residential neighborhoods immediately east of downtown with downtown Powell. This more efficient
use of land would also allow space for either shared public/private parking and/or the addition of another
public parking lot north of the buildings.

Key Observations and Recommendations – West Olentangy Commercial Zone

The West Olentangy Commercial Zone includes all parcels along W. Olentangy Street between Galloway
Drive and the railroad tracks and all of the parcels north of W. Olentangy Street up to Powell Adventure
Park and the residential developments to the north. W. Olentangy Street is similar to Grace Drive in that
it contains a mix of retail, office and light industrial uses that have been developed throughout the years
in a very auto-oriented manner with deep setbacks and parking fronting the buildings. It is encouraging
that the two new retail centers have zero setback and have parking oriented to the rear of the building.
This type of development should be encouraged all along the corridor. This could be achieved a few ways,
either through the creation of a zoning overlay district that “floats” over all of the current parcels that
front W. Olentangy Street, by extending the Downtown Business District throughout the corridor or by
creating a new zoning district to guide development and design principles. The creation of a new, single
zoning district would provide a developer with clear guidance and streamline the development process
because they would not have to apply for a change in zoning.

Similar to the Downtown and Grace Drive Zones, new multistory office space would be a compliment to
the new retail and multifamily development in the area. As discussed in the CTA analyses, there are no
Class-A commercial or Class A office spaces located within a 10-minute drive of downtown Powell. Any
new office space should be located close to the street and incorporate a retail or restaurant use on the
ground level and could also incorporate residential units into the mix. Any new mixed-use office
development should also be a minimum of four stories in order to maximize leasable floor space and
generate more income tax revenue.

Key Observations and Recommendations – Sawmill and Home Road Commercial Zone

The Sawmill and Home Road Commercial Zone is characterized mostly by office and retail space and
includes the Villas at Woodcutter condominiums. Olentangy Liberty High School is located just northwest
of this commercial zone. A new OSU Medical Center is planned for the property directly east of the school,
which will employ over 500 people.

Both large institutions represent market opportunities for future retail and service development. The
planned OSU Medical Center not only impact local businesses by adding to the daytime population, it will
also spur other development in the area. In addition to the institutions, the area beyond the northern
border of the North CTA contains thousands of acres of undeveloped land, much of which would likely be
residential. This land is expected to accommodate a population increase of 35% by the year 2040 and
most of those households will be younger family households with two or more children.

                                                                   Executive Summary and Conclusions          1.7
Market Study and Strategic Recommendations Analysis                                             Powell, OH

Although this zone is primarily auto-dependent, that should not prohibit development that encourages
walking, and thus spillover foot traffic upon arrival at this destination. Clusters of similar and/or
compatible uses could cater to both high school and medical center traffic, not to mention the younger
family households that will continue to enter this area. While relatively large-lot, single-family homes are
expected to remain the predominant trait for residential land uses, commercial/retail development need
not eschew development that is much more compact and efficient. Considering the sales and income tax
generating potential at the northern reaches of Powell, the city should encourage or even mandate a
development style other than single standalone uses with their own dedicated parking.

Within the next five years, this area will be capable of supporting a grocery store that is between 20,000
and 40,000 square feet. Please note, this size range reflects the decade-long trend of smaller grocery
footprints and an increasing emphasis on pick-up and/or delivery. However, we want to caution against
allowing a grocery store and parking footprint to dominate this zone at the expense of a compact retail
and service development that could house multiple compatible uses.

Key Observations and Recommendations – Sawmill and Seldom Seen Commercial Zone

The Sawmill and Seldom Seen Commercial Zone includes 21 businesses located at the intersection of
Sawmill Parkway and Seldom Seen Road, all of which reside on the east side of Sawmill Parkway. Located
just 1.3 miles south of the Sawmill and Home Road Commercial Zone and just over a half-mile north of
the intersection of Sawmill Parkway and Powell Road, this zone inherits most of its character from two
retail strip centers.

The layout and design of this commercial zone is only maximizing single-destination trips. Very few
opportunities for pedestrian spillover traffic exist, which means less consumer expenditures and sales and
income tax revenues. This zone is extremely vulnerable to today’s retail and commercial market and the
expectations of these markets in the future when we anticipate most businesses will be able to do more
with less floor space and parking. With the expected increase in retail goods and food delivery, this zone
may be more productive as a small distribution hub—the origin node of the “last mile.” If managed
correctly, this concept could reduce the trips generated when compared to today.

The city of Powell needs to be willing to change their plan and vision for this zone because the current
version is not functioning efficiently. The wholesale redevelopment of one or more parcels may be
required. As currently configured, this zone is unable to compete with retail clusters to the north and
south. In the absence of some significant changes in zoning and layout/configuration, this zone is in danger
of becoming blighted.

Key Observations and Recommendations – Sawmill Parkway and Powell Road Commercial Zone

This zone is best described as a typical neighborhood-scale shopping center anchored by a large grocery
store, fronted by approximately seven acres of parking and six outparcels, only one of which is within the
city of Powell. In addition, five parcels directly east of the shopping center, on the east side of Sawmill
Parkway, have been included in this zone because of their common character.

The Sawmill and Powell Road Commercial Zone faces several short-, mid- and long-term challenges. First,
a nearly identical shopping district is on the south side of Powell Road, in Liberty Township. Consumers
have been known to exhibit brand loyalty when it comes to grocery shopping, but more often than not it
comes down to price.

                                                                   Executive Summary and Conclusions           1.8
Market Study and Strategic Recommendations Analysis Powell, OH
However, if consumers have other shopping to do, they will patronize the shopping center that has all or
most of the destinations they are looking for. In the near-term, there is no clear advantage to either
shopping center, although that could change quickly depending on the grocery stores.
The grocery store sector is on the front lines of the massive disruptions taking place in retail. For decades,
the size of grocery stores grew larger and larger until about ten years ago. For the last decade, grocery
store size has steadily declined as consumers have utilized online and omnichannel retailers to procure
an increasing share of their non-food items. Facing increasing pressure from the likes of Amazon and
Walmart, the grocery store sector has responded recently by being a leader in the online order and pick-
up or delivery of goods. Further, the Kroger Company is testing the use of autonomous delivery vehicles
in Scottsdale, Arizona. After years of failed starts and concepts, the grocery sector has finally found its
footing in the world of e-commerce and omnichannel sales, and it happens to be occurring at the same
time smaller, autonomous delivery vehicles are hitting our streets.
Key Observations and Recommendations – Sawmill and Hampton Commercial Zone
The Sawmill and Hampton Commercial Zone includes the Target at the southwest corner of the
intersection, accompanying outparcel businesses, the shopping center at the southeast corner of Sawmill
and Presidential parkways and the urgent and memory care facility on the west side of Sawmill Parkway.
There are essentially three distinct areas within this zone for which the design and layout are important:
Target and its outparcels, urgent care and strip shopping center. The Target and its outparcels, including
the side parcels, is configured like most Targets in a suburban setting. Target is set back over 650 feet
from Sawmill Parkway and has over seven acres of parking between the building and the outparcels in
front of it. There are four outparcels that have not yet been developed.
This zone lies within the overlap of the Central CTA and the South CTA. The leakage/surplus analysis for
the South CTA indicated there are still market opportunities for almost all retail sectors, but the South
CTA is not nearly as undersupplied as the Central CTA, which had a supply gap of $433 million. The
development, and lack thereof, within the Sawmill and Hampton Road Zone is indeed a reflection of the
market conditions inherent to these two CTAs.
Immediately south of Target it appears there is a new development emerging. This space is fronted by a
parking lot that is relatively unused today, sans a few cars every now and then. Four of the seven
outparcels remain untouched almost five years after the Target was built. If or when demand for
commercial/retail increases in this area, we recommend a compact development style (i.e., strip centers
with shared parking). A more compact design would encourage spillover traffic, thereby reducing total
trips generated.
Key Observations and Recommendations – Village Park Drive Commercial Zone
The Village Park Drive Commercial Zone includes 52 businesses along Village Park Drive and Clairedan
Drive, as well as one office building on N. Liberty Street. This zone is characterized by office space,
warehouse buildings and some apartments and condominiums. The two main office parks are Wolf
Commerce Park (west side of Village Park Drive) and North Powell Office Condominiums (south side of
Clairedan Drive). Both have signs that list all of the businesses and consist of single-story brick buildings.
Executive Summary and Conclusions 1.9Market Study and Strategic Recommendations Analysis Powell, OH
Although this area has developed gradually over the last 20 years, the office building and warehouse/flex-
office design tends to be consistent. The dominant style is single-story, multitenant office buildings like
you would find in a typical suburban office park. Nationally and regionally, the trend has been moving
away from suburban office parks that only contain a single use. This zone does not fit the typical definition
of a suburban office park, but it is close. Although this zone effectively contains a single use, it is
surrounded by or is in close proximity to residential and retail uses (including restaurants and services). In
other words, it is within walking or biking distance to places where workers can eat and/or shop.
Two undeveloped parcels are in the northeast corner of this zone that are currently zoned as Planned
Commercial District, as well as a portion of a parcel located in the northwest corner, that accommodate
such uses as restaurant and convenience retail. The desirability, rents and income taxes associated with
the office and flex-office would likely increase along with the addition of, and improved access to, these
commercial uses. The leakage/surplus analysis for the Central CTA indicates there is demand, and thus
such uses would likely see strong support.
Overall Commercial/Retail Trade Conclusions
All commercial zones within Powell have some degree of vulnerability but that is certainly not unique to
Powell or other similar suburban communities in the region. All investment and income-generating
properties are competing against one another while also adapting to shifting market forces. The city,
developers, investors and citizens should be willing to embrace those tools and development styles that
are appropriate for the area to which they are being applied. The traditional path of commercial
development will not produce the results that are necessary for sustained growth.
The Retail/Commercial and Office sectors are in the middle of a period of great change and realignment.
Norms that have held true over the last 60 years can no longer be trusted to guide policy, planning,
investment and development efforts. No single event is triggering the disruption; rather, it is a
combination of forces which are powerful enough on their own, but when taken together are nothing
short of unstoppable. We are closer to the end of the beginning of this disruption, than we are to the
beginning of the end. It’s quite possible the shifting sands on which these markets are built may be our
new reality, but only time will tell.
Executive Summary and Conclusions 1.10Market Study and Strategic Recommendations Analysis Powell, OH
Housing Primary Market Area (PMA) Delineation
The housing analysis portion of this market study and strategic recommendations analysis is based on the
formation of a Primary Market Area (PMA). A housing PMA is the geographic area where most of the
support for housing originates, where the services used by residents of housing are concentrated and
where households would likely consider housing choices. This is standard methodology used to evaluate
any potential real estate development. Typically, PMAs account for approximately 60% to 80% of the
support component for a housing development. Site specific market feasibility analyses determine PMAs
to evaluate and quantify supply and demand characteristics of a given market. For the purpose of this
housing needs assessment, the primary focus of the analysis is the city of Powell. However, considering
current demographic trends, employment opportunities, roadway access, housing alternatives,
community services, schools, etc., a new housing development located within the city of Powell will draw
resident support from a large portion of the northwestern portion of the Columbus metro area. Additional
support for new housing will come from outside of the Powell city limits. The defined PMA is below.
Executive Summary and Conclusions 1.11Market Study and Strategic Recommendations Analysis Powell, OH
The Dublin area to the west of Powell has a similar demographic and socioeconomic makeup to Powell.
Similarly, east of Powell, the Lewis Center area and the area surrounding Polaris is considered relatively
similar. Although, this area has a much higher share of renter-occupied households, and the median
household incomes are lower, it is likely that households currently residing in upscale apartment units
would consider a home purchase in the city of Powell as a “step-up” housing choice. Similarly, the area
south of Powell, within Franklin County, is also characterized by lower incomes with higher shares of
renter-occupied housing. Residents in this area south of Powell often seek to move north into Powell as
they mature through their careers and have families with school-age children. The stellar Olentangy
School District is an attribute that attracts residents.
Note that the ability of a specific housing development to attract households would be largely dependent
upon numerous factors, including an appealing home design, sufficient unit sizes and bathrooms and the
neighborhood (site) in which the homes are built, specific schools and other community services.
Regardless, it is realistic to assume that a well-designed housing product could draw support from this
geographic area northwest of Columbus. This PMA consists of approximately 112 square miles.
A small portion of support comes from outside the city of Powell and the PMA; however, this support
component is not significant. We anticipate that approximately 80% of support for new housing in the
city of Powell will originate from this geographic area. Additional details regarding the PMA can be found
in Section 4.
Executive Summary and Conclusions 1.12Market Study and Strategic Recommendations Analysis Powell, OH
Demographic Trends
The following demographic overview table compares the trends within the city of Powell, the Primary
Market Area (PMA) Delaware County and the Columbus, Ohio Metropolitan Statistical Area (MSA).
Population/Household Change Overview
City of Powell PMA Delaware County Columbus MSA
Pop. H.H. Pop. H.H. Pop. H.H. Pop. H.H.
2000 Census 6,247 1,975 116,754 44,054 109,989 39,674 1,612,418 636,596
2010 Census 11,500 3,796 159,815 59,640 174,214 62,760 1,836,536 723,572
2018 Estimated 13,417 4,391 186,544 69,173 204,492 73,582 2,029,383 797,308
Change 2010-2018 1,917 595 26,729 9,533 30,278 10,822 192,847 73,736
Percent Change 2010-2018 16.7% 15.7% 16.7% 16.0% 17.4% 17.2% 10.5% 10.2%
2023 Projected 14,700 4,806 203,208 75,144 225,597 81,150 2,145,182 842,469
Change 2018-2023 1,283 415 16,664 5,971 21,105 7,568 115,799 45,161
Percent Change 2018-2023 9.6% 9.5% 8.9% 8.6% 10.3% 10.3% 5.7% 5.7%
Source: VSI; ESRI; 2000, 2010 Census
H.H. – Households
Pop. – Population
After experiencing a significant demographic increase between 2000 and 2010, the city of Powell has
experienced similar demographic growth rates since 2010 compared to the PMA and Delaware County as
a whole, and greater growth than the Columbus MSA. The following chart compares the rate of
population growth for the city, PMA, county and MSA.
Population Growth Percent Change Comparison
90.0%
84.1%
80.0%
70.0%
60.0%
58.4%
50.0%
40.0%
30.0%
36.9% 17.4%
20.0%
16.7% 16.7% 10.3%
10.0% 9.6%
13.9% 8.9%
10.5% 5.7%
0.0%
2000 - 2010 2010 - 2018 2018 - 2023
City of Powell PMA Delaware County Columbus MSA
Source: 2010 Census; ESRI; Urban Decision Group; VSI
As illustrated in the preceding chart, the city of Powell is projected to experience slightly greater
population growth over the next five years than the PMA. Conversely, Delaware County is projected to
experience slightly greater population growth than the city of Powell. All three of these geographic areas
will increase at a greater rate than the Columbus MSA as a whole.
Executive Summary and Conclusions 1.13Market Study and Strategic Recommendations Analysis Powell, OH
When evaluating potential and future need for housing, it is important to evaluate household trends. The
following table compares the distribution and projected growth of households by age.
Households by Age
Year < 25 25-34 35-44 45-54 55-64 65-74 75-84 85+ Total
2018 14 409 1,021 1,114 963 543 235 91 4,391
City of
2023 14 480 1,097 1,030 1,065 685 313 121 4,806
Powell
% Change 0.0% 17.4% 7.4% -7.5% 10.6% 26.1% 33.2% 33.0% 9.5%
2018 2,182 11,431 15,528 15,117 13,013 7,543 3,049 1,310 69,173
PMA 2023 2,332 12,538 16,393 14,857 13,769 9,563 3,982 1,710 75,144
% Change 6.9% 9.7% 5.6% -1.7% 5.8% 26.8% 30.6% 30.5% 8.6%
2018 1,579 9,433 15,935 16,685 14,508 9,674 4,347 1,422 73,582
Delaware
2023 1,697 10,562 16,918 16,631 15,733 12,083 5,671 1,856 81,150
County
% Change 7.5% 12.0% 6.2% -0.3% 8.4% 24.9% 30.5% 30.5% 10.3%
2018 45,215 140,502 145,350 146,015 145,402 103,107 50,286 21,432 797,308
Columbus
2023 46,527 147,873 151,759 140,925 148,286 121,450 60,055 25,595 842,469
MSA
% Change 2.9% 5.2% 4.4% -3.5% 2.0% 17.8% 19.4% 19.4% 5.7%
Source: 2010 Census; ESRI; Urban Decision Group; VSI
The following graph illustrates the projected percent changes in households by age through 2023.
Household Percent Change by Age (2018-2023)Market Study and Strategic Recommendations Analysis Powell, OH
The estimated 2018 distribution of households by income and the median income by tenure within the
city of Powell, the PMA, Delaware County as the Columbus MSA are summarized as follows:
Household Income – 2018 (Estimated)
Household City of Powell PMA Delaware County Columbus MSA
Income Range Households Percent Households Percent Households Percent Household Percent
Less than $10,000 18 0.4% 1,095 1.6% 1,998 2.7% 53,185 6.7%
$10,000 to $19,999 67 1.5% 2,105 3.0% 3,085 4.2% 70,785 8.9%
$20,000 to $29,999 92 2.1% 2,918 4.2% 3,750 5.1% 74,818 9.4%
$30,000 to $39,999 99 2.2% 3,950 5.7% 4,056 5.5% 75,714 9.5%
$40,000 to $49,999 140 3.2% 4,652 6.7% 4,309 5.9% 69,008 8.7%
$50,000 to $59,999 137 3.1% 4,710 6.8% 4,153 5.6% 62,564 7.8%
$60,000 to $74,999 204 4.6% 5,684 8.2% 6,035 8.2% 79,688 10.0%
$75,000 to $99,999 494 11.2% 9,043 13.1% 10,192 13.9% 104,209 13.1%
$100,000 to $124,999 620 14.1% 8,337 12.1% 9,398 12.8% 73,864 9.3%
$124,999 to $149,999 486 11.1% 6,736 9.7% 7,259 9.9% 44,756 5.6%
$150,000 to $199,999 910 20.7% 8,921 12.9% 9,184 12.5% 46,142 5.8%
$200,000+ 1,127 25.7% 11,023 15.9% 10,161 13.8% 42,576 5.3%
Total 4,391 100.0% 69,173 100.0% 73,582 100.0% 797,308 100.0%
Median Income $141,887 $101,389 $98,183 $58,824
Median Owner Income $145,552 $123,157 $113,658 $78,510
Median Renter Income $53,536 $57,761 $46,850 $35,009
Source: 2010 Census; ESRI; Urban Decision Group; VSI
The median household income is Powell ($141,887) is significantly higher than the PMA ($101,389),
Delaware County ($98,183) and the Columbus MSA ($58,824). However, it should be noted that the
median renter income in the city of Powell is actually less than the median renter income in the PMA.
This is likely due in part of the limited number of rental options in the city of Powell.
Household Income – 2018 (Estimated)
$160,000
$141,887 $145,552
$140,000
$120,000 $123,157
$100,000 $101,389
$80,000
$113,658 $57,761
$60,000
$98,183 $53,536
$40,000
$46,850
$20,000
$58,824 $78,510 $35,009
$0
Median Income Median Owner Income Median Renter Income
City of Powell PMA Delaware County Columbus MSA
Source: 2010 Census; ESRI; Urban Decision Group; VSI
Additional demographic characteristics and trends can be found in Section 5.
Executive Summary and Conclusions 1.15Market Study and Strategic Recommendations Analysis Powell, OH
Economic Trends Summary
Located in Delaware County, the city of Powell is an upscale, high-income suburban community north
Columbus. Powell contains different Commercial Trade Area (CTAs) and commercial zones, as described
in detail in Section IX of this market study and strategic recommendations analysis. Within these different
CTAs and commercial zones are a wide variety of job opportunities for locals. However, Powell is not
reliant on its own commercial base but on the larger, more diversified regional base of the Columbus
metropolitan area, which includes Delaware County, for its residences’ workplaces. The city of Powell
noted it receives over 90% of its income tax revenue from individuals who work outside the city limits.
Between 2001 and 2017, Delaware County employment grew significantly by 128.4% overall. This
compares favorably to a 1.3% employment decline statewide during the same period. Employment in
Delaware County dipped during 2009, but has increased steadily since then, resulting in a 22.1% growth
during the past seven-year period. Based on the positive demographic growth of Powell, as well as the
historical economic growth, it is anticipated that the local economy will continue to grow in and around
Powell.
The recently announced plans of The Ohio State University’s Wexner Medical Center to develop an
Outpatient Surgery Center and medical offices northeast of the intersection of Sawmill Parkway and Home
Road will have a significant economic impact on the city of Powell. The first phase of the development
will initially bring 450 to 500 jobs to the area, with an average salary of employees of approximately
$100,000 per year. A second phase of development will likely bring an additional 125 to 500 employees
to the area. The first phase of development is planned to involve the construction of a 150,000-square-
foot, five-story, ambulatory care center and a two-story building with another 56,000 square feet of
medical space. The second phase will include approximately 250,000 to 300,000 square feet of medical
space. These medical facilities and the new workers who will be working in Powell will provide a significant
amount of new demand for additional housing development.
Executive Summary and Conclusions 1.16Market Study and Strategic Recommendations Analysis Powell, OH
Housing Overview
We have analyzed demographic data collected by the American Community Survey (ACS) as well as
conducted an in-person survey of existing rental housing in Powell and the defined PMA. The following
table summarizes the distributions of the area housing stock:
Distribution of Housing Stock
Geographic 2010 (Census) 2018 (Estimated) 2023 (Projected)
Area Housing Status Number Percent Number Percent Number Percent
Total-Occupied 3,796 95.5% 4,391 96.9% 4,806 96.8%
Owner-Occupied 3,574 94.2% 4,077 92.9% 4,453 92.7%
City of
Renter-Occupied 222 5.8% 314 7.1% 353 7.3%
Powell
Vacant 179 4.5% 140 3.1% 157 3.2%
Total 3,975 100.0% 4,531 100.0% 4,963 100.0%
Total-Occupied 59,640 94.6% 69,173 96.4% 75,144 96.3%
Owner-Occupied 43,853 73.5% 49,472 71.5% 53,872 71.7%
PMA Renter-Occupied 15,787 26.5% 19,701 28.5% 21,272 28.3%
Vacant 3,384 5.4% 2,553 3.6% 2,878 3.7%
Total 63,024 100.0% 71,726 100.0% 78,022 100.0%
Total-Occupied 62,760 94.5% 73,582 96.1% 81,150 96.0%
Owner-Occupied 51,354 81.8% 58,676 79.7% 64,648 79.7%
Delaware
Renter-Occupied 11,406 18.2% 14,905 20.3% 16,501 20.3%
County
Vacant 3,618 5.5% 3,012 3.9% 3,352 4.0%
Total 66,378 100.0% 76,594 100.0% 84,502 100.0%
Total-Occupied 723,572 91.3% 797,308 92.5% 842,469 92.4%
Owner-Occupied 452,499 62.5% 474,333 59.5% 499,596 59.3%
Columbus MSA Renter-Occupied 271,073 37.5% 322,976 40.5% 342,874 40.7%
Vacant 68,768 8.7% 64,264 7.5% 68,929 7.6%
Total 792,340 100.0% 861,572 100.0% 911,398 100.0%
Source: 2010 Census; ESRI; Urban Decision Group; VSI
In 2018, the city of Powell is estimated to have a 3.1% vacancy rate among all housing units (both owner
and renter). This is considered extremely low and is less than half of the Columbus MSA vacancy rate of
7.5%. This may be due in part to the fact that the city of Powell has an extremely low share of renter-
occupied housing units, 7.1%. Owner-occupied housing clearly dominate the city of Powell, more so than
the PMA, Delaware County or the Columbus MSA.
The city of Powell is a destination housing location. However, additional rental options could increase the
chance for greater growth, as it is often easier for communities to retain current residents and allow them
to “move-up” to higher quality homeownership options, than it is to attract demographic support from
outside of the area, where other options may exist. Generally, a health continuum of housing with a
variety of housing options (with regard to type and price-points) is a positive attribute of a community.
Executive Summary and Conclusions 1.17Market Study and Strategic Recommendations Analysis Powell, OH
Distribution of Housing Stock Distribution of Housing Stock
(City of Powell) (PMA)
Renter- Vacant
Renter- Vacant Occupied 4%
Occupied 3% 27%
7%
Owner-
Owner- Occupied
Occupied 69%
90%
Owner-Occupied Renter-Occupied Vacant Owner-Occupied Renter-Occupied Vacant
Distribution of Housing Stock Distribution of Housing Stock
(Delaware County) (Columbus MSA)
Renter- Vacant
Vacant
Occupied 8%
4%
19% Renter-
Occupied
37%
Owner-
Occupied
55%
Owner-
Occupied
77%
Owner-Occupied Renter-Occupied Vacant Owner-Occupied Renter-Occupied Vacant
Executive Summary and Conclusions 1.18Market Study and Strategic Recommendations Analysis Powell, OH
Apartment Survey
We identified and personally surveyed 87 conventional apartment projects containing a total of 17,263
rental units within the Powell PMA during our in-person survey in May and June 2018. This survey was
conducted to establish the overall strength of the rental market and to identify those properties that
would be theoretically most comparable to modern, new construction apartments that could potentially
be supported in the city. In the Powell PMA, we consider rental properties of generally more than 20 units
per property to be “conventional” apartment projects. Single-family home rentals, duplexes and tri-
plexes are generally considered to be non-conventional rentals. It should be noted that additional small
four- to eight-unit rental projects, technically considered “conventional” in this analysis, were identified
in Powell. Although complete data for each project could not be obtained for some of these smaller rental
projects, we were able to obtain rental information on many of these units and have included them in the
discussion and aggregate data provided in the non-conventional rental analysis found later in this section.
Additional details of the each surveyed conventional rental project can be found in Section 7.
Executive Summary and Conclusions 1.19Market Study and Strategic Recommendations Analysis Powell, OH
We identified eight under construction properties in the Powell PMA as well as four planned/proposed
conventional apartment projects. The following table summarizes the distribution of existing apartment
units in the PMA by bedroom/bathroom unit type.
Market-rate
Vacant Vacancy Median
Bedrooms Baths Units Distribution Units Rate Net Rent
Studio 1.0 179 1.0% 5 2.8% $796
One-Bedroom 1.0 5,675 32.9% 286 5.0% $990
One-Bedroom 1.5 90 0.5% 29 32.2% $1,569
Two-Bedroom 1.0 2,891 16.8% 39 1.3% $1,037
Two-Bedroom 1.5 1,623 9.4% 23 1.4% $1,163
Two-Bedroom 2.0 4,044 23.5% 191 4.7% $1,338
Two-Bedroom 2.5 2,268 13.2% 52 2.3% $1,358
Three-Bedroom 1.5 29 0.2% 1 3.4% $1,125
Three-Bedroom 2.0 194 1.1% 4 2.1% $1,843
Three-Bedroom 2.5 200 1.2% 2 1.0% $1,902
Three-Bedroom 3.0 30 0.2% 1 3.3% $2,520
Four-Bedroom 2.0 20 0.1% 1 5.0% $2,199
Total Market-rate 17,243 100% 634 3.7% -
Overall Median Market-rate Rent $1,170
Subsidized Tax Credit
Vacant Vacancy Median
Bedrooms Baths Units Distribution Units Rate Net Rent
One-Bedroom 1.0 20 100.0% 0 0.0% -
Total Market-rate 20 100% 0 0.0% -
Grand Total 17,263 - 634 3.7% -
Source: VSI Field Survey
Median rents increase based on the number of bedrooms and bathrooms offered. Specifically, the two-
bedroom/1.0-bath median net rent is $1,037, while the two-bedroom/2.5-bath median net rent is $1,358.
Similarly, the three-bedroom/1.0-bath median rent among surveyed units is $1,125, while the three-
bedroom/3.0-bath median net rent is $2,520. Overall, larger units with more bathrooms are commanding
notably higher rents than smaller units with just 1.0 bathroom per unit.
The following table summarizes the breakdown of market-rate apartment units in conventional
apartment projects surveyed within the PMA. Note that we have provided rent data based on the
collected/net rents. Affordable housing programs typically require the evaluation of the total cost of
housing, or gross rent (collected rent plus tenant-paid utilities), while market-rate (non-income- or rent-
restricted) are often more concerned with the collected/net rent.
Executive Summary and Conclusions 1.20Market Study and Strategic Recommendations Analysis Powell, OH
Market-rate
Unit Size Range Net Rent Net Rent/
Bedrooms Baths Units (Square Feet) Range Square Foot Range
Studio 1.0 179 288 - 779 $587 - $1,376 $1.28 - $2.42
One-Bedroom 1.0 5,675 550 - 1,180 $729 - $2,078 $1.00 - $1.94
One-Bedroom 1.5 90 1,206 - 1,393 $1,279 - $2,053 $0.92 - $1.70
Two-Bedroom 1.0 2,891 650 - 1,130 $819 - $1,538 $0.96 - $1.52
Two-Bedroom 1.5 1,623 900 - 1,650 $970 - $2,474 $0.59 - $2.51
Two-Bedroom 2.0 4,044 872 - 1,960 $825 - $2,647 $0.92 - $2.56
Two-Bedroom 2.5 2,268 1,225 - 1,623 $1,130 - $3,676 $0.87 - $1.90
Three-Bedroom 1.5 29 870 - 1,250 $1,125 - $1,756 $0.80 - $1.67
Three-Bedroom 2.0 194 1,223 - 2,191 $1,357 - $2,822 $0.93 - $1.79
Three-Bedroom 2.5 200 1,130 - 2,060 $1,226 - $2,102 $1.09 - $1.33
Three-Bedroom 3.0 30 1,885 - 1,980 $2,520 - $2,600 $1.31 - $1.34
Four-Bedroom 2.0 20 2,100 $2,199 $1.05
Source: VSI Field Survey
N/A – not applicable, as residents pay 30% of their income to rent in subsidized units
The following are photographs of a sampling of existing conventional apartment projects in the Powell
PMA.
Example of Modern, “A” Quality Market-Rate Apartments
Executive Summary and Conclusions 1.21Market Study and Strategic Recommendations Analysis Powell, OH
Housing Choice Voucher Holders
In addition to government-subsidized apartments, which operate with project-based subsidies, there is
another program that serves very low-income renters. This program is the Housing Choice Voucher
program, which is administered by local housing authorities. Individual households can apply for and
receive a Housing Choice Voucher, which the households can then take to any rental home that accepts
these Vouchers. Residents with Vouchers are merely responsible to pay 30% of their income to rent,
rather than the asking rent at the property in which they live.
The housing authority administering the Vouchers will pay the remaining amount, up to the amount of
the specified payment standard. This Housing Choice Voucher program has historically been successful
in providing very low-income renter households with additional affordable housing opportunities, outside
of project-based government-subsidized or income-restricted properties.
According to the Delaware Metropolitan Housing Authority, approximately 440 Housing Choice Vouchers
are in use within Delaware County. Housing authority representatives stated that approximately 800
households are in use currently on the waiting list for additional Vouchers. The waiting list is currently
closed. This reflects the continuing need for Housing Choice Voucher assistance. Note that based on our
survey of nearly 100 conventional apartment projects, most do not accept vouchers. Therefore, although
demographic support and market demand exist for more low-income rental housing, property owners in
this part of Columbus have generally been unwilling to accept Vouchers and low-income tenants.
Executive Summary and Conclusions 1.22Market Study and Strategic Recommendations Analysis Powell, OH
Non-Conventional Rentals (Single-Family Homes, Duplexes, Triplexes, Etc.)
During our in-person evaluation of the Powell PMA rental market, VSI identified and surveyed a sampling
of non-conventional rental units, primarily including single-family rentals, as well as some duplex-unit
rentals and other small communities with less than five units per project. These non-conventional rentals
are dominated by single-family homes generally built between 10 and 20 years ago that are considered
to be in good to very good condition. Many of these properties were acquired during the Great Recession
when numerous homes were foreclosed. The following table summarizes these surveyed non-
conventional rentals.
Survey of Non-Conventional Rentals
Square Footage Low High Median
Bedrooms Units Range Collected Rent Collected Rent Collected Rent
Two-Bedroom 4 1,056 – 1,240 $1,100 $1,350 $1,183
Three-Bedroom 8 1,809 – 2,554 $1,775 $2,495 $1,983
Four-Bedroom 16 1,800 – 4,700 $1,985 $3,400 $2,545
Five-Bedroom 3 2,200 – 4,500 $2,495 $3,330 $2,799
Total 31 1,056 – 4,700 $1,100 $3,400 $2,210
Source: VSI Field Survey
The following map illustrates the locations of the non-conventional rental units surveyed during our in-
person evaluation of the Powell housing market.
Executive Summary and Conclusions 1.23Market Study and Strategic Recommendations Analysis Powell, OH
Below are photographs of a sample of the non-conventional rentals that were surveyed that reflect the
quality and types of non-conventional rentals available.
Example of Non-Conventional Single-Family Rentals
Example of Duplex/Condominium Non-Conventional Rentals
Executive Summary and Conclusions 1.24Market Study and Strategic Recommendations Analysis Powell, OH
Although some of the lower quality, older non-conventional rentals are achieving rents below $2,000, the
non-conventional rentals within the city of Powell are generally achieving monthly rents above $2,000.
These properties typically provide rental housing to larger families often with pre-school or school-age
children. Overall, despite the existence of some upscale rental alternatives for higher earning households,
it should be noted that executive rental housing is still in very high demand in Powell.
As discussed in the demographic analysis portion of this housing needs assessment, found in Section 5,
there are 278 renter households within the city of Powell in 2018 (estimated) with incomes of more than
$75,000 per year. Within the Powell PMA, there are 13,290 renter households with incomes above
$75,000. The following table illustrates the distribution of renter household income by household size.
Household City of Powell: Renter Households 2018 (Estimated)
Income Range 1-Person 2-Person 3-Person 4-Person 5-Person+ Total
Less Than $10,000 3 1 1 1 0 6
$10,000 to $19,999 12 5 3 2 1 23
$20,000 to $29,999 15 7 4 3 2 31
$30,000 to $39,999 13 7 4 3 2 29
$40,000 to $49,999 15 9 5 4 2 35
$50,000 to $59,999 8 5 3 2 2 20
$60,000 to $74,999 12 8 4 4 2 30
$75,000 to $99,999 13 11 6 5 3 37
$100,000 to $124,999 12 9 5 4 3 32
$125,000 to $149,999 9 7 4 3 2 25
$150,000 to $199,999 7 6 3 3 2 20
$200,000 & Over 9 7 4 3 2 25
Total 129 82 43 37 23 314
Source: 2010 Census; ESRI; Urban Decision Group; VSI
Household Powell PMA Renter Households 2018 (Estimated)
Income Range 1-Person 2-Person 3-Person 4-Person 5-Person+ Total
Less Than $10,000 228 153 87 55 35 558
$10,000 to $19,999 469 299 171 108 69 1,115
$20,000 to $29,999 749 464 265 167 107 1,752
$30,000 to $39,999 875 658 376 237 152 2,297
$40,000 to $49,999 896 713 407 257 165 2,438
$50,000 to $59,999 812 650 371 235 151 2,218
$60,000 to $74,999 991 779 445 281 181 2,678
$75,000 to $99,999 1,152 1,007 575 365 234 3,334
$100,000 to $124,999 391 348 199 126 81 1,145
$125,000 to $149,999 314 283 162 102 65 925
$150,000 to $199,999 187 170 97 61 39 555
$200,000 & Over 238 207 118 75 48 687
Total 7,302 5,731 3,272 2,068 1,328 19,701
Source: 2010 Census; ESRI; Urban Decision Group; VSI
Considering the demographic trends in the city of Powell and within the PMA, there is a significant
demographic support base among renter households that could theoretically afford to live in upscale
rental housing. Additional details of the demographic support potential for additional upscale, market-
rate rental housing within the city of Powell can be found in Section 9 of this market study and strategic
recommendations analysis.
Executive Summary and Conclusions 1.25You can also read