Radio footprints of a minor merger in the Shapley Supercluster: From supercluster down to galactic scales
←
→
Page content transcription
If your browser does not render page correctly, please read the page content below
Astronomy & Astrophysics manuscript no. Venturi                                                                                     ©ESO 2022
                                               January 14, 2022

                                                  Radio footprints of a minor merger in the Shapley Supercluster:
                                                            From supercluster down to galactic scales
                                               Venturi T.1 , Giacintucci S.2 , Merluzzi P.3 , Bardelli, S.4 , Busarello, G.3 , Dallacasa, D.5, 1 , Sikhosana, S. P.6, 7 , Marvil, J.8 ,
                                                  Smirnov, O.9, 10 , Bourdin, H.11 , Mazzotta, P.11 , Rossetti, M.12 , Rudnick, L.13 , Bernardi, G.1, 9, 10 , Brüggen, M.14 ,
                                                Carretti, E.1 , Cassano, R.1 , Di Gennaro, G.15, 14 , Gastaldello, F.12 , Kale, R.16 , Knowles, K.9, 10 , Koribalski, B. S.17, 18 ,
                                                Heywood, I.19, 20, 10 , Hopkins, A.M.21 , Norris, R. P.18, 17 , Reiprich, T. H.22 , Tasse, C.23, 24 , Vernstrom, T.25 , Zucca, E.4 ,
                                                                                  Bester, L. H.10, 9 , Diego, J. M.26 , Kanapathippillai, J.25
                                                                                                 (Affiliations can be found after the references)
arXiv:2201.04887v1 [astro-ph.CO] 13 Jan 2022

                                                                                                   Received ??-??-????; accepted ??-??-????

                                                                                                                  ABSTRACT

                                               Context. The Shapley Supercluster (hzi ≈ 0.048) contains several tens of gravitationally bound clusters and groups, making it it is an ideal subject
                                               for radio studies of cluster mergers.
                                               Aims. We used new high sensitivity radio observations to investigate the less energetic events of mass assembly in the Shapley Supercluster from
                                               supercluster down to galactic scales.
                                               Methods. We created total intensity images of the full region between A 3558 and A 3562, from ∼ 230 to ∼ 1650 MHz, using ASKAP, MeerKAT
                                               and the GMRT, with sensitivities ranging from ∼6 to ∼ 100 µJy beam−1 . We performed a detailed morphological and spectral study of the extended
                                               emission features, complemented with ESO-VST optical imaging and X–ray data from XMM-Newton.
                                               Results. We report the first GHz frequency detection of extremely low brightness intercluster diffuse emission on a ∼ 1 Mpc scale connecting a
                                               cluster and a group, namely: A 3562 and the group SC 1329–313. It is morphologically similar to the X-ray emission in the region. We also found
                                               (1) a radio tail generated by ram pressure stripping in the galaxy SOS 61086 in SC 1329–313; (2) a head-tail radio galaxy, whose tail is broken and
                                               culminates in a misaligned bar; (3) ultrasteep diffuse emission at the centre of A 3558. Finally (4), we confirm the ultra-steep spectrum nature of
                                               the radio halo in A 3562.
                                               Conclusions. Our study strongly supports the scenario of a flyby of SC 1329–313 north of A 3562 into the supercluster core. This event perturbed
                                               the centre of A 3562, leaving traces of this interaction in the form of turbulence between A 3562 and SC 1329–313, at the origin of the radio
                                               bridge and eventually affecting the evolution of individual supercluster galaxies by triggering ram pressure stripping. Our work shows that minor
                                               mergers can be spectacular and that they have the potential to generate diffuse radio emission that carries important information on the formation
                                               of large-scale structures in the Universe.
                                               Key words. radio continuum: galaxies - galaxies: clusters: general - galaxies: clusters: individual: A3558 - galaxies: clusters: individual: A3562
                                               - galaxies: clusters: individual: SC1329–313 - galaxies: clusters: individual: SC1327–312

                                               1. Introduction                                                            ter mergers is supported by a number of observational results and
                                                                                                                          statistical investigations as per (Schuecker et al. 2001; Cassano
                                               According to the hierarchical scenario for the formation of large-         et al. 2010; Kale et al. 2015), as well as studies on several indi-
                                               scale structures, galaxy clusters form as a consequence of merg-           vidual clusters (e.g. A 521, Bourdin et al. (2013); A 1682, Clarke
                                               ers to reach and exceed masses on the order of 1015 M . With a             et al. (2019); A 2256, Ge et al. (2020)). The former results show
                                               total energy output on the order of 1063 − 1064 erg, cluster merg-         that the number of radio halos is a steep function of the cluster
                                               ers are the most energetic events in the Universe. The gravita-            mass and their detection in merging clusters increases consid-
                                               tional energy released into the cluster volume during such events          erably for masses M ∼    > 8 × 10¹⁴ M (see Liang et al. (2000),
                                               deeply affects the dynamics of the galaxies, as well as the prop-          Buote (2001) and more recently Cuciti et al. (2021), Duchesne
                                               erties of the thermal and non-thermal (relativistic particles and          et al. (2021b), van Weeren et al. (2021)). Moreover, it has been
                                               magnetic field) components of the intracluster medium (ICM).               shown that less massive and/or less energetic mergers may lead
                                                   The close connection between the properties of the radio               to the formation of radio halos with ultra-steep spectra, as found
                                               emission in galaxy clusters and their dynamical state is now an            in A 521, whose spectrum with α ∼ −1.9 makes it a prototype for
                                               established result. In particular, giant radio halos and relics – on a     ultra-steep spectrum radio halos (Brunetti et al. 2008; Dallacasa
                                               l Mpc-scale synchrotron steep-spectrum (α typically in the range           et al. 2009).
                                               [–1.4,–1.2] for S ∝ να ) radio sources of µJy arcsec−2 surface
                                               brightness and below (see van Weeren et al. 2019, for a recent                 Most of our current knowledge on the connection between
                                               observational overview) – are thought to be the result of particle         cluster mergers and diffuse cluster radio sources is built upon
                                               re-acceleration due to turbulence and shocks induced in the clus-          observations of samples of intermediate to massive clusters,
                                               ter volume during mergers and accretion processes (see Brunetti            namely, M ∼ > 6 − 8 × 10¹⁴ M , and characterised by mergers

                                               & Jones 2014, for the most recent theoretical review). While the           with a moderate mass ratio (M2 /M1 ≥ 1:4-1:5; i.e. Cassano et al.
                                               details of the microphysics of these processes are still being in-         (2016)). However, the dominant (i.e. most frequent) process of
                                               vestigated, the connection between radio halos, relics, and clus-          mass assembly in the Universe is the accretion of systems in less
                                                                                                                                                                     Article number, page 1 of 22
A&A proofs: manuscript no. Venturi

extreme processes involving either smaller masses or mass ra-         tween M500 ≈ 0.4 − 9.8 × 10¹⁴ M (Higuchi et al. 2020)1 , and
tios well below 1:4–1:5, namely, so-called ’minor mergers’. The       LX ≈ 0.4−6.7×1044 erg s−1 (de Filippis et al. 2005) respectively,
steep relation between the cluster mass (or X-ray luminosity)         across 260 Mpc2 around the supercluster core.
and the radio power for radio halos (i.e. Cuciti et al. (2021)) and       The A 3558 cluster complex is the centre of the Shapley Su-
relics (i.e. de Gasperin et al. (2014); Duchesne et al. (2021a)),     percluster. It consists of a chain of three ACO (Abell et al. 1989)
along with the limited sensitivity of radio interferometers has       clusters (A 3556, A 3558 and A 3562) and two smaller groups
made the detection of such sources in less massive systems an         (SC 1327–312 and SC 1329–313). It is extended for a projected
extremely challenging task thus far and the observational signa-      length of about 7.5 h−1 Mpc in the east-west direction at an av-
tures of minor mergers are still largely unexplored.                  erage redshift of hzi ≈ 0.048. Figure 1 shows the clusters and
     Against this backdrop, we can also see that a new era has        groups in the Shapley Supercluster. The cyan lines highlight the
just begun. The substantial leap forward in sensitivity and u − v     area covered by the ASKAP observations (Section 3.1) and the
coverage offered by current interferometers – such as LOw             red lines highlight the area of the Shapley Supercluster Survey
Frequency ARray (LOFAR, van Haarlem et al. (2013), Aus-               (ShaSS Merluzzi et al. 2015; Mercurio et al. 2015), which in-
tralian Square Kilometre Array Pathfinder (ASKAP, Hotan et al.        cludes optical imaging from ESO-VLT Survey Telescope (VST).
(2021)), MeerKAT ((Camilo et al. 2018)), and the upgraded Gi-         The main properties of the clusters studied in this paper are re-
ant Metrewave Radio Telescope (uGMRT) – is broadening the             ported in Table 1.
observational parameter space considerably and opening a new              Several studies in the infrared and visibile (Bardelli et al.
window on phenomena that have been inaccessible thus far. Ra-         1998a,b; Merluzzi et al. 2015; Haines et al. 2018; Higuchi et al.
dio bridges of extremely low surface brightness are being dis-        2020), X–ray (Markevitch & Vikhlinin 1997; Ettori et al. 2000;
covered (i.e. A 1758, Botteon et al. (2020a); A 399–A 401, Gov-       Rossetti et al. 2007; Finoguenov et al. 2004; Ghizzardi et al.
oni et al. (2019)) and, in addition, extremely long and twisted       2010); and radio (Venturi et al. (2000); Venturi et al. (2003),
tailed radio galaxies as well as ultra-steep spectrum radio fil-      hereinafter V03; Giacintucci et al. (2004) and Giacintucci et al.
aments are shown to be common inhabitants of galaxy clusters          (2005), hereinafter G05; Venturi et al. (2017a), hereinafter V17)
(i.e. A 2034, Shimwell et al. (2016); Perseus, Gendron-Marsolais      have provided observational evidence in support of the idea that
et al. (2020); A 2255, Botteon et al. (2020b)).                       merging and accretion processes are taking place in the whole
     To take advantage of these new capabilities, we observed         region between A 3558 and A 3562. This portion of the Shapley
the central region of the Shapley Supercluster with ASKAP,            Supercluster has also been detected by Planck (see Fig. 1 in the
MeerKAT, and GMRT in search of radio signatures of merger             Planck collaboration paper Planck Collaboration et al. (2014)).
events in low- to intermediate-mass environments. In this paper,      On the western end of the chain, the cluster A 3556 is rather
we focus on the A 3558 cluster complex in the central region          faint in X–rays and shows a dynamically relaxed state. The ra-
of the Shapley Supercluster and we report on the findings in          dio properties of the dominant galaxy in A 3556 are consistent
the whole region, which includes the two clusters A 3558 and          with its relaxed dynamical state as derived from the X–ray (Ven-
A 3562, and the two groups SC 1327–312 and SC 1329–313 be-            turi et al. 1997; Di Gennaro et al. 2018).
tween them. The layout of the paper is as follows. In Sect. 2, we
provide an overview of the region of the Shapley Supercluster
that is under investigation. In Sect. 3, we describe the radio ob-
servations and the data analysis. The radio images and spectral
analysis are presented in Sect. 4. Our findings are discussed in
Sect. 5. Conclusions are given in Sect. 6.
     Throughout the paper, we use the spectral power-law con-
vention S ν ∝ να and assume a cosmology based on H0 = 70 km
s−1 Mpc−1 , Ωm = 0.3, and ΩΛ = 0.7. At the average redshift of
the Shapley Supercluster, that is, z=0.048, this gives a conver-
sion factor of 0.928 kpc/arcsec and a luminosity distance of 210
Mpc.

2. Shapley Supercluster in context
                                                                      Fig. 1. Location of the clusters and groups in the Shapley Superclus-
The Shapley Supercluster (Shapley 1930) is one of the rich-           ter. The redshift information is from the 6dF Galaxy Survey (6dFGS,
est and most massive concentrations of gravitationally bound          Jones et al. 2009). The redshift range considered is 0.035–0.060. The
galaxy clusters in the local Universe (i.e. Scaramella et al. 1989;   cyan lines highlight the area covered by the ASKAP observations (Sec-
Raychaudhury 1989; Vettolani et al. 1990; Zucca et al. 1993).         tion 3.1), the red lines highlight the coverage of the ESO-VST optical
                                                                      imaging of ShaSS (Merluzzi et al. 2015).
It is located in the southern sky and lies behind the Hydra-
Centaurus cluster. Overall, the structure covers a redshift range
0.033 ∼ < z < 0.06 (Quintana et al. 1995, 1997), and has a mean
            ∼
redshift of z ≈ 0.048.                                                3. Observations and data analysis
    Due to the very high overdensity and large number of galaxy
clusters, and also thanks to its proximity, it is an ideal place to   The findings presented in this paper are based on five differ-
start investigating the effects of group accretion and cluster mi-    ent datasets, collected with GMRT, ASKAP, and MeerKAT, and
nor mergers, as is clear from the masses and bolometric X-ray         1
                                                                         The dynamical masses presented in Higuchi et al. (2020)
luminosities of the individual clusters and groups, which range       have been transformed to M500 by means of the software hy-
(estimated using 11 clusters, including A 3552, see Fig. 1) be-       dro_mc(github.com/aragagnin/hydro_mc) by Ragagnin et al. (2020).

Article number, page 2 of 22
T. Venturi: Radio footprints of a minor merger

Table 1. Properties of the clusters

                      Cluster         RAJ2000         DECJ2000           v             σv               LX,bol        M500
                      Name                h,m,s           o,0,00
                                                                       km s−1        km s−1          1044 erg s−1    1013 M
                      A 3558          13 28 02        –31 29 35      14500 ± 40     1007 ± 30           6.68          98±9
                      SC 1327–312     13 29 45        –31 36 13      14800 ± 40     535 ± 20            1.27          20±2
                      SC 1329–313     13 31 36        –31 48 45      13400 ± 50     373 ± 30            0.52           5±1
                      A 3562          13 33 47        –31 40 37      14800 ± 55     769 ± 30            3.31          44±5

Notes: Cluster coordinates are taken from Merluzzi et al. (2015). Values for v and σv are taken from Haines et al. (2018), LX,bol
from de Filippis et al. (2005). M500 is derived from Mdyn in Higuchi et al. (2020) by means of the package hydro_mc (Ragagnin
et al. 2020).

Table 2. Logs of the observations and image parameters

 Cluster              Pointing centre             Array        Project    Obs. Date       ν(a)      ∆ν(b)   tint         FWHM              rms
                     RA, DEC (J2000)                                                     MHz        MHz      h              ,
                                                                                                                          00 ◦
                                                                                                                                       µJy beam−1
 A 3558             13 25 51, -31 03 05     ASKAP             ESP 20     19-Mar-19        887       288     11      13.2×10.4, 85.4      ∼30–50
 A 3558             13 27 54, -31 29 32      GMRT             22_039     30-Aug-12        306        32      7       14.0×9.5, 18.4     ∼ 60–100
                                             GMRT             22_039     02-May-15        608        32      5       10.9×5.6, 35.2       ∼ 100
                    13 27 54, -31 29 32     MeerKAT             (c)       04-Jul-18      1283       856      2        7.0×5.9, 1.9         ∼6
 SC 1329–313        13 31 30, -31 44 00      GMRT             30_024     21-May-16        607        33      7         6.3×3.2, 0          ∼50
                                             GMRT             30_024     22-May-16        233        33      7       24.4×10.7, 26        ∼500
                    13 31 08, -31 40 23     MeerKAT             (d)       06-Jul-18      1283       856      8        7.3×7.2, 84.1        ∼6
 A 3562             13 33 35, -31 40 30     MeerKAT           AO 1 (e)    07-Jul-19      1283       856     10       6.9×6.5, 151.8        ∼6

Notes: (a) and (b) refer to the central frequency and total bandwidth respectively. (c) The pointing is part of the MeerKAT scientific
commissioning. (d) The pointing is part of the MeerKAT Galaxy Clusters Legacy Survey. (e) Observations obtained by the authors
in response to the January 2019 MeerKAT Announcement of Opportunity.

cover a frequency range between 230 MHz to 1.65 GHz. The                transform and with robust imaging weights to suppress the side-
details of our observations and final images are reported in Ta-        lobes of the point spread function. The deconvolution process
ble 2. A description of the observational setup, calibration, imag-     used the clean algorithm and included two Taylor terms to model
ing and mosaicing for each dataset is provided in the follow-           the spectral variation of sources and several Gaussian scales to
ing subsections, together with details on the data analysis of the      model the structure of extended sources. Calibration and imag-
XMM-Newton observations used in the discussion.                         ing were carried out separately for each beam, including one
                                                                        round of phase-only self-calibration, after which the images
                                                                        were combined with a linear mosaic to produce the final im-
3.1. ASKAP                                                              age. A comparison between mosaics generated using simple 2d
The core of the Shapley Supercluster was observed with ASKAP Gaussian beam models versus newer holography beam models
as part of the EMU Early Science programme (Norris et al. 2011; using a large number of bright sources allows us to state that the
Johnston et al. 2008) ESP 20. The observations (Table 2) were residual amplitude calibration errors are on the order of 5%.
carried out on 19 March 2019 (scheduling block 8140) with 35                 The centre of our final mosaic, which is shown in Fig. 2,
out of the 36 antennas in the array. The antenna configuration is RAJ2000 = 13 25 50 , DECJ2000 = −31 03 05 . The black
                                                                                          h   m   s                  ◦    0  00

provides a baseline coverage that ranges from ∼22 m to ∼6.4 km.         contours  in the image   show  the galaxy number    density of the
For this set of observations, the ASKAP correlator was used in supercluster members (Haines et al. 2018). The field of view of
pseudo-continuum mode to provide 288 channels, each with 1 the ASKAP image covers most of the supercluster, as is clear
                                                                                                                       00       00
MHz bandwidth, centred on 887 MHz. The telescope was con- from Fig. 1. The angular resolution is 13.2 × 10.4 and the
figured to produce 36 electronically formed beams arranged on noise level is in the range 30–50 µJy beam . As seen in Fig. 2,
                                                                                                                    −1

the sky in a 6×6 square grid; each individual beam covers an the overall quality of the image is affected by the presence of
area of ∼1 deg2 , giving a total instantaneous field of view of ∼ the strong and extended radio galaxy PKS 1333–33 (Killeen &
31 deg2 (Hotan et al. 2021).                                            Bicknell 1988; Condon et al. 2021) located at the south–eastern
At the beginning of each observation, the source B1934–638 edge of the field of view. Moreover, artefacts in the shape of
was observed for 3 minutes at the centre of each beam to cal- ripples in the north–south direction are also present.
ibrate the delay, phase, bandpass, and flux-density, based on the            The goals of our ASKAP Early Science Project are multi-
model from Reynolds (Reynolds 1994). The data reduction was fold. In this paper, we focus on the diffuse and extended emis-
performed using the ASKAPsoft software package and associ- sion associated with both the ICM and individual galaxies in the
ated processing pipelines2 . Images were produced using the w- region between A 3562 and SC1329–313 (zoomed in the upper
projection algorithm to account for the w-term in the Fourier panel of Fig. 3) and in A 3558 (upper panel of Fig. 4). A de-
                                                                        tailed analysis of the radio galaxy population and the role of the
 2
                                                                        environment by means of the ShaSS dataset is in preparation.
   https://www.atnf.csiro.au/computing/software/askapsoft/sdp/docs/current/

                                                                                                                       Article number, page 3 of 22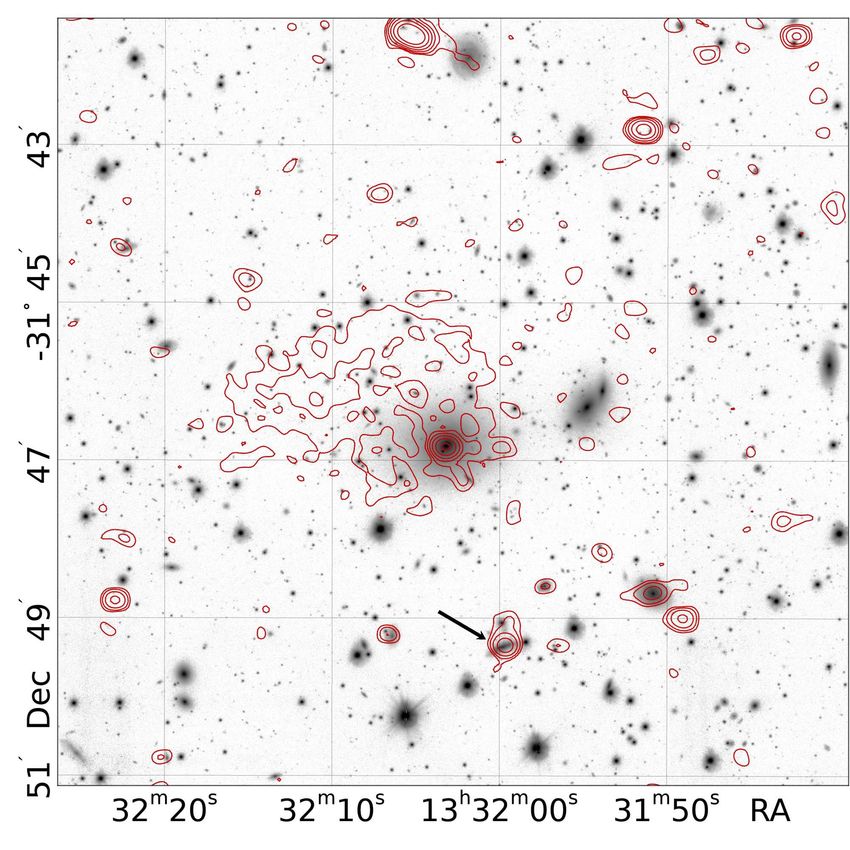
A&A proofs: manuscript no. Venturi

Fig. 2. Grey-scale view of the full field imaged by ASKAP at 887 MHz. The restoring beam is 13.200 × 10.400 , p.a. 85.4◦ . The noise level ranges
between 30 and 50 µJy beam−1 across the field. The radio galaxy PKS 1333–33 is clearly visible in the bottom–left part of the field. The black
contours show the number density of the galaxies at the redshift of the Shapley Supercluster. The contours correspond to 5, 10, 20, 40, 80, 160
gal/Mpc2 (Haines et al. 2018). The region under study in this paper, going from A 3562 to the central part of A 3558 (east to west) is highlighted
in the red rectangle. The green and purple circles show the GMRT pointings of the observations 22_039 and 30_024 respectively, and the full area
covered by the primary beam.

3.2. MeerKAT                                                              imaged using the WSCLEAN package (Offringa et al. 2014).
                                                                          We used Briggs weighting, robust = 0. We employed the joined-
The MeerKAT observations come from various projects, as clar-             channel deconvolution and (4th order) polynomial fitting options
ified in the notes to Table 2. Our observations on A 3562, car-           of WSCLEAN and made wideband images. We imaged an area
ried out in July 2019 (see Table 2), were complemented with ob-           of ≈ 2◦.2 × 2◦.2. This was followed by a round of phase and de-
servations centered on SC1329–313 and A 3558 as part of the               lay self-calibration using the CubiCal5 package (Kenyon et al.
MeerKAT Galaxy Cluster Legacy Survey (MGCLS, Knowles                      2018).
et al. 2021) and of the MeerKAT scientific commissioning.
                                                                              The data reduction of the pointings belonging to the MG-
     The July 2019 observatons were reduced as follows. We
                                                                          CLS has been described in detail in Knowles et al. (2021).
used the CARACal pipeline3 (Józsa et al. 2020a,b) for the ini-
                                                                          The available products include in-band spectral index informa-
tial data reduction. CARACal orchestrates standard reduction
                                                                          tion α1656  MHz            0
                                                                                 908 MHz within 36 from the pointing centres, and band-
packages into a single workflow. In this instance, it combined
                                                                          averaged Stokes I, Q, U, and V images.
the Tricolour4 flagger (Hugo 2021) for RFI flagging, and stan-
                                                                          To double-check the consistency with the data analysis, the orig-
dard CASA tasks for reference calibration. The Perley & Butler
                                                                          inal u − v data of the MGCLS pointings were passed through the
(Perley & Butler 2013) scale was used to set the flux density
                                                                          pipeline developed by SARAO, with comparable results. Both
scale of B1934−638. Whereas for the other standard MeerKAT
                                                                          approaches produce images of extremely high quality, with rms
flux density calibration source, PKS 0408−65, we used a custom
                                                                          values very close to the thermal noise, rms ∼ 6 µJy beam−1 at full
component-based field model provided in CARACal, converted
                                                                          resolution (see Table 2). To enhance the low-surface brightness
into model visibilities via the MeqTrees package (Noordam &
                                                                          emission in the field, we produced MGCLS images convolved to
Smirnov 2010). After applying all the reference calibrations, the
                                                                          a resolution of 1500 . The average noise at this lower resolution is
data were averaged from the initial 4096 to 1024 channels, and
                                                                          in the range ∼ 15-30 µJy beam−1 . The average residual ampli-
3
    https://github.com/caracal-pipeline/caracal
4                                                                          5
    https://github.com/ska-sa/tricolour                                        https://github.com/ratt-ru/cubical

Article number, page 4 of 22
T. Venturi: Radio footprints of a minor merger

                                                                                               55:00.0 50:00.0 45:00.0-31:40:00.035:00.0
                                       Declination

                                                                                                                                                     500 kpc

                                                                                                                                           34:00.0         30.0       33:00.0        30.0        32:00.0          30.0        31:00.0      30.0        13:30:00.0

                                                                                                                                                                                         Right ascension
                                                     55:00.0 50:00.0 45:00.0 -31:40:00.035:00.0 30:00.0

                                                                                                                                                      500 kpc
                                                                                                                                                                                               Arc

                                                                                                                                           A3562 radio halo

                                                                                                                                                                                                                                           Head-tail
                              Declination

                                                                                                                                                Filament
                                                                                                                                                                                                                                              Broken tail
                                                                                                                                                                            Bridge
                                                                                                                                                                                                                                               Bar

                                                                                                                                                                                   J1332-3146b          SOS 61086

                                                                                                                                                                                                                     Southern emission

                                                                                                                                            34:00.0           30.0     33:00.0       30.0            32:00.0        30.0      31:00.0      30.0        13:30:00.0

                                                                                                                                                                                        Right ascension
                                                                                30:00.0
                                                                                -31:40:00.0
                                   Declination

                                                                                50:00.0

                                                                                                                                                        500 kpc

                                                                                                                                              34:00.0          30.0      33:00.0        30.0         13:32:00.0       30.0       31:00.0    30:30.0

                                                                                                                                                                                            Right ascension

Fig. 3. Colour scale of the 887 MHz ASKAP image zoomed into the area encompassing A 3562 and SC 1329–313 (upper panel). Restoring beam
and noise level are as in Fig. 2. Central panel shows the 1.28 GHz MeerKAT image of the same region. The restoring beam is 6.900 × 6.500 , p.a.
151.8◦ . The average noise level is ∼ 6 µJy beam−1 . The flux density colour scale is in the range -0.1–0.7 mJy. The labels highlight the features
presented in this paper. Bottom panel shows the colour scale of the 1.28 GHz MeerKAT filtered image of the same region, convolved with a beam
of 4000 × 4000 (see Sect. 3.2), with contours (dashed red for negative) of the same image overlaid. The contours are plotted at ±0.1, 0.2, 0.4, 0.8
mJy beam−1 , the average noise level is ∼ 30 µJy beam−1 .

tude calibration errors are of the order of 5% for all MeerKAT                                                                                                                                           We finally produced images at the resolution of 4000 ×4000 af-
datasets.                                                                                                                                                                                            ter removing the contribution of the individual sources. We fol-
                                                                                                                                                                                                     lowed two different approaches. We adopted both (1) the filtering

                                                                                                                                                                                                                                                                    Article number, page 5 of 22
A&A proofs: manuscript no. Venturi

method described in Rudnick (2002) and (2) the subtraction of           at 607 MHz and 500 µJy beam−1 at 233 MHz. The residual am-
individual galaxies from the u − v plane with further convolu-          plitude calibration errors in the GMRT datasets are ∼5% at 607
tion of the residual emission (Venturi et al. 2007). The result-        MHz, ∼ 8% at 306 MHz, and ∼ 10% at 233 MHz.
ing images are consistent in the morphological details, but differ      Finally, primary beam correction was applied to all datasets with
slightly in the flux densities integrated over large areas, the first   the task PBCOR in AIPS, following the GMRT guidelines6 . The
method providing slightly higher values. Considering the very           full resolution of the final images are 14.000 × 9.500 at 306 MHz,
different approach of the two methods, we assume a conserva-            6.300 × 3.200 at 607 MHz and 24.400 × 10.700 at 233 MHz. The
tive flux density uncertainty on the order of 20%. The images           primary beam corrected images are shown in the appendix. Our
presented in this paper are those obtained with the filtering tech-     datasets are sensitive to large angular scale emission, ranging
nique.                                                                  from 170 to 440 .
    Our MeerKAT images of the region between A 3562 and
SC 1329–313 are shown in the central and lower panel of Fig. 3.
The emission at the centre of A 3558 is shown in the lower panel        3.4. XMM-Newton observations
of Fig. 4.                                                              The sky area that covers the four constituents of the central
                                                                        region of the Shapley Supercluster, namely: A 3558, A 3562,
3.3. GMRT                                                               SC 1327–312, SC 1329–313, and their connecting bridges, has
                                                                        been targeted by 11 observations performed with the three Eu-
The GMRT observations of project 22_039 were pointed on                 ropean Photon Imaging Cameras (EPIC). For more information,
A 3558 (see Table 2) and carried out at 306 MHz and 608 MHz,            see Table 3.
with a bandwidth ∆ν=32 MHz and 256 channels at both frequen-
cies. The LL and RR polarisation were recorded in both bands.           Table 3. Logs of the EPIC XMM-Newton observations
The source 1311–222 was used as phase calibrator for both ob-
servations, while 3C 286 was used as primary and bandpass cal-              OBS-ID          RA            DEC            Field name
ibrator. A standard data reduction approach was carried out. In                             deg           deg
particular, a-priori calibration, initial flagging, and RFI excision        0105261301      203.26196     –31.665306     A 3562_f1
were performed using flagcal (Chengalur 2013). Further edit-                0105261401      202.96821     –31.827528     A 3562_f2
ing, data averaging, and self-calibration were carried out us-              0105261501      203.50542     –31.534639     A 3562_f3
ing the NRAO Astronomical Image Processing System (AIPS).                   0105261601      203.13067     –31.652139     A 3562_f4
Direction-dependent calibration was successfully carried out at             0105261701      203.20183     –31.841722     A 3562_f5
306 MHz using the task PEELR in AIPS; however, this did not                 0105261801      203.57763     –31.711694     A 3562_f6
improve the quality of the 608 MHz image, since most of the                 0107260101      201.97975     –31.479778     A 3558
strong sources in the field are resolved at the resolution of our           0601980101      202.31887     –31.711917     SC1327-312a
observations. The final images, covering the full field of the pri-         0601980301      202.38137     –31.477667     SC1327-312b
mary beam, were produced over a range of angular resolutions,               0651590101      202.65967     –31.749444     SC1329-313
using different weighting schemes (Briggs parameters robust=0               0651590201      202.38604     –31.612500     SC1329-312
and robust=+2) to highlight the details of the more compact fea-
tures as well as the extended emission in the field. The final im-
ages have rms values in the range 60–100 µJy beam−1 at 306
MHz and 608 MHz, respectively.                                              The surface brightness and temperature map and profiles pre-
     The region of the SC1329–313 group was observed with the           sented in this paper (Sects. 4 and 5) have been obtained from the
GMRT on May 20 and 21, 2016 (project 30_024) for 2.3 hours              merging of these data sets into a composite event-list.
at 607 MHz and 5.6 hours at 233 MHz. Both RR and LL po-                     We sampled this event-list at an angular resolution of 6.500
larisations were recorded. The source 3C 286 was observed at            and an energy dependent spectral resolution in the range of 15-
the beginning of each observation as a bandpass and absolute            190 eV. We associated a background noise model to the result-
flux density calibrator. The source 1311–222 was observed as            ing event cube and an effective area that follow the same an-
a phase calibrator. All data were collected in spectral–line ob-        gular and spectral sampling. The background noise model in-
serving mode using the GMRT software correlator. A bandwidth            cludes sky (Cosmic X-ray Background, two component Galactic
of 33.3 MHz, 512 frequency channels, and a 4 second inte-               Transabsorption Emission, see Kuntz & Snowden (2000) and in-
gration time were used at 610 MHz. At 235 MHz, the band-                strumental (soft proton and particle induced) components whose
width was 16.7 MHz, divided in 256 channels, and the inte-              spatial and spectral templates have been jointly normalised with
gration time was set to 8 seconds. We used the Source Peeling           the hot gas emission outside the brightest regions of the Shap-
and Atmospheric Modeling (SPAM, Intema et al. 2009) pipeline            ley Supercluster core (SSC). Spectral analyses assume a hot
to reduce the data using a standard calibration scheme con-             gas emission that follows the Astrophysical Plasma Emission
sisting of bandpass and gain calibration and subsequent cycles          Code (APEC, Smith et al. 2001) and an X-ray absorption cal-
of direction-independent self-calibration, followed by direction-       ibration using an average Galactic neutral hydrogen density col-
dependent self-calibration. The flux density scale was set using        umn of NHI = 3.771020 cm−2 , which we extracted in the SSC
3C286 and the (Scaife & Heald 2012). For the imaging, the final         area from a map of the 21 cm emission released by the Lei-
self-calibrated visibilities were first converted into a measure-       den/Argentine/Bonn Galactic HI survey (Kalberla et al. 2005).
ment set using the Common Astronomy Software Applications                   The surface brightness was obtained with a wavelet analysis
(CASA, version 5.6.0) and then imaged using WSClean 2.8. We             of photon images that we corrected for spatial variations of the
used the auto-masking and multi-scale algorithms (Offringa &            effective area and background model. Photon images have been
Smirnov 2017) and different values of the Briggs robustness pa-         denoised via the 4-σ soft-thresholding of variance-stabilised
rameter (Briggs Briggs 1995), from −0.5 to +0.5, and uv tapers.
The noise in the final images is of the order of 50 µJy beam−1          6
                                                                            www.ncra.tifr.res.in:8081/∼ngk/primarybeam/beam.html

Article number, page 6 of 22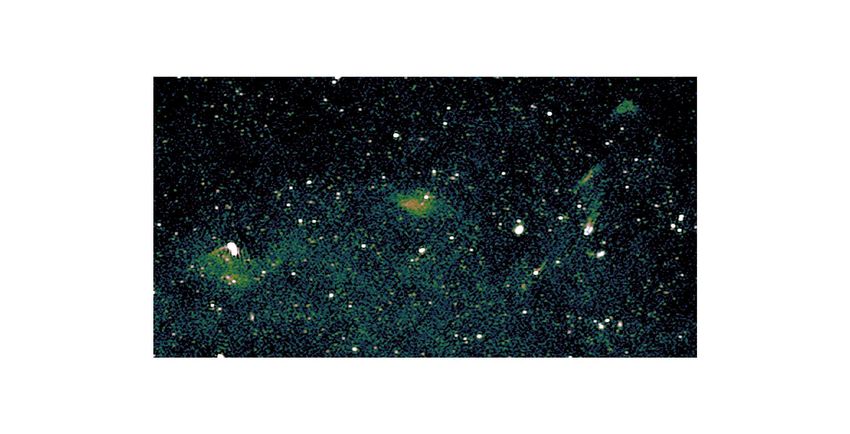
T. Venturi: Radio footprints of a minor merger

wavelet transforms (Zhang et al. 2008; Starck et al. 2009), which
are especially suited to processing low photon counts. The image
analyses include the inpainting of detected point-sources and the
spatial adaptation of wavelet coefficient thresholds to the spatial
variations of the effective area.
    We computed the temperature map of the whole field using
a spectral-imaging algorithm that combines likelihood estimates
of the projected hot gas temperature with a B2-spline wavelet
analysis. As detailed in Bourdin & Mazzotta (2008) temperature
log-likelihoods are first computed from spectral analyses per-
formed within square bins of various angular resolutions, then
convolved with analysis kernels that allows us to derive B2-
spline wavelet coefficients and their expected fluctuation. We
used such coefficients to derive a wavelet transform that typi-
cally analyse projected temperature features of apparent size in
the range of [0.2,2] arcmin, and we reconstructed a de-noised
temperature map from a 3-σ thresholding of the wavelet coeffi-
cients.

4. Radio images and spectral analysis
Figures 3 and 4 clearly show that the central region of the Shap-
ley Supercluster is characterised by several features of diffuse
radio emission. Moreover, Fig. 5 shows the diffuse emission in
the region between A 3562 and SC1329–313 with the thermal
emission detected by XMM-Newton overlaid in contours.
    Going from east to west we identify (see the labels in the
central panel of Fig. 3):
(a) the well-known radio halo in A 3562 (V03 and G05);
(b) diffuse emission of very low surface brightness, labelled as
     ’arc’ and ‘bridge’, detected here for the first time, which con-
     nects the radio halo in A 3562 and the radio source J 1332–
     3146a in SC 1329–313;
(c) the diffuse radio emission J 1332–3146a, first imaged in G05;
(d) a resolved tailed emission just south of J 1332–3146a (galaxy
     SOS 61086) first imaged here;
(e) the head-tail first noticed in V17;
 (f) a faint extended emission just south of the head-tail, labelled
     as ’bar’;
(g) a diffuse patch of emission 17500 across, of unknown origin,
     labelled as ‘Southern emisson’;
(h) faint diffuse emission at the centre of A 3558, detected for
     the first time (Fig. 4).
    We will describe all these features and provide their obser-
vational parameters in the next subsections. Their origin will be       Fig. 4. Radio halo in A 3558. In both panels the magenta cross shows
discussed in Sect. 5.                                                   the position of the brightest cluster galaxy (BCG). Upper panel: ASKAP
                                                                        image at 887 MHz in colour (same resolution and rms as in the upper
                                                                        panel of Fig. 3). The black contours show the emission of the halo after
4.1. Radio halo in A 3562                                               subtraction of the embedded point sources (see Sect. 4.7). The resolu-
                                                                        tions is 25.100 × 20.900 , in p.a. 131.5◦ and the rms is ∼35 µJy√beam−1 .
The radio halo in A 3562 was first imaged with the VLA at 1.4           Contour levels start at ±0.15 mJy beam−1 and are spaced by 2 (neg-
GHz in V03 and further studied at several radio frequencies and         ative contours in green). Lower panel: MeerKAT image at 1.283 GHz
in the X–ray band in G05. With a 1.4 GHz power of 1.14×10²³             in colour (same resolution and rms as in the central panel of Fig. 3).
W Hz−1 , it is a relatively low-power radio halo, which well            The black contours show the emission after subtraction of the point
fits the radio power–cluster mass correlation for galaxy clus-          sources (see Sect. 4.7) convolved with a restoring beam of 40.900 ×40.400 ,
ters (Cassano et al. 2013). V03 and G05 reported a spectral in-         in p.a. 144.6◦ . The rms is ∼35 µJy beam  √
                                                                                                                       −1
                                                                                                                          . Contour levels start at
                                                                                           −1
dex of the order of α1400
                       843 MHz ∼ –2. This value of α is consider-
                            MHz                                         ±0.125 mJy beam and are spaced by 2 (negative contours in green).
ably steeper than usually found, that is, [–1.4,–1.2], placing this
among the ultra-steep spectrum radio halos, first identified as a
particular class of radio halos a few years later in (Brunetti et al.   J 1332–3146a in SC 1329–313 (see Sect. 4.3). Its most notice-
2008).                                                                  able new feature is the bright ridge of emission, labelled ‘fila-
     Our MeerKAT and ASKAP images (Fig. 3) show that this               ment’ (see Fig. 3, central panel), delimiting the south–eastern
radio halo extends further westwards towards the radio source           edge. Moreover, radio emission is clearly detected for the first
                                                                                                                    Article number, page 7 of 22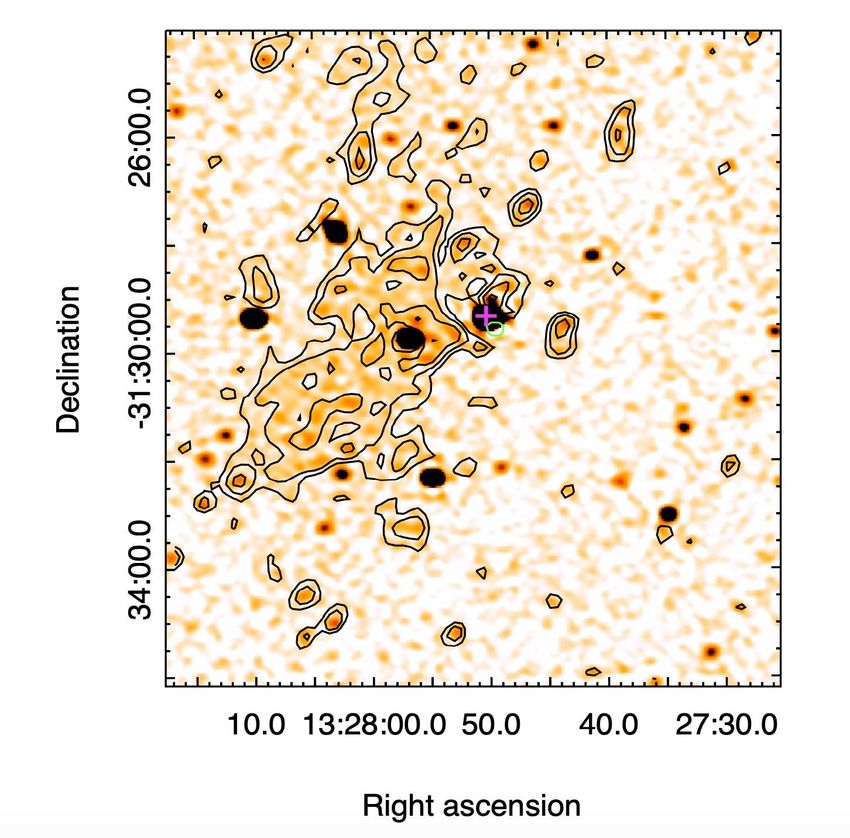
A&A proofs: manuscript no. Venturi

Fig. 5. MeerKAT 1.283 GHz colour scale of the diffuse emission (same field as Fig. 3). The restoring beam is 4000 × 4000 . The contours of the
XMM-Newton surface brightness (see Sect. 3.4) are overlaid in white and are spaced by a factor of 2.

time with MeerKAT south of this filament. The surface bright-
ness of the radio halo is of the order of 0.5 µJy/arcsec2 and drops
to 0.23 µJy/arcsec2 in the newly detected region south of the fil-
ament. A more detailed analysis of this feature and a revised
discussion of the origin of this radio halo will be presented in
a separate paper (Giacintucci et al. in prep.). Here, in Table
4, we report the flux density measurements of the radio halo,
including the new ones, after removal of the embedded point
sources. The updated radio spectrum is shown in Fig. 6. The
MeerKAT and ASKAP flux density values were obtained inte-
grating over the same area imaged in V03 and G05 for a consis-
tent comparison. The new values perfectly align with the previ-
ous measurements and suggest that the spectral index has a value
α1283
  332 MHz = −1.5 ± 0.2. The last two datapoints suggest a con-
       MHz

sistent steepening above 1283 MHz (Giacintucci et al. in prep.),
in agreement with our earlier work.
     The discovery of the ultra–steep spectrum radio halo in the
massive cluster A 521 (Brunetti et al. 2008) led to the detec-
tion of a number of radio halos with ultra–steep spectrum (see
van Weeren et al. 2019, and references therein). It is nowadays
thought that such sources are related either to merger events in-
volving clusters of small mass (M ∼   < 6 ×10¹⁴ M ) or to off–axis

mergers (Cassano et al. 2012). Both the masses of A 3562 and            Fig. 6. Radio spectrum of the A 3562 radio halo, obtained using the data
                                                                        in Table 4. Filled circles show the data published in V03 and G05, open
SC 1319–313 (see Table 1) and the X–ray properties of this re-          squares are the new ASKAP and MeerKAT data presented here.
gion are consistent with the presence of an ultra–steep spectrum
of the radio halo in A 3562.
                                                                        morphological details of this feature and the X-ray emission as
4.2. Diffuse radio emission connecting A 3562 and the group             imaged by XMM-Newton.
     SC 1329–313                                                            The possible existence of a radio bridge connecting A 3562
                                                                        and the source J 1332–3146a in SC 1329–313 at 1.4 GHz was re-
The most striking result of our observations is the discovery           ported in G05, however, the sensitivity of those observations was
of extended, very low surface-brightness emission in the region         not good enough for a robust claim. Similarly, the GMRT obser-
connecting A 3562 and SC 1329–313, as highlighted in the bot-           vations presented here are not adequate to reveal this feature, due
tom panels of Fig. 3 and in Fig. 5. It is the first time that diffuse   to the pointing centres and limited sensitivity. Our MeerKAT im-
emission between a cluster and a group is detected at GHz fre-          ages now clearly detect the radio bridge, which extends from the
quencies. Figure 5 shows a remarkable correlation between the           western end of the radio halo in A 3562 (labelled ’filament’ in
Article number, page 8 of 22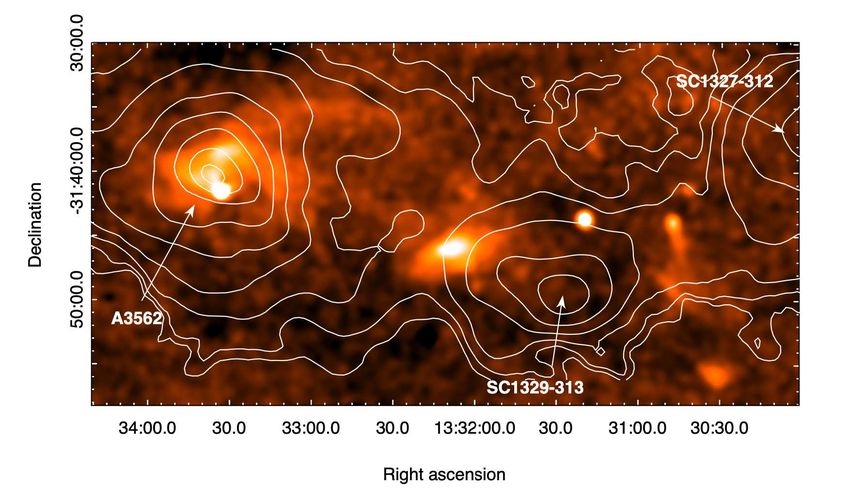
T. Venturi: Radio footprints of a minor merger

Table 4. Flux density values of the radio halo in A 3562                 ated with a bright early-type galaxy of magnitude7 r = 13.56
                                                                         with redshift z=0.04351, belonging to SC 1329–313 (Haines
              ν        Array         Flux          Ref                   et al. 2018). The galaxy (RAJ2000 = 13h 32m 03.17 s , DECJ2000 =
            MHz                      mJy                                 −31◦ 460 48.500 ) is located along the axis connecting the peaks of
            1400       VLA          20± 2        G05                     the X–ray emission in A 3562 and SC 1329–313 (see Fig. 5 and
            1283     MeerKAT        26± 2      This work                 Fig. 9 in G05).
             887     ASKAP          48± 5      This work                      We used all the datasets presented here to derive the inte-
             610      GMRT          90± 9        G05                     grated spectrum, and complemented them with the information
             332      GMRT         195±39        G05                     published in G05. Table 5 reports the total flux density measure-
             240      GMRT         220±33        G05                     ments (after removal of the compact emission associated with
                                                                         the galaxy) and the spectrum is shown in the left panel of Fig.
                                                                         8. The flux density measurements of J 1332–3146a are consid-
                                                                         erably scattered. The sensitivity of the GMRT 233 MHz obser-
                                                                         vations presented in this paper is too low to detect this source.
Fig. 9 in G05) to the eastern extension of J 1332–3146a, cover-          The 306 MHz flux density value does not align with the data
ing a distance of ∼1 Mpc in projection. Moreover, we detect an           points at higher frequencies and it is not consistent with our pre-
arc-like feature which connects A 3562 and SC 1329–313 from              vious measurement either. The reason for this discrepancy is un-
the north. The arc is very well imaged with MeerKAT, while it            clear. Since the radio source is located at the very edge of the
is less prominent in the ASKAP image, due to the presence of             GMRT field of view at this frequency, the local noise is higher
residual ripples (see Sect. 3.1 and Figs. 2 and 3).                      and as a consequence the uncertainty on the total flux density
     We integrated the flux density of this emission over the image      is larger than that of the other diffuse sources presented here. If
presented in the bottom panel of Fig. 3 and in Fig. 5 after primary      we ignore this measurement, a linear fit to the data provides a
beam correction (and removing the contribution of the radio halo         value α1283
                                                                                 235 MHz = −0.76 ± 0.2. A considerable steepening above
                                                                                      MHz
in A 3562), and obtained S=61±6mJy for the total of the diffuse          1 GHz is suggested by the MeerKAT in-band spectral index im-
emission (including both the bridge and arc) filling the region          age shown in the right panel of Fig. 8 (derived from the 1500 ×1500
between A 3562 and J 1332–3146a, which corresponds to a radio            resolutions images of pointing (d) in SC 1329–313, see Table 2),
power P(1.283 GHz) = 3.22 × 10²³ W Hz−1 . The average surface            which covers the frequency range 908-1656 MHz.
brightness is ∼0.09 µJy/arcsec2 .                                        The distribution of the in-band spectral index8 strengthens the
     There is strong interest in finding bridges between clus-           idea that the compact radio source and the extended emission
ters; they are often not detected, despite high sensitivity (i.e.        are not connected. The former is flat (α ∼ –0.3 in Fig. 8 ), while
see the recent ASKAP search of the pre-merger cluster pair               the diffuse emission is considerably steeper, with α in the range
A 3391-A 3395; Brüggen et al. 2021). Successful detections of            [–2.3,–1] across the source. Comparison of the right panel of
bridges between cluster pairs have been made using LOFAR                 Figs. 6 and 7 further shows that the region of the diffuse emis-
at 144 MHz, such as the cluster pair A 1758N–A 1758S (Bot-               sion where the spectrum is flatter (pink) are those with embedded
teon et al. 2020a) and the system A 399–A 401 (Govoni et al.             compact sources, whose spectrum is less steep than the rest. The
2019). In addition, there is a well-known bridge connecting the          possible origin of this emission is discussed in Sect. 5.1.1.
Coma cluster with the NGC 4839 group, detected at 144 MHz
(Bonafede et al. 2021) and at 346 MHz (Kim et al. 1989). All             4.4. Radio tail of SOS 61086
these clusters are considerably more massive than A 3562 and
SC 1329–313, and the detections are well below the GHz fre-              We identify a tailed radio source south-west of J 1332–3146a
quencies.                                                                (Fig. 7, left panel, and Fig. 8, right panel), associated with a spi-
                                                                         ral galaxy member of SC 1329–3139 identified as SOS 61086
                                                                         in the Shapley Optical Survey (Mercurio et al. 2006; Haines
4.3. Radio source J 1332–3146a                                           et al. 2006). The galaxy has a redshift z = 0.04261 ± 0.00023
                                                                         (Vh = 12500 ± 70 km s−1 ) and is located at ∼280 kpc (∼ 0.3r200 )
The radio source J 1332–3146a was first imaged with the VLA
                                                                         in projection from the X-ray centre. Considering the median
at 1.4 GHz (G05). The source is located just east of the X–ray
                                                                         redshift of SC 1329–313, the line-of-sight peculiar velocity of
emission of SC 1329–313 (G05 and Fig. 5). The new ASKAP
                                                                         SOS 61086 with respect to the main group is −900 km s−1 . The
and MeerKAT images presented here are in very good agreement
with the previous ones, but the much better sensitivity and res-          7
                                                                             Corrected for Galactic extinction.
olution of the current observations provide new insights on the           8
                                                                             To fit the in-band spectral indices, we used a new spectral fitting code
morphology and surface brightness distribution of the emission.          (part of the PFB-Clean (https://github.com/ratt-ru/pfb-clean suite). This
The overall size of the source, 60 × 2.50 (∼ 335 × 140 kpc), con-        proceeds as follows. The per-subband (8, in this case) model and resid-
firms the previous measurement. Figs. 3 and 7 clearly show that          ual images produced by wsclean are reconvolved to a common resolu-
no jets or other features link the diffuse emission to the compact       tion. A power law is then fitted pixel-by-pixel (weighting the subbands
component, at least at the resolution of our images. We further          as per the “wsum“ FITS keyword generated by wsclean). The subband
see no evidence for a connection between the embedded strong             images are generated by the same run of wsclean as the MFS image, and
compact radio source and the extended emission in the spectral           use a weighting of robust=0 (without the “use MFS weighting” option
index distribution. The morphology of J 1332–3146a is not sym-           of wsclean in effect, so the weighting is truly robust=0 per subband).
metric with respect to the compact component but extends north           The primary beam is accounted for by directly incorporating attenua-
                                                                         tion by the average Stokes I beam into spectral index model during the
and east, with a 1283 MHz (MeerKAT) surface brightness in the
                                                                         fitting. We used the Eidos beam model (https://github.com/ratt-ru/eidos
range ∼0.14 - 0.75 µJy/arcsec2 .                                         Asad et al. (2021) in this particular instance).
    The embedded bright compact source is located at the south-           9
                                                                             The membership has been statistically assigned by means of the dy-
west end of the radio emission (Fig. 7, left panel) and is associ-       namical analysis in Haines et al. (2018).

                                                                                                                      Article number, page 9 of 22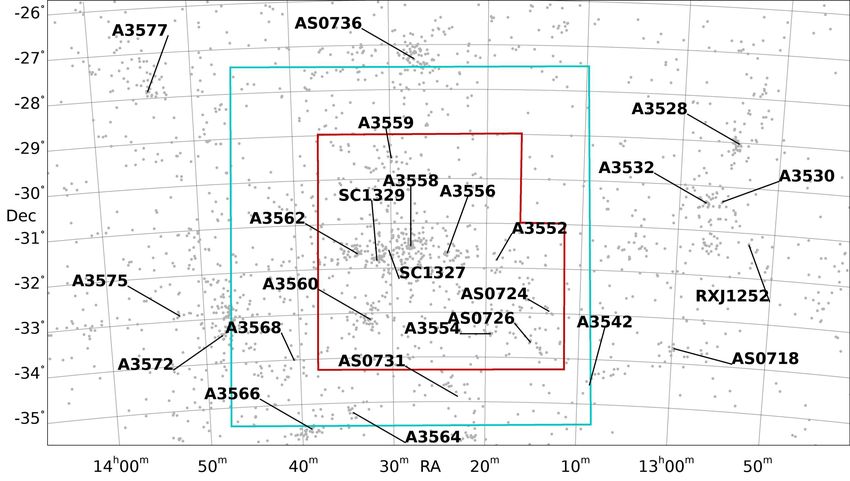
A&A proofs: manuscript no. Venturi
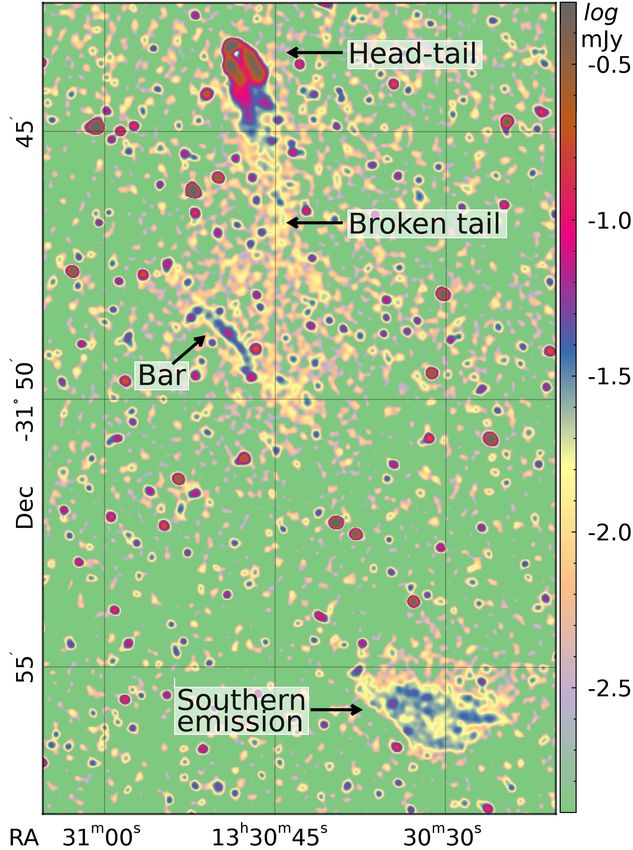
Fig. 7. Contours of the 887 MHz ASKAP image zoomed around J 1332–3146a superimposed on the VST r-band image (left panel). The restoring
beam is 13.200 × 10.400 , p.a. 85.4◦ . The first contour is drawn at 0.1 mJy beam−1 , and the contours are spaced by a factor of 2. SOS 61086, located
south of J 1332-3146a, is indicated by the black arrow. The first contour is drawn at ∼3σ. Colour scale of the 1.283 GHz MeerKAT image (same
as central and bottom panel of Fig. 3), reported to emphasise the structure of the radio emission (right panel).
Fig. 8. Radio spectrum of the radio source J1332–3146a, obtained using the data in Table 5 (left panel). Filled dots are from G05, open squares are
from the present paper. The fit does not include the 306 MHz measurement (see Sect. 4.3). In-band MeerKAT spectral image at the resolution of
1500 × 1500 (right panel). The radio contours are from the full resolution image, i.e. 7.300 × 7.200 , and are drawn at ±20, 40, 80, and 160 µJy beam−1 .
A zoom of the radio source associated with SOS 61086 is shown in the inset.
Table 5. Flux density values of J1332-3146a. radio source was detected at 1.4 GHz in Giacintucci et al. (2004)
and labelled J 1331–3149b; it was classified as unresolved at the
ν Array Flux Ref resolution and sensitivity of those observations.
MHz mJy
The r-band image of the galaxy from the ShaSS (Merluzzi
1400 VLA 16±1 G05 et al. 2015) is shown in Fig. 9 (left panel) superimposed with
1283 MeerKAT 18± 2 This work the contours of the 1.28 GHz MeerKAT image. Because of the
887 ASKAP 28± 2 This work hints of matter beyond the galaxy stellar disk in the northerly di-
610 GMRT 28±3 G05 rection, the object has been investigated in detail with observa-
607(a) GMRT 32± 2 This work tions carried out with the Wide-Field Spectrograph (Dopita et al.
306(b) GMRT 152±39 This work 2007, 2010) mounted at the Nasmyth focus of the Australian Na-
330 GMRT 56±6 G05 tional University 2.3m telescope located at Siding Spring Obser-
235 GMRT 89±10 G05 vatory (Australia), complemented by N-body/hydrodynamical
simulations (for the full analysis see Merluzzi et al. 2016).
Notes: (a) Project 30_024 and (b) Project 22_039 in Table 2. This study demonstrated that the galaxy of stellar mass M? ∼
4 × 10⁹ M is undergoing ram-pressure stripping (RPS) and sug-
gested that the time of the onset (‘age’) of RPS is about 250 Myr
ago. Furthermore, the onset epoch estimate agrees with the age
Article number, page 10 of 22T. Venturi: Radio footprints of a minor merger
of the young stellar population (< 200 Myr), suggesting that we The spectra of the various features are shown in the left and
are very likely observing ram-pressure-induced star formation. right panels of Fig. 11. The spectrum shown in the left panel
The new high-quality and deep MeerKAT observations re- includes both the core and the inner part of the head-tail, corre-
veal the radio tail, shown in the left panel of Fig. 9. The ra- sponding to the red area in the left panel of Fig. 10. The irreg-
dio continuum emission peaks at the galaxy centre, and extends ular trend is most likely the result of the different components
north at comparable brightness levels up to 30 kpc in projection in the core and jets, which are difficult to disentangle. Overall
from the galaxy disk. The other striking feature of the radio con- this region shows an approximately flat spectrum. The situation
tinuum emission is its confinement to the inner part of the disk is completely different in the broken tail and in the bar. Both fea-
which recalls the truncation of the gas disk in galaxies affected tures are steep, and a linear fit provides α1283
306 MHz = −1.0 ± 0.1
MHz
by RPS. in the broken tail, and α306 MHz = −1.95 ± 0.05.
1283 MHz
We used our images to derive the spectrum of the radio emis- The spectral index values of the various features are con-
sion associated with the galaxy disk and that of the tail, which are firmed by the MeerKAT spectral index image shown in the left
shown in the right panel of Fig. 9. The spectrum of the tail (com- panel of Fig. 12 (derived from pointing (b) in SC 1329–313, see
puted using images at similar angular resolution) is considerably Table 2). The core of the head–tail has a spectral index α ∼ −0.5,
steeper than the emission from the galaxy and it is very well fit with a clear steepening along the jets, and the remarkable steep-
ness of the bar is confirmed, with α ∼ < –2.
by a power law with α1283
306 MHz = −0.79 ± 0.05. The flux density
MHz
values of the disk are more scattered, and this could be partly We used the pointing from the MGCLS (see Table 2) to
due to the different resolutions of the images. We further note search for polarisation information on the head-tail and the bar.
that the MeerKAT in-band spectral index of SOS 61086, shown Preliminary Q and U images from the MGCLS were constructed
in the inset of the right panel of Fig. 8, clearly shows a steepen- by summing the respective individual frequency channels and,
ing along the tail, up to α ∼ –2. Assuming that the spectrum of thus, they do not correct for any Faraday rotation, spectral in-
the tail steepens above ∼1.2 GHz, as suggested from the in-band dex, or depolarisation effects. The approximate fractional polar-
spectral index, we derive a magnetic field Heq =0.9 µG, and an isations are shown in the right panel of Fig. 12. With the above
upper limit to the radiative age of the relativistic electrons of ∼ caveats, the observed fractional polarisation is most prominent in
100 Myr (including the aging of the electrons due to scattering the eastern tail, and increases from of order 10% near the core to
with the CMB). Finally, Figs. 5 and 7 (right panel) suggest that an approximate level of 70%, which is the theoretical maximum,
a much fainter diffuse intercluster radio emission extends north for the bar. More precise results would require a full Faraday
of SOS 61086 to J1332–3146a, over an extent of ∼ 90 kpc. synthesis, which is beyond the scope of the current work.
4.5. Head–tail in SC 1329–313 4.6. Southern emission
The ASKAP and MeerKAT images in Fig. 3 show an intriguing This interesting feature is not obviously connected to any optical
emission west of J1332–3146a, at RA∼ 13h 30m 40 s . A zoom into source, as is clear from the central panel of Fig. 10. The surface
that area is given in Fig. 10. brightness is quite uniform and its spectrum, with α1283607 MHz =
MHz
The head–tail radio source is associated with a cluster galaxy −0.35 ± 0.12, is unusually flat for diffuse sources with no optical
located at RAJ2000 = 13h 30m 48.91 s , DECJ2000 = 31◦ 430 25.600 , counterpart. Fig. 5 shows that it is outside the region covered by
with z=0.044 and magnitude R=13.6 (from the NASA/IPAC Ex- the XMM-Newton observations.
tragalactic Database). However, a superimposed foreground star These properties challenge its classification within the cur-
makes the magnitude measurement unreliable. The galaxy and rent classes of extragalactic radio sources. Assuming that the
the star can be distinguished only in the VISTA K-band image source is located at the distance of the Shapley Supercluster, its
of ShaSS. The two jets of the tail bend sharply just outside the size is ∼ 167 × 83 kpc. The source is too faint to allow in-band
envelope of the optical galaxy, and lose their collimation at a spectral imaging.
distance of ∼40 kpc from the core, to form a feature of very We note that the brightest optical/infrared object co-located
low surface brightness emission, which we refer to as the broken with the southern emission is a giant star (WISEA J133029.79,
tail, extending ∼250 kpc southwards. At that location the mor- GAIA 6169476948, Stassun et al. 2019) with a high proper mo-
phology of the emission changes again, to take the shape of a tion (−4.72±0.05 mas year−1 in RA and −2.41±0.04 mas year−1
bar inclined at ∼ 30◦ with respect to the orientation of the bro- in Dec). At a distance of 3850±400 pc, this corresponds to a ve-
ken tail. The length of the bar is ∼250 kpc. Part of this emission locity of ∼100 km s−1 . If the flat-spectrum southern emission
was detected with the GMRT at 306 MHz (V17), however, the were associated with this star, it would have a size of ∼4×2.5 pc,
sensitivity of those observations did not allow for a clear mor- and a 1 GHz monochromatic luminosity of 6.4×10¹² W Hz−1 .
phological classification of the source. For comparison, this is 40 times the surface area and 10 times
Table 6 reports the flux density of all these components in our the luminosity of the optically thin free-free emission from the
datasets. At 1283 MHz, we considered the values derived from outer portion of the mass loss wind from P Cygni (Skinner et al.
the MGCLS (pointing (d) in Table 2) to avoid any possible un- 1998).
certainties in the primary beam correction at very large distance
from the pointing centre. At 607 MHz we reported the values at 4.7. Diffuse emission at the centre of A 3558
different resolutions to ensure the full detection of the extended
features. Only the inner part of the tail and the bar are detected A 3558 is located ∼2.8 Mpc west of SC 1329–313 and is the
at 233 MHz. One possibility is that the core is self-absorbed at most massive cluster in the Shapley Supercluster (Table 1). Its
frequencies below 306 MHz, while the broken tail and the south- size and overall dynamical state as derived from the X–ray prop-
ern emission most likely fall below the sensitivity limit of those erties (Rossetti et al. 2007) make it an ideal candidate to host
observations. All the remaining features are clearly detected in diffuse emission in the form of a radio halo, undetected prior to
all datasets. our observations.
Article number, page 11 of 22A&A proofs: manuscript no. Venturi
Fig. 9. ESO-VST r-band image of the field including SOS 61086 with 1.28 GHz MeerKAT radio contours superposed (left panel). The restoring
beam of the radio image is 6.900 × 6.500 , p.a. 151.8◦ . The contours are plotted at 20, 40, 60, 160 µJ beam−1 . The first contour is drawn at ∼ 3.5σ (the
local noise is ∼ 6 µJy beam−1 ). The scales (RA and DEC) give the distance (in arcsec) from the photometric centre of the galaxy. Spectrum of the
radio emission of SOS 61086 (right panel). Open and filled triangles are the emission from the galaxy and the tail, respectively.
Fig. 10. 1.283 GHz MeerKAT image of the head-tail in SC J1329–313 (left panel). The colour scale is in the range -1 - 0.1 mJy beam−1 . The
restoring beam of the image is 7.6600 × 7.2800 , in p.a. 68◦ . The various features of diffuse emission are indicated. Contours of the same image
overlaid on the ESO-VST r-band image (central panel). The contour levels are ±20, 40, 80, 160 µJy beam−1 . The first contour corresponds to
∼ 3σ. Right panel - 1.283 GHz MeerKAT image of the diffuse emission at the resolution of 4000 × 4000 in colour with GMRT contours at 306 MHz
overlaid. The contours are drawn at 0.2, 0.4, 0.8 mJy beam−1 . The angular resolution is 14.000 × 9.500 .
Diffuse emission was detected with both ASKAP and of 25.100 × 20.900 . This subtraction provided cleaner results in
MeerKAT. The ASKAP contours of the diffuse emission are this region than the compact source subtraction methods used
shown in the upper panel of Fig. 13 overlaid on the [0.5,2.5- earlier. Some residuals are present beyond the bulk of the dif-
keV] emission imaged by XMM-Newton. The lower panel shows fuse emission, however, it is difficult to say whether they are
the MeerKAT contours overlaid on the XMM-Newton pseudo- the result of incomplete source subtraction or an indication that
entropy map (see Sect. 5.1.3). The source subtraction in the the halo could be more extended. The MeerKAT emission was
ASKAP image was carried out using the task SAD in AIPS, imaged after subtraction of the individual radio sources in the
down to 0.3 mJy, and the residuals were convolved with a beam u − v plane, and the residuals were convolved to a resolution of
Article number, page 12 of 22T. Venturi: Radio footprints of a minor merger
Fig. 11. Spectra of the components in the head–tail radio galaxy. Left panel: Core region, encompassing the core and the inner tail (red area in the
left panel of Fig. 10). Right panel: Broken tail (black filled circles) and bar (red open circles).
Table 6. Flux density values of the head-tail and southern feature.
ν Array Resolution Core+ Inner tail Broken tail Bar Southern emission
00 00
MHz × mJy mJy mJy mJy
1283 MeerKAT 7.66×7.26 8.3±0.4 4.8±0.2 2.5±0.1 3.7±0.1
887 ASKAP 13.23×10.43 11.3±0.6 7.0±0.4 5.3±0.3 4.0±0.2
607(a) GMRT 9.73×5.55 11.5±0.6 9.5±0.5 10.3±0.5 -
607(a) GMRT 15×15 12.8±0.6 10.9±0.5 10.7±0.5 4.8±0.2
306(b) GMRT 14.05×9.53 17.6±1.4 42.3±3.4 42.2±3.4 -
233 GMRT 24.45×10.77 15.2±1.5 - 38.0±3.8 -
Notes: (a) Project 30_024 and (b) Project 22_039 in Table 2.
although they are pointed on the cluster centre, are not sensitive
enough to detect this very faint source.
The extent of the diffuse emission is consistent at 887 MHz
and at 1.28 GHz, that is, ∼ 400 × 200 kpc, and its major axis
points towards the small group SC 1327–312. The overall shape
and size of this structure are consistent with the brightest region
of X–ray emission as detected by XMM-Newton (Rossetti et al.
2007) – as discussed in Sect. 5.
We measure a flux density S887 MHz =30±3 mJy and
S1283 MHz =13±1 mJy, which lead to a very steep spec-
trum, α1283
887 MHz = –2.3±0.4. The surface brightness at 1.283
MHz
GHz is very low, that is, ∼0.1 µJy/arcesc2 . The corre-
sponding radio powers are P887 MHz =1.58×10²³ W Hz−1 and
P1283 MHz =6.85×10²² W Hz−1 .
5. Discussion
Fig. 12. MeerKAT 1-1.8 GHz in-band spectral image of the head-tail,
broken tail, and bar at the resolution of 1500 × 1500 (left panel). Contours The ongoing merging and accretion processes in the A 3558
are the same as in the central panel of Fig. 10. In the right panel we complex are supported by observational evidence over the full
show the same contours as in the left panel overlaid on the fractional spectrum, from the radio to the X–ray, however, their respective
polarisation shown in colour.
details are difficult to disentangle.
Thanks to the unprecedented quality of the radio images pre-
sented here, seamlessly covering the frequency range from 0.23
40.900 ×40.400 . Our 306 MHz and 608 MHz GMRT observations, to 1.65 GHz, with the MeerKAT images reaching µJy beam−1
Article number, page 13 of 22You can also read