RACE: A Teacher's Guide for Middle School
←
→
Page content transcription
If your browser does not render page correctly, please read the page content below
RACE:
            A Teacher’s Guide for Middle School

                                             Prepared By

                     Joseph Jones, Mary Margaret Overbey,
                     Alan Goodman, Carol Mukhopadhyay,
                       Yolanda Moses and Amy Beckrich

A Project of American Anthropological Association
Funded by Ford Foundation and National Science Foundation

© 2007 American Anthropological Association. All rights reserved.   1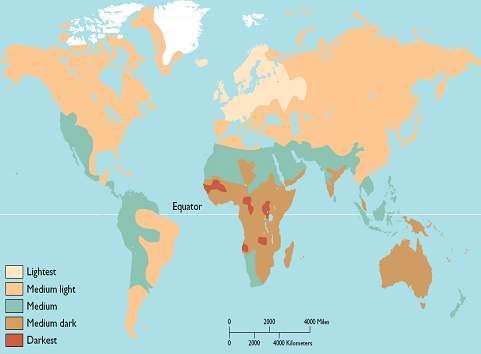
TABLE OF CONTENTS

INTRODUCTION .................................................................................................................................. 3

HOW TO USE THIS GUIDE................................................................................................................ 3
  National Science Education Standards.............................................................................................. 4
  Selected State Science Content Standards......................................................................................... 4
  National Social Studies Curriculum Standards ................................................................................. 6
  Selected State Social Studies Content Standards .............................................................................. 7

EXPLORING HUMAN BIOLOGICAL VARIATION...................................................................... 8
   Continuous Trait Variation ............................................................................................................. 11
   Graphing Independence .................................................................................................................. 15
   Apportioning Phenotypic and Genetic Variation ............................................................................ 25
   Gene Flow Illustration .................................................................................................................... 30

EXPLORING CULTURAL VARIATION ........................................................................................ 31
   Culture Shapes How We See the World.......................................................................................... 34
   Color Terms.................................................................................................................................... 40
   Classifying Relatives....................................................................................................................... 41
   Classifying in Other Cultures: A Cultural IQ Test! ....................................................................... 43
   Census Activity ............................................................................................................................... 45

EXPERIENCING RACE AND RACISM .......................................................................................... 48
   Experiencing Inequality.................................................................................................................. 51
   Whiteness Quiz ............................................................................................................................... 59
   Preference Activity ......................................................................................................................... 61

RESOURCES........................................................................................................................................ 64
   Glossary........................................................................................................................................... 64
   Bibliography of Selected Works ..................................................................................................... 67
   Web Sites......................................................................................................................................... 68

This material is based upon work supported by the National Science Foundation under Grant No. 0307843. Any opinions,
findings and conclusions or recommendations are those of the authors and do no necessarily reflect the views of the
National Science Foundation.

© 2007 American Anthropological Association. All rights reserved.                                                                                      2

INTRODUCTION

Welcome to the RACE Project, a public education effort designed to enhance understanding of race
and human variation. The RACE Project, developed by the American Anthropological Association
with funding from the Ford Foundation and the National Science Foundation, focuses on developing a
public education program that includes a traveling exhibit, public website and educational materials to
provide a variety of learning experiences for everyone. The program builds on the current science and
scholarship on race and human variation and we have a special interest in educational outreach to
middle school and high school students, their teachers and parents.

The RACE Project is the first national collaborative effort to present an integrated view of race and
human variation through biological, cultural and historical perspectives. The public education program
explains how human biological variation differs from race, when and why the idea of race was
invented, and how race and racism affect everyday life. The program has three primary messages. (1)
Race is a recent human invention. (2) The idea of race is about culture, not biology. (3) Race and
racism are embedded in our institutions and everyday life.

This teacher’s guide serves as a teaching tool to assist educators in addressing race and human
variation in the classroom. The guide meets national and select state standards for science and social
studies and teachers may use the various lesson plans to develop a module on race and human variation
for biology, social studies or social science classes. We encourage teachers to present the topic of race
and human variation in an integrated fashion as we have done in the guide.

                                 HOW TO USE THIS GUIDE
This teacher’s guide presents race and human variation through the integrated lenses of biology,
culture and history. The guide includes a series of lesson plans that fall within one of three broad topic
areas: (1) Exploring Human Biological Variation; (2) Exploring How Culture Shapes Race; and (3)
Experiencing Race and Racism in Everyday Life.

The lesson plans can be infused into existing curriculum for science, biology, social studies and social
science classes. Each lesson plan provides an overview, describes objectives, and outlines the time,
materials and procedure for conducting the lesson.

We encourage teachers to consider team teaching to develop and co-teach a module on race and human
variation that incorporates lesson plans in this guide. In middle school, this may involve developing a
team of science teachers and social studies teachers to put together a module of complementary
activities on race and human variation. In high school, the team may include biology teachers, history
teachers, and social science teachers in developing a module of complementary activities on race and
human variation.

© 2007 American Anthropological Association. All rights reserved.                                          3
RELATIONSHIP OF THE GUIDE TO NATIONAL AND STATE
                 STANDARDS OF LEARNING

RACE: A Teacher's Guide addresses national and state content standards for science and social studies
education.

                               National Science Education Standards
                     (National Research Council, 1996: http://www.nsta.org/standards)

GRADES 5-8
Content Standard A: Science as Inquiry
As a result of activities in grades 5-8, all students should develop
       • Understandings about scientific inquiry

Content Standard C: Life Science
As a result of their activities in grades 5-8, all students should develop understanding of
       • Diversity and adaptations of organisms

Content Standard G: History and Nature of Science
As a result of activities in grades 5-8, all students should develop understanding of
       • Science as a human endeavor
       • Nature of science
       • History of science

                             Selected State Science Content Standards
CALIFORNIA
http://www.cde.ca.gov/be/st/ss/scmain.asp

GRADE 7
Focus on Life Science
Genetics
   2. A typical cell of any organism contains genetic instructions that specify its traits. Those traits may be
       modified by environmental influences. As a basis for understanding this concept:
       c. Students know an inherited trait can be determined by one or more genes.
       d. Students know plant and animal cells contain many thousands of different genes and typically have
           two copies of every gene. The two copies (or alleles) of the gene may or may not be identical, and
           one may be dominant in determining the phenotype while the other is recessive.
       e. Students know DNA (deoxyribonucleic acid) is the genetic material of living organisms and is
           located in the chromosomes of each cell.

Evolution
   3. Biological evolution accounts for the diversity of species developed through gradual processes over
       many generations. As a basis for understanding this concept:
       a. Students know both genetic variation and environmental factors are causes of evolution and
          diversity of organisms.
© 2007 American Anthropological Association. All rights reserved.                                             4
MASSACHUSETTS
http://www.doe.mass.edu/frameworks/current.html

GRADES 6-8
Life Science (Biology)
Reproduction and Heredity
    6. Recognize that every organism requires a set of instructions that specifies its traits. These instructions
        are stored in the organism’s chromosomes. Heredity is the passage of these instructions from one
        generation to another.
    7. Recognize that hereditary information is contained in genes located in the chromosomes of each cell. A
        human cell contains about 30,000 different genes on 23 different chromosomes.

Evolution and Biodiversity
   10. Give examples of ways in which genetic variation and environmental factors are causes of evolution and
       the diversity of organisms.

Changes in Ecosystems over Time
   18. Recognize that biological evolution accounts for the diversity of species developed through gradual
       processes over many generations.

MINNESOTA
http://education.state.mn.us/mde/Academic_Excellence/Academic_Standards/Science/index.html

GRADES 5-8
Grade 5
Strand IV: Life Science
Substrand E: Biological Populations Change Over Time
The student will know that biological populations change over time.
        1. The student will recognize that individuals of the same species differ in their characteristics and that
        sometimes the differences give individuals an advantage in surviving and reproducing.
        2. The student will recognize that extinction of a species occurs when the environment changes and the
        adaptive characteristics of a species are insufficient to allow its survival.

Grade 6
Strand l: History and Nature of Science
Substrand B: Scientific Inquiry
The student will understand that science is a way of knowing about the world that is characterized by empirical
criteria, logical argument and skeptical review.
          2. The student will distinguish among observation, prediction and inference.

VIRGINIA
http://www.pen.k12.va.us/VDOE/Superintendent/Sols/home.shtml

Grade 6
Strand: Scientific Investigation, Reasoning, and Logic
Standard 6.1
© 2007 American Anthropological Association. All rights reserved.                                                 5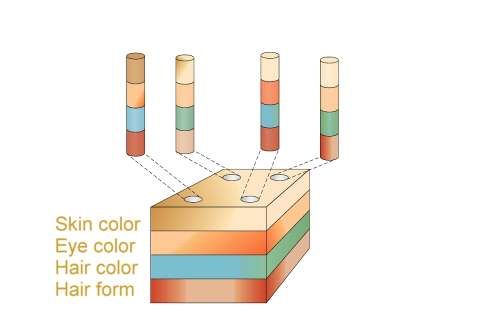
The student will plan and conduct investigations in which
   • a classification system is developed based on multiple attributes;
   • differences in descriptions and working definitions are made;
   • precise and approximate measures are recorded;
   • data are collected, recorded, analyzed, and reported using appropriate metric measurement; and
   • data are organized and communicated through graphical representation (graphs, charts, and diagrams)

Standard 6.2
The student will demonstrate scientific reasoning and logic. Key concepts include
   • ideas are investigated by asking for and actively seeking information;
   • alternative scientific explanations are analyzed; and
   • conclusions are based on scientific evidence obtained from a variety of sources.

                         National Social Studies Curriculum Standards
        (National Council for the Social Studies, 1994: http://www.socialstudies.org/standards/)

Thematic Strand 1: Culture
Social studies programs should include experiences that provide for the study of culture and cultural diversity.

Thematic Strand 2: Time, Continuity, and Change
Social studies programs should include experiences that provide for the study of the ways human beings view
themselves in and over time.

Thematic Strand 3: People, Places and Environment
Social studies programs should include experiences that provide for the study of people, places, and
environments.

Thematic Strand 4: Individual Development and Identity
Social studies programs should include experiences that provide for the study of individual development and
identity.

Thematic Strand 5: Individuals, Groups, and Institutions
Social studies programs should include experiences that provide for the study of interactions among individuals,
groups, and institutions.

Thematic Strand 6: Power, Authority, and Governance
Social studies programs should include experiences that provide for the study of how people create and change
structures of power, authority, and governance.

Thematic Strand 10: Civic Ideals and Practices
Social studies programs should include experiences that provide for the study of the ideals, principles, and
practices of citizenship in a democratic republic.

© 2007 American Anthropological Association. All rights reserved.                                                  6
Selected State Social Studies Content Standards
CALIFORNIA
http://www.cde.ca.gov/be/st/ss/hstmain.asp
GRADES 6-8
• 8.6 Students analyze the divergent paths of the American people from 1800 to the mid-1800s and the
challenges they faced, with emphasis on the Northeast.
• 8.7 Students analyze the divergent paths of the American people in the South from 1800 to the mid-
1800s and the challenges they faced.
8.8 Students analyze the divergent paths of the American people in the West from 1800 to the mid-1800s and
the challenges they faced.
8.12 Students analyze the transformation of the American economy and the changing social and political
conditions in the United States in response to the Indus-trial Revolution.
MINNESOTA
http://education.state.mn.us/mde/Academic_Excellence/Academic_Standards/Social_Studies/index.html
GRADES 4-8
Strand I: United States History
Substrand G: Reshaping the Nation and the Emergence of Modern America, 1877-1916
The student will analyze the transformation of the American economy and the changing social and political
conditions in response to the Industrial Revolution.
2. Students will identify and explain racial segregation and racism, including the rise of “Jim Crow,”
the Ku Klux Klan, discrimination against immigrants, and the relocation of American Indian tribes to
reservations, and analyze the impact of these actions.
VIRGINIA
http://www.pen.k12.va.us/VDOE/Instruction/History/hist_ss_framework.html
United States History: 1877 to the Present
VUS.2
The student will describe how early European exploration and colonization resulted in cultural interactions
among Europeans, Africans, and American Indians (First Americans).
VUS.3
The student will describe how the values and institutions of European economic life took root in the colonies
and how slavery reshaped European and African life in the Americas.
VUS.14b
The student will demonstrate knowledge of economic, social, cultural, and political developments in the
contemporary United States by
a. analyzing how changing patterns of immigration affect the diversity of the United States population, the
reasons new immigrants choose to come to this country, and their contributions to contemporary
America.
© 2007 American Anthropological Association. All rights reserved. 7LESSON PLANS
This section includes lesson plans designed to aid you and your students in inquiry-based exploration
of the importance of and relationships between human variation, race and racism. The lesson plans are
grouped into three theme areas: (1) Exploring Human Biological Variation; (2) Exploring Cultural
Variation; and (3) Experiencing Race and Racism.
Exploring Human Biological Variation presents teachers and students with four activities that
demonstrate how the idea of race fails to represent or explain human biological variation. Exploring
Cultural Variation provides teachers and students with five activities that demonstrate how culture
shapes the way we see the world, why we think we see race, and how conceptions of race have
changed over time. Experiencing Race and Racism presents teachers and students with four
activities that demonstrate how race and racism are embedded in our everyday life and affect our
preferences as well as our thinking about and relationships with others.
EXPLORING HUMAN BIOLOGICAL VARIATION
OVERVIEW
The idea of race was invented only a few hundred years ago and neither explains nor accounts for
human biological variation. It is because the idea of race was entangled early on in science, the notion
of human biological races persists. The following activities demonstrate why human biological
variation is not racial.
From a biological perspective, the notion that human races exist rests on three basic assumptions about
human variation. First, many traits or characteristics are considered as discrete. Discrete traits are
represented by a small number of distinct categories, such as with the ABO blood group system. A
person is either type A, type B, type AB, or type O. Second, traits are thought to cluster together or
covary by race so that the presence (or frequency) of one “racial trait” is useful for predicting the
presence (or frequency) of others. Third, many people assume that scientists have observed greater
genetic and phenotypic variation between rather than within 'races.'
None of these assumptions are supported by the facts of human biological variation. In fact, most
anthropologists have agreed for some time that patterns of human variation undermine the idea of
separate human races. In fact, race-based interpretations of human diversity limit and obscure
scientific research into the true sources, patterns, and importance of human variation.
The four exercises that follow provide a "starter kit" – for teaching and learning about human variation
in non-racial terms. Instructors may modify them for use at different grade levels. Together, they
introduce the evolutionary approach to human biology that is central to biological anthropology and
provide an introduction to the structure of human variation. Each lesson helps students to understand
both why humans vary as a single biologically diverse species and why races do not exist.
© 2007 American Anthropological Association. All rights reserved. 8 Continuous Trait Variation illustrates the problem with defining 'races' with clinal or
continuous traits.
o The idea of races supposes that there are natural breaks in the distribution of human
biological variation that produce clear clusters (or races) of people who share certain
traits. However, the opposite is generally true: human variation is a continuum. Much
like a map of temperatures, groups of individuals tend to vary gradually over
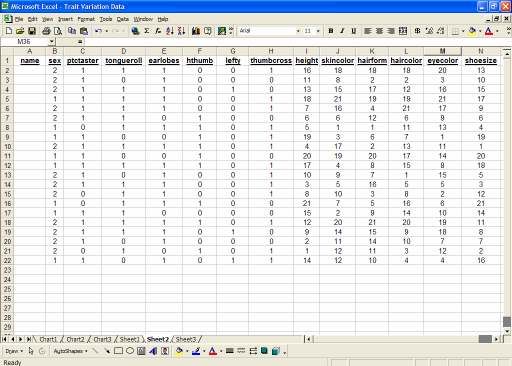
geographic space in a continuous or clinal fashion. Skin color, for example, changes
gradually from one group or location to another (see "Skin Color" Map). Knowing this,
Frank Livingstone in 1962 wrote, “There are no races, only clines.”
Graphing Concordance introduces the concept of independence to show that 'racial' traits
actually do not cluster together reliably within so-called races.
o Clearly, some traits are useful for predicting others. A good example is the correlation
between height and shoe size. For two groups of people, the average shoe size probably
will be greater for the group with greater average height. However, many traits vary
independently; they are nonconcordant. This fact lends support to the aphorism that
"race is skin deep." There is no clear or stable relationship between easily observable
traits such as skin color and what is inside the body and less observable, literally
millions of genetic and phenotypic traits.
Apportioning Genetic and Phenotypic Variation offers students a way to think about variation
as a measurable concept, and shows that human diversity does not pattern racially at the genetic
level, or "beneath the skin."
o A startling fact is that most of the variation found among humans is local and not found
among continental 'races.' Those who statistically have studied global patterns of
human variation, starting with a famous paper by Richard Lewontin in 1972, generally
find that only about 6-10% of the variation apportions (or is statistically explained) by
continental 'races.' Some recent data even suggests that the average genetic difference
between two individuals of the same 'race' is about the same as that of two individuals
from different so-called 'races' (Yu et al., 2002). This exercise addresses the problem of
how to represent human genetic or phenotypic variation in a conceptually
understandable and meaningful way.
Gene Flow Illustration shows students how quickly a new allele (or version of a gene) can
spread throughout a population through mating.
o People today mate across all social and cultural distinctions and barriers. However,
rarely acknowledged is the fact that this is the rule, not the exception, throughout human
history. This exercise helps students to understand how gene flow has helped to
maintain a great deal of genetic similarity within the human species, including across
so-called races, and to appreciate how quickly an allele can spread throughout a
population via mating.
Although these activities were designed to explain the sources and nature of human biological
variation, biology and life science teachers may find it useful to collaborate with social science
teachers. Social, cultural and environmental factors together influence contemporary human diversity.
© 2007 American Anthropological Association. All rights reserved. 9History and social studies teachers may shed light on such factors, past and present. Ideally, then, these exercises will provide team-teaching opportunities beneficial for both students and teachers. Finally, even though race is not an accurate way of describing it, we should clearly add that human variation does exist. Further, ideas about race have real and important social effects. Exploring Cultural Variation and Experiencing Race and Racism provide lesson plans for exploring the roles that culture plays in shaping how we come to "see" and "feel" race in our everyday lives. © 2007 American Anthropological Association. All rights reserved. 10
Lesson Plan 1:

                                      Continuous Trait Variation
                                 Developed by Joseph Jones and Alan Goodman

Objectives

This introductory exercise illustrates that human biological races appear to exist only when clinal
variation is not recognized and continuous traits are represented as discrete traits. Students will learn
the "rule" of human biological variation, i.e., that:

        •    Most traits such as skin color or height vary gradually along a continuum from light to dark
             or short to tall. Dividing the continuum is arbitrary; and
        •    The frequency of traits in groups is also continuous. Even for a trait that takes on a few
             discrete values such as in the ABO blood groups (see below), the frequency of blood types
             in groups is continuous and once again, where the continuum is divided is arbitrary.

Key Terms

    •   continuous trait
    •   discrete trait
    •   trait frequency
    •   cline/clinal variation
    •   ecological

Time

Approximately 1 hour and 15 minutes (including a flexible discussion period)

Materials

For this exercise you will need:

   1. Illustrations of various discrete traits (e.g., attached earlobes; hitchhiker's thumb; different hair
      forms, etc. (See Figure 1). Further illustrations and explanations of these may be obtained
      from the "An Inventory of My Traits" (PDF) and "Comparing Inherited Human Traits" (PDF)
      teacher guides found at the "Teacher's Resources" page of the University of Utah's Genetic
      Science Learning Center website (http://gslc.genetics.utah.edu/).
   2. Skin color and ultraviolet radiation maps showing clinal variation (Appendix A)
   3. Blood type maps showing regional, non-racial variation (Appendix B)
   4. A large writing pad and markers for recording students' trait values

© 2007 American Anthropological Association. All rights reserved.                                        11
Procedure 1. Introduce discrete traits. Define the concept of a discrete trait and help students create a list of about six of these. Examples include sex, blood types (ABO, MN, etc.), PTC taste sensitivity, left- over-right thumb-crossing, hitchhiker's thumb, earlobe attachment, dimples and tongue-rolling. Have students record their values for each phenotypically observable trait. Note: Most of the traits that students list are thought to result from a single gene that may be observed in either a dominant or recessive form. The form of the gene observed is known as an allele, and every person inherits one allele from each parent. The terms "dominant" and "recessive" do not imply value. They refer only to the number of alleles necessary for a person to express a given trait or phenotype. For example, a single gene might determine whether or not a person has detached or attached earlobes. Since the detached earlobe allele is dominant, an individual needs to receive this allele from only one parent to have detached earlobes (although she or he may have received it from both parents). On the other hand, because the attached earlobe allele is recessive, an individual with attached earlobes must have received this allele from both parents. This is because, where both a dominant and a recessive allele are present, only the dominant allele will be expressed. Here, a person will have detached as opposed to attached earlobes. For students learning basic genetics, the relationship of alleles to ideas about race will be discussed further during the Apportioning Genetic and Phenotypic Variation exercise. The "Comparing Inherited Human Traits" (PDF) teacher's guide contains information on which alleles are dominant or recessive for a number of discrete traits as well as which traits are shared by most people. Share this information with students, and have them determine whether or not their parents passed along either (1) two recessive alleles or (2) one or two dominant alleles for any of these traits. Note that it is not possible to discern the presence of one versus two dominant alleles simply by observing a phenotype. 2. Introduce continuous traits and clines. Explain the concept of a continuous trait. Help students create a list of about six of these. This probably will be easier than creating the list of discrete traits as these will likely be more familiar to most students and as we have suggested, continuity is the rule. Examples include height, weight, shoe size, skin color, and hair color. Have students record their values for each trait. We suggest having students actually line up by height, shoe size, etc. as these will be defined as rank order in the class. Once lined up, students should call off their rank order, for example, 1 being the tallest student, 2 the next, and so on. (If shoe size data is collected, be sure to standardize female and male sizes where appropriate). Having students line up also provides an opportunity for students to visually engage the concept of clines while highlighting the variation present within the classroom. In a phenotypically diverse setting, students will be able to identify amongst themselves a range of skin, eye or hair color/textures, for example. In less diverse settings, height and shoe size will likely still be useful for illustrating this concept. © 2007 American Anthropological Association. All rights reserved. 12
In both cases, this idea may be reinforced in its global context with the skin color map, which shows
dark skin as an "equatorial trait". That is, skin generally becomes lighter as one moves away from the
equator.

3.     Check the data. Be sure that each student's values were recorded for all traits on the large
writing pad. These data will be used for the Graphing Concordance exercise.

Going Further: Explaining human variation without 'race'

If 'race' is inadequate for classifying human biological variation, it is even less useful for explaining it.
How, then, do we begin to account for the phenotypic diversity observed among human populations?
After all, biological variation is real even though biological race is not!

While all humans share the same basic biological makeup, different environmental conditions
sometimes require different expressions of our shared genetic potential. Human biological variation
refers to the range of these different expressions, and the environmental (or ecological) factors that
influence them often include social and cultural practices. It is possible to predict geographic patterns
for traits for which key ecological influences are understood, and to understand why this predictability
does not suggest that these traits are 'racial'.

For example, let's take another look at skin color. Some anthropologists suggest that the earliest
humans evolved dark skin to help protect against overexposure to ultraviolet radiation (UVR) that, in
large amounts, can reduce body levels of an important nutrient, folic acid (e.g., Jablonski, 2004). This
theory is supported by the fact that global clinal variation in skin color correlates strongly with levels
of UVR exposure, which is most concentrated at the equator. Specifically, dark skin is considered an
equatorial trait, and skin color among human populations is lighter as one moves away from tropical
areas.

The term 'evolved' suggests that, in addition to ecological conditions, time is also important as a factor
in human biological variation. Changes in skin color occurred over tens of thousands of years –
actually not a very long time in evolutionary terms! In fact, this was long enough to produce skin color
and other relatively "cosmetic" changes across populations, but not long enough to produce the
fundamental or "deep" biological changes implied by 'racial' classification.

Ask students to compare the skin color and UVR exposure maps and to explain the nature of the skin
color/UVR relationship.

Discussion

1. Allow students to share their findings from the first part of the exercise. Using the trait guide,
   students also can compare the classroom frequency of several traits to that of the larger population.
   For example, the guide suggests that only 25% of the population has hitchhiker's thumb. What
   percentage of students has this trait? Why might the class percentages vary from the percentages
   listed in the guide?

© 2007 American Anthropological Association. All rights reserved.                                          13
2. Was it easy to tell discrete from continuous traits?

    Yes, in some cases. But categorizing values for some discrete traits can mask underlying
    continuity. For example, hair texture is often considered a discrete trait, but is there always a clear
    distinction between "curly" and "wavy/straight" or between "wavy/straight" and "straight" hair?
    (These are commonly used categories).

    Note: It is useful to collect data on hair texture as a continuous trait for use during the Graphing
    Concordance exercise.

3. Most so-called racial traits are continuous, or only ambiguously discrete, as just noted for hair
   texture. What does this mean for the concept of biological race?

    Recall that the first assumption or condition of the biological race concept is that 'racial' traits
    should be discrete (See Teaching Non-racial Human Variation).

4. Ask students why they think skin color correlates with UVR, and what this means for the concept
   of biological race. Ask students for other examples of traits that correlate with known ecological
   factors.

As a bridge to the next exercise, Graphing Concordance, ask students to follow up on the last
discussion point by bringing to the next class (1) a summary of "A New Light on Skin Color"
(See references) or (2) a 2-3 paragraph report on possible environmental sources of variation for
another 'racial' trait.

References

Iqbal, S. 2002. A New Light on Skin Color. NationalGeographic.com. Accessed on February 1, 2005.

Jablonski, N. 2004. The Evolution of Human Skin and Skin Color. Annual Review of Anthropology 33: 585-623.

Livingstone, F. 1964. On the Nonexistence of Human Races. In A. Montague, ed., The Concept of Race, pp. 46-
    60. New York: The Free Press.

The following undergraduate-level biological anthropology textbooks provide extensive background
information for this exercise.

Park, M. 1999. Biological Anthropology. Second Edition. Boston: McGraw-Hill Publishing.

Relethford, J. 2003. The Human Species: An Introduction to Biological Anthropology. Fifth Edition. Boston:
    McGraw-Hill Publishing.

© 2007 American Anthropological Association. All rights reserved.                                            14
Lesson Plan 2:
Graphing Independence
Developed by Joseph Jones and Alan Goodman
Objectives
This exercise illustrates that variation in traits such as hair form or skin color typically is a poor
predictor of variation in other traits among individuals and groups. Using data collected from the
Continuous Trait Variation exercise and the maps provided, students will:
• graph classroom variation to see which traits correlate on an individual level;
• consider factors that possibly contribute to these observations; and
• show the independence of the global distribution of selected traits in groups.
Key Terms
• covary
• independence
• correlation
• scatterplot graph
Time
Approximately 1 hour and 15 minutes (including a flexible discussion period)
Materials
For this exercise you will need:
1. Copies of data recorded from the Continuous Trait Variation exercise for each student
2. Diagram of independent trait variation (Figure 1)
3. Examples of graphed positive, negative and nonlinear correlation (Figure 2)
4. A large pad (graph paper)
5. Colored markers
6. Maps of world skin color, type A blood frequency, and type B blood frequency distributions
(Figure 3)
7. Map comparing world skin color and type A blood frequency distributions (Figure 4)
Procedure
1. Introduce the concept of trait independence. Explain to students that most traits vary
independently and do not covary by 'race' (or otherwise). Anthropologists refer to this pattern as
nonconcordance.
© 2007 American Anthropological Association. All rights reserved. 15The diagram provided as Figure 1 should be useful for helping them to grasp this concept. Imagine that the four tubes represent four different individuals. If one knows the top layer, skin color, one cannot reliably predict what will be found in the other layers. For example, the two individuals to the left have the same “light” skin color but differ for the other three layers (or traits). 2. Select trait pairs and predict correlations. On a large writing pad, list all of the possible pairs of continuous traits (e.g., shoe size/height, height/eye color, eye color/shoe size and so forth). Working in pairs, students should select one pair of traits to graph. Write students' names next to their selections so that they can refer to the list if necessary. Ask students which traits are most likely to covary and record their responses. Hand out copies of class data from Continuous Trait Variation. 3. Graph the data. In order to test their predictions, students will explore relationships between two traits. To do this, students will construct a scatterplot graph, which is used to compare continuous variables. On a scatterplot graph, one trait is represented on the X-axis and the other trait is represented on the Y-axis. Students should label each axis by trait and number each axis according to class size. It does not matter which trait is represented on either axis. Each individual is represented with a single data point. Here is an example of a scatterplot comparing height and shoe size using data collected from 21 people during Hampshire College's Rethinking Race summer teacher's training institute. By tracking their own data points across graphs, students are able to see whether or not their trait values followed overall class patterns. Using different color markers, students also may track groups within the class. Different colors may be used to plot data points by age or sex, or by any of the discrete traits for which data was collected. For example, blue dots may be used to plot individuals with hitchhiker's thumb and red dots used to plot individuals with straight thumbs. © 2007 American Anthropological Association. All rights reserved. 16
4.       Identify, explore and discuss correlations. The X-axis position of a data point in relation to
its Y-axis position shows the relationship of the two variables as observed for that individual.
Together, all of the data points suggest a pattern of the relationship of the two variables for the entire
class. This pattern may take the form of a positive, negative or nonlinear correlation (See Figure 2 for
illustrations and further explanations).

The above example shows positive correlation for height and shoe size for the Rethinking Race group.
That is, as height increases, so does shoe size for most individuals. Not all trait pairs will correlate as
strongly or obviously. Thus, students should first discuss with their partners whether or not their
selected traits correlate and, if so, the nature of that correlation. Once all of the students have done
this, they should post their graphs and share their findings with the entire class.

5.     Compare Results. The groups of students may now put there graphs on the classroom wall.
Go around the room and have each group explain the relationship they graphed.

Going Further: Maps and Group Variation

Using maps of the global distribution of select traits, students can also see that group averages are
nonconcordant. First, re-examine the global distribution of skin color (Figure 3a). In general, skin
color varies by distance from the equator. Now examine the global distribution of another trait, such
as blood type B (Figure 3b). The distribution of this trait is more on an east-west axis and looks
entirely unlike the distribution of skin color. Ask students what might cause the distribution of blood
type B?

Does the distribution of blood type A (Figure 3c) follow a pattern similar to that of skin color? Show
students Figure 4, a map comparing distributions of skin color and type A blood frequency. Are
distribution patterns of skin color and type A blood frequency concordant or nonconcordant? Note the
difficulty of assigning 'race' when comparing only these two traits, For example, some areas that are
relatively homogeneous with respect to type A blood frequency exhibit the most skin color variation.
What would skin color tell us about the ABO blood system?

Going Further: Using Excel to Graph Relationships

Using a spreadsheet program such as Excel, students can also readily graph bivariate relationships, plot
trend lines, etc. Students also practice data entry (and coding for discrete traits), and learn how to
properly format a graph. Some teachers may prefer to use Excel in place of the manual graphing of
relationships. However, starting by manual graphing provides a greater feel and interaction with the
data. Here is a sample Excel sheet with continuous and discrete trait values entered. Most discrete
traits are coded as "0" if the trait was absent and as "1" if the trait was present. Sex was coded as "1"
for males and as "2" for females.

© 2007 American Anthropological Association. All rights reserved.                                        17
Discussion

1. Which traits correlate, and how strongly? How accurate was the list of traits students identified as
   most likely to correlate in part one?

2. When tracking their own values, did any of the students consistently fall outside of the overall
   class patterns? If so, be sure to reinforce for them that this is not evidence of 'racial' difference
   from other students (if the traits involved are 'racial' ones). Rather, this might be an example of
   local variation that limits the usefulness of the biological race concept.

3. If different colors were used to plot different groups, did group values pattern in any interesting
   ways? Explain.

5. The distribution of type B blood may be related to the history of infectious disease or other factors,
   or it might simply be due to nonselective forces of evolution. We do not yet have a clear answer.

6. The lack of any relationship between skin color and blood types is further evidence of
   nonconcordance and the lack of utility of race-as-biology. Ask students to explain how Figure 4
   provides support for this statement.

7. If skin color does not have “deeper biological meaning,” should a doctor take skin color into
   account? Why? Why not?

© 2007 American Anthropological Association. All rights reserved.                                          18
So far, we have focused on problems associated with classifying phenotypic variation through
'race'. The next exercise, Apportioning Phenotypic and Genetic Variation, will address the
discredited but persistent notion that observable variation is the outward expression of deeper,
biogenetic differences between 'races'. As an introduction to this exercise, students should
identify and write a brief (~ one page) report on any 'racial disease' (e.g., sickle cell anemia, Tay-
Sachs disease or cystic fibrosis) – its etiology, symptoms and distribution in the US population.

References

Brace, C.L. 1996. A Four-letter Word Called "Race". In L. Reynolds and L. Lieberman, eds., Race and Other
    Misadventures: Essays in Honor of Ashley Montagu in His Ninetieth Year, pp. 106-141. Dix Hills, New
    York: General Hall, Incorporated.

Diamond, J. 1994. Race Without Color. Discover 15(11): 82-89.

Goodman, A.H. 1997. Bred in the Bone. The Sciences March/April: 20-25.

Park, M. 1999. Biological Anthropology. Second Edition. Boston: McGraw-Hill Publishing.

© 2007 American Anthropological Association. All rights reserved.                                           19
Figure 1. Diagram of Independent (or Nonconcordant) Variation. If each layer represents geographic variation for one trait and each cylinder represents an individual, it is apparent that traits vary independently. This pattern is observed both continentally and as local variation within smaller geographic areas. Source: Modified from Park, Biological Anthropology, 2nd, ©McGraw-Hill Companies, Inc. © 2007 American Anthropological Association. All rights reserved. 20
Figure 2. Examples of scatterplots showing possible correlation patterns for continuous
traits/variables.

A. Positive Correlation: high or low values for the X-axis trait will correspond with high or low
   values for the Y-axis trait, respectively.

                                  25

                                  20

                                  15

                                  10

                                      5

                                      0
                                          0       5        10        15        20        25

B. Negative Correlation: high values for the X-axis trait will correspond with low values for the Y-
   axis trait, and vice versa.

                                  25

                                  20

                                  15

                                  10

                                      5

                                      0
                                          0       5        10        15        20        25

C. Nonlinear Correlation: values for the X-axis trait and values for the Y-axis trait do not correspond
   in a way that explains the relationship between the two traits. For our purposes, we may simply
   say that this pattern represents "no correlation".
                             25

                             20

                             15

                             10

                              5

                              0
                                  0           5       10        15        20        25

© 2007 American Anthropological Association. All rights reserved.                                      21
Figure 3. (A) World Skin Color Distribution, (B) World Frequency Distribution of Type B Blood, and (C) World Frequency Distribution of Type Blood. Source: Park, Biological Anthropology, 2nd, ©McGraw-Hill Companies, Inc. A. B. © 2007 American Anthropological Association. All rights reserved. 22
Figure 3. Continued.

C.

© 2007 American Anthropological Association. All rights reserved.   23
Figure 4. Comparison of World Skin Color Distribution and World Frequency Distribution of
Type A Blood. This map was created by overlaying Figures 3a and 3c, and by contrasting the colors
to highlight the range of possible trait/trait frequency combinations. Source: Modified from Park,
Modified from Park, Biological Anthropology, 2nd, ©McGraw-Hill Companies, Inc.

© 2007 American Anthropological Association. All rights reserved.                                24
Lesson Plan 3:

                         Apportioning Phenotypic and Genetic Variation

                                Developed by Alan Goodman and Joseph Jones

Objectives

This exercise addresses the problem of how to represent human genetic or phenotypic variation in a
conceptually understandable and meaningful way. Students will:

    •   Learn some basic concepts in human genetics
    •   Discuss empirical data on human genetic variation
    •   Understand that important phenotypic and genetic differences amongst humans occurs at the
        individual level and are not reflected in group averages

Key Terms

    •   apportionment
    •   gene
    •   locus
    •   allele

Time

Approximately 1 hour and 30 minutes (based on grade level, and including a flexible discussion
period)

Materials

For this exercise you will need:

    1. Clear bottles (plastic or glass) with wide tops (approximately 1 bottle per student)
    2. Marbles or other small and brightly colored objects in at least two high contrast colors such as
       red and blue or black and white (approximately 100 marbles per student)
    3. Handout on trait frequencies by ‘race’ (See Figure 1)
    4. (optional) M & Ms, Reece’s Pieces or other edible colored candies

Procedure

Simple Version

Assign students to work in groups of two or three. Give each set of students two clear jars representing
two ''races'', and marbles that will represent individuals. The number of individuals (marbles) selected

© 2007 American Anthropological Association. All rights reserved.                                     25
is an arbitrary decision, but should be the same for each 'race'. We suggest 100 marbles/individuals per jar. This number allows 1 marble to equal 1%. 1. Assume all variation is between the two 'races'. Ask students to fill the two jars with marbles representing all variation between 'races'. Students should end up filling one jar with one color of marble and the other jar with another color. Explain to students that each marble represents an individual. Depending upon grade level, different colors may represent (1) simply the presence or absence of different traits, or (2) the presence of different alleles [allelic variation]. Thus, every individual of 'race' (jar) "A" will have one trait or allele, while every individual of 'race' (jar) "B" will either not have that trait or will have a different allele. 2. Assume all variation is within the two 'races'. Now, students should fill the two jars with marbles of two different colors representing all variation within the two 'races'. The proportion of one color to another does not matter, but must be the same for each 'race'. For example, each jar might have 50 black and 50 white marbles or 9 blue and 91 red marbles. Thus, each 'race' will have the same frequency for a given trait or allele. 3. Using real data on human variation. This step requires that students understand the definition of an allele as actual human genetic data are used. Data may be found in a variety of sources such as Cavalli-Sforza, et al. (1994). Table 1 is abstracted from Nei and Roychoudhury (1982) and Lewontin (1972) and consists of genes with two commonly found alleles. Assign each group at random to a different gene from Table 1. As in the previous two steps, students are to select a color marble to represent each of the two alleles and then fill up the jars, with one marble representing one individual, or one percent of the 'race'. For example, for the first gene, Auberger, the ‘Caucasian’ jar should contain 62 marbles of one color and 38 of another, while the ‘Negroid’ jar will contain 64 marbles of one color and 36 of another. Note that in Table 1 data are usually provided for three ‘'races'’ After each group has successfully put the appropriate amount of marbles in each of the jars, go around the room and ask each group how important race seems to be in statistically "explaining" their trait. The students should be able to hold up and display their jars for the rest of the class. Using M & M's. For more fun, one can complete any of the above exercises using colored candies. In our experience, Reece’s Pieces work particularly well because they have a hard outside and come in a limited number of colors. Going Further: Comparing more 'races', alleles, and genetic systems In the simple version, only two 'races' were compared for a single genetic system with two alleles. However, the exercise can easily be expanded to include a third 'race', a genetic system with more than two alleles variants, or more than one genetic system at a time. Doing so will remind students of the complexity obscured or ignored by racial classification. © 2007 American Anthropological Association. All rights reserved. 26
To include a third race, all that is needed is a third jar. A third or fourth variant simply requires a
source such as Cavalli-Sforza, et al. (1994) and a third or fourth color marble. And considering more
than one genetic system requires adding the appropriate number of color marbles (i.e., the number of
alleles involved).

Adding a second or third trait requires an assumption of independence or non-concordance. The
frequency of having trait A of one gene system and trait B of another is simply the product of
frequency A and B.

Discussion

1. After students complete part one, ask them whether or not there is a trait in the real world that
   actually varies by race like this.

    Skin color variation between Europeans and Africans most often is mentioned, but even in this
    example there is some “overlap.” There is no genetic trait that works this way.

2. For part 2, if a "blue" individual was more susceptible to a certain disease, would knowing his or
   her race be useful for predicting whether or not this person will actually ever have the disease?
   This question is currently a source of great debate among anthropologists, bioethicists and medical
   practitioners. Students should refer to their homework assignments from the previous exercise,
   which will provide concrete examples for them to consider regarding race and disease.

    What other factors might influence this outcome? This, of course, will depend on the specific
    disease chosen. The main point is to have students consider genetic variation as one of many
    factors (environment, social status, cultural practices, etc.) that combine to influence health and
    other forms of observed variation. One could also ask if human variation in reality is more like this
    example than the prior one.

3. After completing parts 1 and 2, one can consider what real data might look like.

    Our experience is that most individuals will think that 'races' must be much like the first example –
    all variation between 'races'. But, as we will see, this is not the case.

4. The genes used in part three are mostly of no known function. However, students may want to
   look up what is known about the particular gene.

5. It is important to point out that the above is a statistical exercise that assumes that 'races' are
   meaningful units of analysis.

    With this assumption, race can be said to statistically capture a percentage of human variation. But
    is there is another system that might better explain existing variation? As students have seen with
    these exercises, the evolutionary model does this by offering both descriptions and reasons for
    human biological variation.

© 2007 American Anthropological Association. All rights reserved.                                        27
For students with some background in genetics, this exercise may be modified to introduce the forces
of evolution: gene flow, genetic drift, mutation and natural selection.
References
Cavalli-Sforza, L.L., P. Menozzi and A. Piazza. 1994. The History and Geography of Human Genes. Princeton:
Princeton University Press.
Lewontin, R.L. 1972. The Apportionment of Human Diversity. Evolutionary Biology 6:381-398.
Nei, M. and A.K. Roychoudhury. 1982. Genetic Relationship and Evolution of Human 'races'. Evolutionary
Biology 14:1-59.
Yu, N., et al. 2002. Larger Genetic Differences within Africans than Between Africans and Eurasians. Genetics
161:269-274.
© 2007 American Anthropological Association. All rights reserved. 28Figure 1. Frequencies of Alleles by 'Race'1
Gene Allele Caucasoid2 Negroid Mongoloid
a
Auberger Au 0.62 0.64 --3
Au 0.38 0.36 --
Secretor Se 0.52 0.57 --
se 0.48 0.43 --
Xg Xga 0.67 0.55 0.54
Xg 0.33 0.45 0.46
Plasminogen PGP1 0.71 0.86 --
PGP2 0.29 0.14 --
Acid phosphatase ACP Pb 0.60 0.83 0.79
Pc and other 0.40 0.17 0.21
Acid phosphatase Sapb SapB 0.77 -- 0.88
SapO 0.23 -- 0.12
Alcohol dehydrogenase-3 ADH1 0.60 -- 0.62
ADH2 0.40 -- 0.38
s
α1 Acid Glycoprotein Or 0.36 0.41 0.27
Orf 0.64 0.59 0.73
Adenosine deaminase ADA1 0.95 0.97 0.97
ADA2 0.05 0.03 0.03
Diego blood group Dia 0.00 0.00 0.04
Di 1.00 1.00 0.96
MN blood group M 0.54 0.58 0.53
N 0.46 0.42 0.47
1
Source: Lewontin (1972) and Nei and Rochoudhury (1982)
2
Racial terminology appears in the original texts.
3
Missing data are represented by '—'
© 2007 American Anthropological Association. All rights reserved. 29Lesson Plan 4:
Gene Flow Illustration
Developed by Carol Mukhopadhyay and Yolanda Moses4
Objective
Students will understand the rapidity with which a new gene can spread through a population through
mating.
Time
5-10 minutes
Materials
Glitter or something that will stick to student hands but can be removed with washing. The glitter
represents genes from one stranger outside the community. You could use two or three different colors
to represent different genes.
Procedure
Step 1. Instructions. Students (Ss) are to imagine that the Teacher (T) is a stranger to the community.
To meet people, T will go around and shake hands with Ss. Since people like to interact, once their
hand is shaken, they will shake hands with three others Ss. No one whose hand has been shaken can
participate more than once. Eventually, everyone will be contacted.
Step 2. T spreads enough glitter on his/her hand so that it will “spread” when another hand is shaken.
T begins by shaking hands with three students in class. The glitter should stick to hands of students but
not be perceptible.
Step 3. Students proceed as outlined above, shaking hands with 3 other Ss. It takes very few rounds for
everyone to be contacted once.
Step 4. Students examine their hands and see how quickly the ‘glitter’ has spread. This graphically
illustrates how few “hand-shakes” it takes for a new gene to spread through a population.
4
Material from How Real Is Race? A Sourcebook on Race, Culture, and Biology, (2007), p. 58, by Carol Mukhopadhyay,
Rosemary Henze and Yolanda T. Moses, published by Rowman & Littlefield Publishing Group Books, appears by
permission of the author and publisher. This material is protected by copyright. All rights reserved. Please contact
the publisher for permission to copy, distribute or reprint.
© 2007 American Anthropological Association. All rights reserved. 30EXPLORING CULTURAL VARIATION OVERVIEW5 Race, as a description of human biological variation, may not be real. But it is definitely a cultural, social, and historical reality with real consequences. Most educators and students have little difficulty recognizing that race in the United States is real. And most probably experience race as a cultural reality even if they believe it is biologically real. Some educators may have even been introduced to the concept of race as a cultural or social “construct,” to the idea that race is socially or culturally “constructed”. But the idea that race is a human invention, a cultural invention, a social creation, is quite complex and can be difficult to communicate. People often resist the idea that race is only a cultural construct. How could race be purely cultural when it seems —and is—so real and has such profound historical and contemporary consequences? The following section offers a sample of lesson plans that address some of the major themes or conceptual points students need to “get” if they are to understand that race is both a cultural invention and profoundly real. They are all appropriate for either middle or high school students. Most are also suitable for adults, including teachers and other educational staff. Some could be adapted to younger students. Additional teaching activities and more detailed conceptual background material can be found in Mukhopadhyay, Henze, and Moses (2007) as well as in other resources found at the end of this Guide. Culture is Real Lesson plans 1-4 all address the concept of culture. In order to understand the idea that “race is a cultural creation,” students must understand the concept of culture and how profoundly culture shapes our experience of reality. Students (and educators) often think they know what culture is. They’ve heard the word and many schools offer “cultural” programs, “cultural” assemblies, “cultural” festivals and other celebrations of “cultural” diversity. To anthropologists, culture is more than material artifacts, more than special foods or celebrations, more than social organizations, social structure, social roles and social behavior. The term culture includes shared meanings, shared belief systems, shared cultural knowledge, shared ways of perceiving and interpreting the world around us. Culture shapes every aspect of human experience…what we hear, smell, taste, what we see, and what we feel. It guides our social interactions and organizes our social world. Human social organization is largely a cultural invention—but one that is very real. Race is also a cultural invention—and it, too, is experientially, emotionally, cognitively, perceptually real, deeply internalized in our psyche, in our brains, in our senses. 5 This overview, by Mukhopadhyay, draws heavily on the introduction to Part 2: Culture Creates Race, in Mukhopadhyay, Henze and Moses (2007) How Real Is Race? A Sourcebook on Race, Culture, and Biology. © 2007 American Anthropological Association. All rights reserved. 31
You can also read