Quality Certificates Alleviate Consumer Aversion to Sponsored Search Advertising 9886 2022
←
→
Page content transcription
If your browser does not render page correctly, please read the page content below
9886
                            2022
                             August 2022

Quality Certificates Alleviate
Consumer Aversion to
Sponsored Search Advertising
Xiang Hui, Meng Liu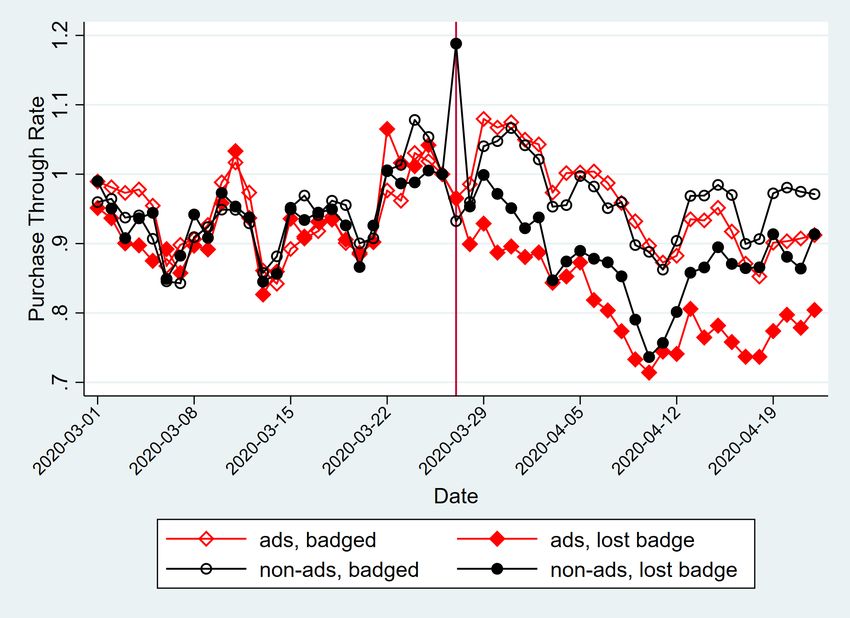
Impressum:

CESifo Working Papers
ISSN 2364-1428 (electronic version)
Publisher and distributor: Munich Society for the Promotion of Economic Research - CESifo
GmbH
The international platform of Ludwigs-Maximilians University’s Center for Economic Studies
and the ifo Institute
Poschingerstr. 5, 81679 Munich, Germany
Telephone +49 (0)89 2180-2740, Telefax +49 (0)89 2180-17845, email office@cesifo.de
Editor: Clemens Fuest
https://www.cesifo.org/en/wp
An electronic version of the paper may be downloaded
· from the SSRN website:       www.SSRN.com
· from the RePEc website:      www.RePEc.org
· from the CESifo website:     https://www.cesifo.org/en/wp

CESifo Working Paper No. 9886

  Quality Certificates Alleviate Consumer Aversion
          to Sponsored Search Advertising

                                           Abstract

We study consumer response towards sponsored search advertising and how to improve
advertising performance on a large e-commerce platform. Our research design is based on a field
experiment which randomizes the salience of ad disclosure to consumers, and a natural experiment
which eradicates a listing-level quality certificate for all listings because of a system glitch.
Results suggest that consumers dislike search advertising in our setting, but quality certificates
mitigate this aversion and increase advertising sales.
Keywords: sponsored search advertising, quality certificates, e-commerce.

                   Xiang Hui                                         Meng Liu
            Washington University in                          Washington University in
             St. Louis / MO / USA                              St. Louis / MO / USA
                 hui@wustl.edu                                   mengl@wustl.edu

July 7, 2022
We are grateful to eBay for providing access to the data. Neither of us has a financial relationship
with eBay. Electronic copy available at: https://ssrn.com/abstract=4155772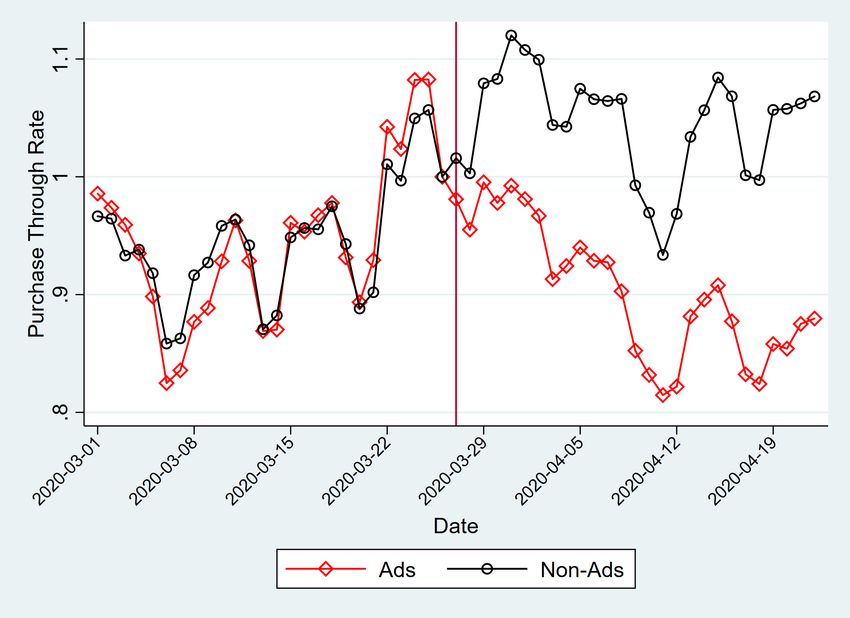
1        Introduction

Advertising fuels the digital economy.1 Among different formats of digital advertising, sponsored
search accounts for 41.4% of the total revenue.2 Two questions are of first-order importance for ad-
vertising publishers and policy makers: how do consumers respond to sponsored search advertising,
and, given this, how can ad publishers improve ad performance?
        The answer to the first question is ambiguous both theoretically and empirically. On the one
hand, the existence of advertising can induce a signalling equilibrium where only high-quality firms
advertise (Nelson (1974); Milgrom and Roberts (1986)), and can therefore help consumers find
their desired products. On the other hand, if consumer search is costly and products have already
been ranked based on some desirability metrics (e.g., predicted conversion rate), distortions of the
“organic” ranking from sponsored search can obfuscate search and reduce the purchase likelihood.
Meanwhile, empirical evidence on the effect of sponsored search on total sales, which is often based
on field experiments in e-commerce settings, is also mixed, ranging from a positive effect on a
food delivery app in Asia (Sahni and Nair (2020a)), to an overall null effect on an e-commerce
marketplace in India (Abhishek et al. (2022)), to a negative effect (Moshary (2021)) on eBay. The
theoretical ambiguity and wide-ranging empirical evidence suggest that consumer response to ads
may critically depend on institutional details in a particular market (discussed in Section 6) and
therefore should be measured on a case-by-case basis instead of being assumed.
        Despite the mixed evidence, a consistent finding among the empirical studies is that consumers
change their behavior because of their knowledge about a listing’s advertising sponsorship. Given
the informational nature of ad disclosure (i.e., disclosing that a listing is sponsored), to explore
the second question on improving ad performance, it is natural to ask how signals about match
quality interact with ad disclosure in shaping consumer behavior. In e-commerce, such signals are
typically based on reputation mechanisms, such as ratings and quality certificates. Theoretically,
the interaction between ad disclosure and reputation mechanisms is unclear and depends on con-
sumer perception of sponsored search ads (i.e., the first question): If consumers view ad disclosure
as a signal of high quality, they may rely less on reputation signals in discerning product quality in
the presence of advertising. Alternatively, if consumers dislike ads, they may rely more on reputa-
    1
     In 2021, Google received 80% of revenue through advertising, and Facebook, about 99%. Amazon’s share of
revenue from advertising business is fast-growing, at a pace of 32% in Q4 2021. These three companies combined
represent roughly 10% of the value in the U.S. stock market. https://www.csis.org/blogs/strategic-technologies-
blog/fragility-digital-advertising-and-future-attention-economy-part-i (accessed 2022/05/15).
   2
     https://searchengineland.com/us-search-ad-revenue-78-billion-2021-383518 (accessed 2022/05/15).

                                                      1

                        Electronic copy available at: https://ssrn.com/abstract=4155772
tion signals to overcome the negative impact of ad disclosure. Therefore, the interaction between
reputation signals and ad disclosure is an empirical question, which has barely been studied before.
   We fill this gap by leveraging two experiments and rich data from eBay, a globally popular
e-commerce marketplace,3 to shed light on the interaction of ad disclosure and reputation mecha-
nisms. To do this, we first study consumers’ response to sponsored listings (henceforth, ad listings)
in the case of eBay. Specifically, we use a field experiment which randomizes case types of the word
“sponsored” displayed on ad listings on the search results page: in either regular capitalization
(“Sponsored”) or in all caps (“SPONSORED”). We interpret the all-cap condition as more salient
ad disclosure compared to the regular capitalization condition. Under this interpretation, we find
that more salient ad disclosure causes consumers to substitute away from ad listings and click and
buy from organic listings (henceforth, non-ad listings) instead; total spending decreases but is not
quite statistically significant. These findings suggest that consumers dislike ads, which is consistent
with the results established in Moshary (2021), who studies an experiment that turns off sponsored
search for 3% of users on the same platform. Our field experiment complements the one in Moshary
(2021) because we are able to manipulate only (the salience of) ad disclosure while holding constant
other aspects of what consumers see and, in particular, the ordered list of products on the search
results page (more details in Section 2). The consistency in results from both papers strengthens
the conclusion of consumers’ ad aversion in our empirical setting.
   Next, given consumers’ aversion to ads, we study our second research question on how to
improve ad performance and, specifically, the role of reputation mechanisms in this. We perform
two analyses: (1) how consumers’ ad aversion differs by the existence of a listing-level quality
certificate and (2) how the effect of the quality certificate differs between ad and non-ad listings.
For the first analysis, we reuse the field experiment. We find that beyond the overall negative
effect from salient ad disclosure, ad listings with a quality certificate experience a smaller drop
in clicks and sales than those without the quality certificate. For example, ad listings with the
quality certificate experience a sales drop of 6.8%, compared to a 18.7% drop for those without
the quality certificate. The heterogeneous treatment effects suggest that quality certificates can
alleviate consumer aversion to ads.
   To quantify the causal impact of the quality certificate on ad and non-ad listings, we move on
to the second analysis based on a natural experiment (i.e., a system glitch), which eradicates the
   3
     eBay   was    the     second    most    visited    e-commerce     marketplace   globally   in   2021.
https://www.webretailer.com/b/online-marketplaces/ (accessed 2022/05/15).

                                                     2

                     Electronic copy available at: https://ssrn.com/abstract=4155772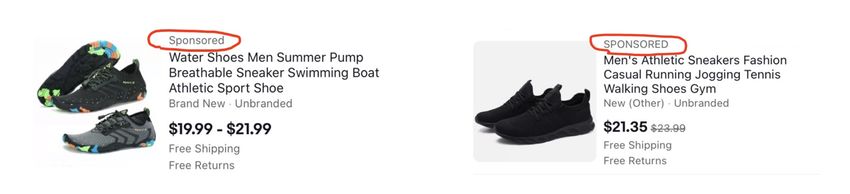
quality certificate for all listings on the website within a three-week window. We use a difference-in-
differences specification to quantify the differential impacts of losing the quality certificate between
ad and non-ad listings. We find that ad listings lose significantly more sales than non-ad listings
do. Specifically, the purchase-through rate of ad listings drops by 14.2% more compared to that
of non-ad listings. We also run two robustness analyses: an alternative identification strategy
based on comparing listings that lost the quality certificate earlier during the glitch vs. later, and
a matching approach where we compare sessions that differ only in the number of listings with
the quality certificate but are otherwise identical in terms of search keywords, the ordered list of
products on the search results page, listings’ ad status, and prices. The results from the robustness
analyses are broadly consistent with those from the simple DiD analysis.
    Considering all results, our key takeaway is that in settings where consumers are averse to
sponsored search advertising, quality certificates can mitigate consumers’ aversion to ads and in-
crease ad sales. Since search advertising has been comprising a larger share of business revenue,
ad publishers and platform managers should consider highlighting quality signals to improve ad
performance. Additionally, we note that consumer response to ads may vary drastically across con-
texts and market institutions. Therefore, policy makers need to carefully measure this parameter
on a case-by-case basis as a first step towards effective regulations.

2    Related Literature

Our paper is closely related to a growing literature that uses experiments to study consumer re-
sponse to sponsored search advertising. The evidence is mixed. On the one hand, some papers show
that consumers benefit from search ads because the action of advertising entails useful information
on the underlying product quality. For example, Sahni and Nair (2020a) show that ad disclosure
increases the probability that a consumer calls the advertised restaurant on a food delivery app
in Asia. Sahni and Zhang (2019) show that users of a search engine in the United States prefer a
marginally higher level of advertising. On the other hand, other papers show that consumers dislike
search ads because of their lower match quality relative to organic listings that would have taken the
same positions without sponsored search. For example, Moshary (2021) studies an experiment on
eBay that shuts down sponsored search ads for a random set of users, and finds that ad suspension
increases these users’ total spending on the platform. Joo et al. (2021) find that consumers dislike
sponsored ads in prime positions of the search results in an e-commerce marketplace in India. Re-

                                                   3

                    Electronic copy available at: https://ssrn.com/abstract=4155772
lated, Simonov and Hill (2021) find on Bing.com that the stolen traffic of a competitor brand that
bids on its rival brand is of low quality, highlighting the importance of search results’ relevance for
consumer conversion. Lastly, Abhishek et al. (2022) find mixed evidence on consumer perception
of ads, which depends on product categories with different degrees of information asymmetry on
product relevance between the platform and sellers in that category.
       The wide-ranging empirical evidence suggests that consumer response to ads may critically
depend on market institutions, which we discuss in Section 6.4 This observation justifies the need
for our field experiment, which varies the salience of ad disclosure, to study consumers’ ad preference
in our setting. Note that the experiment in Moshary (2021), which compares consumer behavior if
consumers see organic vs. sponsored search results, does two things: the distortion of the ordered
list of products under organic search and (the pure signalling value of) disclosing the “sponsored”
signal. In comparison, our experiment holds constant the ordered list (and other aspects on the
search results page) and manipulates only (the salience of) ad disclosure. This design allows us to
estimate the marginal effect of indicating to consumers that an ad listing is an ad (in a more salient
way). In this sense, our experiment design is similar to the one in Sahni and Nair (2020a), which
also holds the ordered list of search results fixed to estimate the signaling value of ad disclosure.
Despite the different designs, the similar qualitative results from both our experiment and the one
in Moshary (2021) strengthen the conclusion of consumers’ ad aversion in our empirical setting.
This result contributes to the literature by proving that consumers dislike ads in some contexts.
Therefore, researchers should not directly extrapolate these estimates across contexts.
       Next, we contribute to the literature on the value of quality certificates by providing evidence
on how a quality certificate interacts with advertising. Prior literature has shown that quality
certificates provide useful information to consumers and steer demand in predictable ways in many
contexts (see summaries by Dellarocas (2003); Dranove and Jin (2010); Einav et al. (2016); Tadelis
(2016)), and, in particular, the Top Rated Seller certification badge and other reputation mecha-
nisms on eBay (e.g., Resnick et al. (2006); Cabral and Hortacsu (2010); Saeedi (2019); Elfenbein
et al. (2015); Hui et al. (2022)).5 Our paper contributes to this literature by studying the interaction
   4
     Similar mixed evidence is also found for other types of ads. While some research shows that consumers value
informative advertising, such as for ads in Yellow Pages (Rysman (2004)), in magazines (Kaiser and Song (2009)),
and on TV (Tuchman et al. (2018)), others show that consumers are annoyed by ads on TV (Wilbur (2016)) and in
music streaming apps (Huang et al. (2018)), and by display ads (Goldstein et al. (2014)), especially when consumers
have privacy concerns (Goldfarb and Tucker (2011)).
   5
     Similar findings in other contexts include restaurants (Jin and Leslie (2003) and Dai and Luca (2020)), e-commerce
marketplaces (e.g., Chevalier and Mayzlin (2006); Park et al. (2021)), review websites (e.g., Luca (2016)), online labor
market (e.g., Barach et al. (2020)), and food choices (e.g., Bollinger et al. (2011) and Bai (2018)).

                                                           4

                        Electronic copy available at: https://ssrn.com/abstract=4155772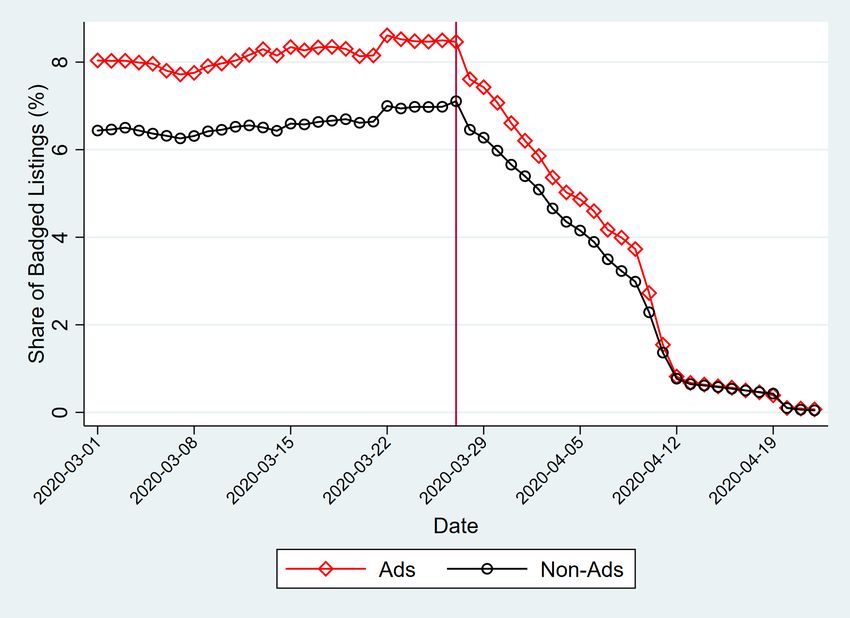
between quality certificates and advertising from the platform’s (or the consumers’) perspective.6
There are a few papers that study related questions from firms’ perspective: Hollenbeck et al. (2019)
study hotels on Tripadvisor and find that those with higher ratings spend less on advertising (off
Tripadvisor) than the lower-rated ones. Dai et al. (2022) show that restaurants that received a free
advertising package on Yelp experienced higher customer purchase intention than those that did
not, and this increase is larger for higher-rated restaurants. While these two papers study firms’
strategy or revenue related to advertising, our paper focuses on how consumers react to advertising
by varying the salience of ad disclosure. Another difference is that the two papers essentially esti-
mate ads’ treatment effect heterogeneity by seller reputation (a covariate), which does not directly
speak to the causal effect of reputation on consumer response to advertising, because a seller’s
reputation is not randomly assigned. In our paper, besides studying ads’ heterogeneous treatment
effect, we also manipulate consumers’ knowledge about a seller’s reputation information using the
system glitch and estimate how the causal effect of quality certificates differs by ad vs. non-ad
listings. Our results indicate that the value of the quality certificate is greater for ads than for
non-ads, which suggests that platforms should highlight quality signals to improve ad performance.
        Lastly, our paper is also related to the large literature on the effectiveness of sponsored search
ads for individual advertisers (e.g., Blake et al. (2015); Dai et al. (2022); Johnson et al. (2017)).
Instead of taking the perspective of individual sellers, we focus on the site-wide effect of ad disclosure
by manipulating the disclosure of all active ads, as discussed before. Also, our paper is related to
the literature on the design of sponsored search ads, such as rules to efficiently allocate ad slots
(Athey and Ellison (2011), Yao and Mela (2011), Choi and Mela (2019)) and the role of positions
and ranking (Ghose et al. (2014), Narayanan and Kalyanam (2015), Jeziorski and Moorthy (2018),
Ursu (2018)). In particular, our paper speaks to issues regarding native ads (Aribarg and Schwartz
(2020), Sahni and Nair (2020b), Revel et al. (2021)). Our findings imply that platforms could
gain revenue from less salient ad disclosure (i.e., more native), although we cannot extrapolate the
results to extreme cases of non-disclosure, or speak to the long-term effect.

3        Background

In this section, we describe eBay’s sponsored search advertising and the eBay Plus program. On
eBay, after consumers type in search queries, they see a search results page with both sponsored
    6
     Prior work has studied the interaction between quality certificates and other mechanisms on digital platforms,
e.g., peer ratings (Farronato et al. (2020)), logistic signals (Hui et al. (2020)), and buyer warranty (Hui et al. (2016)).

                                                            5

                        Electronic copy available at: https://ssrn.com/abstract=4155772
listings (i.e., ads) and organic listings (i.e., non-ads). Their ranking is based on a score that depends
on the quality of the listing, which is proprietary to eBay and is correlated with click-through rates,
and the ad rate submitted by sellers. The ad rate is a bid between 0 and 100% submitted by the
seller, representing a fraction of sales price (0% corresponds to non-ad listings). eBay uses a “cost
per action” pricing mechanism for advertising during our sample period: a seller pays for an ad
only if that listing sells. Another feature on eBay’s sponsored advertising is that a listing appears
at most once on a search results page either as an ad or non-ad. The two types look the same
except that ad listings carry a “Sponsored” badge on search results pages, as shown in Figure 2.
Non-ad listings have a blank spot instead.
       The eBay Plus program was introduced in June 2018 on the eBay Australia website. The
program is a combination of a quality certification program for sellers and a loyalty program for
buyers. To issue quality certificates, eBay conducts a monthly seller evaluation and privately labels
sellers Top Rated Seller if they meet some predetermined requirements based on historical sales
and measured quality.7 Top Rated Sellers can then get a public, listing-level eBay Plus badge if
they offer one-day handling and free shipping, accept returns, and meet some other requirements
for the product on that listing.8 The eBay Plus badge appears on search results pages as shown
in Figure 1 (Top Rated Seller status does not), and sellers can potentially benefit from this trust
signal.9 To summarize, eBay Plus is a listing-level quality certificate awarded to sellers who have
passed some minimum thresholds of historical sales and measured quality, and offer good logistic
service on a listing.
       The eBay Plus program is also a loyalty program for buyers. Specifically, buyers can join it
by paying an annual membership fee of AUD $49. The members enjoy three benefits: they can
(1) upgrade the shipping of eBay Plus items to express delivery for free if sent to a metropolitan
address; (2) get a $5 voucher every month to spend on eBay Plus items; (3) get free returns on
eBay Plus items. All buyers, regardless of their membership status, see the eBay Plus badge on the
website. However, because the eBay Plus badge is not just a quality signal, we also use the same
   7
      More specifically, in terms of historical sales, a seller needs to have at least 100 transactions and AUD $1000 in
sales on the eBay Australia site in the past year. In terms of measured quality, a seller needs to have no more than
0.3% transactions with unresolved buyer claims, no more than 0.5% of transactions with unresolved buyer claims or
seller-initiated cancellations, and no more than 5% of transactions with late shipment in the previous year.
    8
      The other requirements are that the listing should be shipped from and be returnable to addresses within
Australia, be in fixed price format, and be not too heavy or bulky. To be eligible for the badge, sellers also need to
upload tracking information for at least 95% of their eBay Plus orders.
    9
      Besides the signaling value of eBay Plus, its other benefits are (1) buyers can exclusively shop for eBay Plus items
if they use a filter toggle; (2) sellers enjoy additional seller protection: eBay removes buyer feedback if the buyer is
found to be abusive, and removes feedback on late shipment due to factors outside sellers’ control; (3) sellers can get
an express shipping cost refund up to AUD $4.

                                                            6

                        Electronic copy available at: https://ssrn.com/abstract=4155772
Figure 1: eBay Plus Badge on a Search Results Page
field experiment done on the eBay United States site, and use the eBay Top Rated Plus badge,
which is a quality certificate but not a loyalty program, as a robustness check for the main results.
4 Field Experiment on Ad Disclosure
4.1 Consumer Response to Sponsored Search Ads
To estimate consumer response to search ads, the ideal experiment would be to manipulate ad
disclosure on product listings on search results pages across consumers while holding the ordered
list of products fixed. Because sponsored search advertising had existed on eBay long before the
study period, results from this ideal experiment would inform us of consumer preference for ads
(at the margin) in the equilibrium where sellers have chosen their optimal level of advertising and
consumers correctly anticipate this. However, this experiment is not feasible in many countries
because ad disclosure is mandatory by law. To our knowledge, Sahni and Nair (2020a) and Sahni
and Nair (2020b) are rare exceptions that randomize ad disclosure on a restaurant platform in Asia,
where such laws are absent. Instead, we exploit a field experiment that can arguably approximate
the ideal experiment. Between August 29, 2020, and September 11, 2020, eBay randomized (at the
user level) the case type of the word “sponsored” displayed on ad listings on the search results page.
Specifically, during the experimental period, users in the control group experienced less salient ad
disclosure and saw “Sponsored” in regular capitalization (Figure 2, left). There was no such change
for consumers in the treatment group, who saw “SPONSORED” in all caps just like before the
experiment (Figure 2, right). We refer to the no-change group as the treatment group because we
want to study the effect of more salient ad disclosure. This experiment was designed under the
assumption that consumers are more likely to notice ad disclosure in all caps. All other aspects
are the same across the two groups. Lastly, the same experiment was implemented on four eBay
7
Electronic copy available at: https://ssrn.com/abstract=4155772Figure 2: Field Experiment on the Salience of Ad Disclosure
sites: Australia (AU), Germany, UK, and US sites. Our main analyses focus on the experiment on
the AU site because our second, natural experiment took place on this site. That said, we use the
experiment on the US site for the robustness analysis.
As mentioned, the randomization is done at the user level, where a user is defined as a cookie.10
Specifically, the first 3.5 million users who interact with the eBay AU website on the first day of
the experiment enter the experiment and have a 50% chance of being assigned to the treatment or
the control group. The users then retain their initial assignment throughout the experiment.
In Table 1, we check if baseline balance holds in our experiment. We compare the treatment
and control users on a set of covariates measured based on the three months before the start of the
experiment, by regressing each of the covariates on the treatment dummy. We find that control
group users on average have 5.7 search sessions, spend 164.8 seconds on the website, complete 0.8
transactions, buy 1 unit of product, and spend AUD $30.6.11 Across these measures, we do not
find statistically significant differences between treatment and control users, consistent with a valid
randomization.
To estimate the treatment effect of more salient ad disclosure, we leverage the following cross-
sectional regression:
Yi = α + βT reati + ϵi , (1)
where Yi is the outcome of user i for the entire experimental period; T reati is the treatment
dummy that equals 1 for the treatment group and 0 for the control group; and ϵi is the user specific
idiosyncratic error term. Our coefficient of interest β measures the average treatment effect of
10
Technically, a user can have multiple cookies if they access eBay from multiple devices or if they clear their
cache on the browsers. Lin and Misra (2022) show that cookie-level randomization can over- or under-estimate the
treatment effect at the user level. The good news is that more than 85% of users have only one cookie during the
experiment, so the fragmentation bias is likely small in our setting.
11
The numbers correspond to users in the experiment, which represent a fraction of users on the eBay AU site.
8
Electronic copy available at: https://ssrn.com/abstract=4155772Table 1: Baseline Balance
(1) (2) (3) (4) (5)
Number of Session Duration Number of Quantity Spending
Sessions in Seconds Transactions Bought in AUD
Treat -0.002 -0.582 -0.002 -0.001 -0.242
(0.018) (0.897) (0.004) (0.005) (0.217)
Constant 5.706*** 164.772*** 0.844*** 1.034*** 30.583***
(0.012) (0.635) (0.003) (0.004) (0.154)
Observations 3,561,581 3,561,581 3,561,581 3,561,581 3,561,581
R-squared 0.000 0.000 0.000 0.000 0.000
Notes: Outcome variables are users’ covariates measured based on the three months
before the experiment. One observation is a user. Standard errors in parentheses. ***
pin Table 1 as covariates, specifically, the pre-experiment search sessions, session duration, number
of transactions, quantities purchased, and spending. Table A1 reports qualitatively similar results
after covariate adjustment.
Overall, results in Table 2 suggest that more salient ad disclosure causes consumers to substitute
away from ad listings and click and buy from organic listings. The results suggest that consumers
dislike ads, a finding that is consistent with the one in Moshary (2021). As discussed in Section 2,
a notable feature of our experiment is that we preserve ordered lists of products on search results
pages and vary only the salience of ad disclosure. The consistent results from the two papers
strongly suggest consumers’ ads aversion in our empirical setting.
4.2 Heterogeneous Treatment Effects by Certification Status
Given consumers’ aversion towards ads, we now study ways to improve ad performance, and,
specifically, the role of quality certificates. To do so, we first analyze how consumers’ ad aversion
differs by the existence of the eBay Plus badge (henceforth, the badge). Specifically, we use the
experiment to identify the heterogeneous treatment effects of increasing the salience of ad disclosure
across the four types of listings (defined as their ad status by badge status) in users’ first search
sessions after the beginning of the experiment. We focus on the first session of each user because
what users see in subsequent sessions may be affected by users’ reactions to their initial ad exposure,
which makes the results for subsequent sessions difficult to interpret.
Table 3 reports the results based on Equation 1 on ads and non-ads in Part I and Part II,
respectively. In each panel, we report treatment effect estimates on number of clicks, purchases,
and sales for badged and non-badged listings. The last two rows of each panel report the treatment
effects as a percentage change over the baseline (i.e., β/α) and the p-value of the test of equality
of two percentage changes between the badged and non-badged listings. Comparing columns (1)
and (2), we find that ads–non-badged listings experience a significant drop in clicks (-19.6%), while
ads-badge listings’ experience an increase in clicks (10.2%, not statistically significant), although
the difference in the two percentage changes is statistically insignificant. Columns (3) and (4) show
a drop in purchases for both ads-badged and ads–non-badged listings, with ads–non-badged listings
experiencing a greater drop in percent terms (-4.5% vs. -23.5%), and the difference has a p-value
of 0.107. Lastly, we find similar results on sales in columns (5) and (6), where the sales drop in
ads–non-badged listings is 18.7%, while the drop in ads-badged listings is statistically insignificant,
at 6.8%. In addition, the percentage drop in ads–non-badged listings is significantly greater than
10
Electronic copy available at: https://ssrn.com/abstract=4155772Table 3: Heterogeneous Treatment Effects of More Salient Ad Disclosure by Certification Status
Part I. Ads
(1) (2) (3) (4) (5) (6)
Number of Clicks Number of Purchases Sales in AUD
Badged Non-Badged Badged Non-Badged Badged Non-Badged
Treat 0.009 -0.031** -0.001 -0.003** -0.011 -0.044***
(0.019) (0.014) (0.001) (0.001) (0.008) (0.007)
Constant 0.092*** 0.158*** 0.013*** 0.013*** 0.167*** 0.238***
(0.014) (0.010) (0.001) (0.001) (0.006) (0.005)
Observations 1,526,673 3,352,982 1,526,673 3,352,982 1,526,673 3,352,982
R-squared 0.000 0.000 0.000 0.000 0.000 0.000
Percentage change 10.2% -19.6% -4.5% -23.5% -6.8% -18.7%
Equality of percentage changes p=0.178 p=0.107 p=0.033
Part II. Non-Ads
(7) (8) (9) (10) (11) (12)
Number of Clicks Number of Purchases Sales in AUD
Badged Non-Badged Badged Non-Badged Badged Non-Badged
Treat 0.004 0.055 0.001*** 0.002* 0.012 0.015
(0.005) (0.047) (0.000) (0.001) (0.009) (0.018)
Constant 0.108*** 0.448*** 0.012*** 0.026*** 0.247*** 0.726***
(0.004) (0.033) (0.000) (0.001) (0.006) (0.013)
Observations 2,293,925 3,514,870 2,293,925 3,514,870 2,293,925 3,514,870
R-squared 0.000 0.000 0.000 0.000 0.000 0.000
Percentage change 3.7% 12.3% 12.7% 8.5% 5.0% 2.0%
Equality of percentage changes p=0.461 p=0.529 p=0.516
Notes: Results based on Equation 1. One observation is a user. Standard errors in parentheses. *** presults are driven by the quality certification role, we repeat the analyses using the same experiment
done on the eBay US site. On the US site, the corresponding listing-level badge is Top Rated Plus.
This badge and eBay Plus have very similar requirements, but Top Rated Plus is a pure quality
certification program.12
Table A2 in the appendix reports the results. Again, we find that the negative effect on clicks,
purchases, and sales from more salient ad disclosure is less negative for ad listings with the Top
Rated Plus badge than for ad listings without it (-18.2% vs. -19.6%, -13.6% vs. -18.8%, -8.4%
vs. -14.5%, respectively; p-value of the difference in the percent effect is 0.081 for sales). For non-
ads, there is generally a positive effect on the outcomes because consumers substitute away from
ad listings and click on and buy more non-ad listings instead. In particular, the positive spillover
effect in terms of percentage changes on clicks and purchases is significantly higher for eTRS listings
than for non-eTRS listings. The qualitatively similar results on the two sites strongly suggest that
quality certificates alleviate the extent to which consumers dislike ads in our setting.
5 Natural Experiment on a Quality Certificate
In the previous section, we leveraged a field experiment that manipulates the salience of ad disclo-
sure. Our evidence so far suggests consumer aversion to sponsored search ads, as well as a reduced
aversion if ads are badged and perceived as high quality by consumers. However, a concern with
the heterogeneous treatment effects by a listing’s quality certification status is that a listing’s badge
status is not randomly assigned and therefore cannot be interpreted causally. In this section, we
strengthen our results by providing evidence from a natural experiment that exogenously removes
quality certificates from the entire market.
Specifically, we leverage a system glitch on the eBay AU site in March 2020 that eradicated the
eBay Plus badge from all listings in a three-week window: The share of badged listings decreases
quickly after March 27, 2020, shrinking by half in two weeks and disappearing in the third week.
The system glitch happened because eBay AU wanted to change the requirements for the eBay Plus
program (from eBay Plus 1.0 to eBay Plus 2.0), but instead it accidentally eliminated the eBay
12
Specifically, eBay evaluates sellers monthly and privately labels sellers as Top Rated Seller if they have a minimum
of $1,000 in sales and 100 transactions in the past 12 months, no more than 0.3% of transactions with unresolved
buyer claims, no more than 0.5% of transactions with unresolved buyer claims or seller-initiated cancellations, and no
more than 3% of transactions with late shipment in the previous year. Top Rated Sellers receive a public Top Rated
Plus badge on a listing if it offers one day or less handling time and 30-day or longer returns with the money-back
option. There are two benefits of this badge: it has a signalling value to consumers and sellers get a 5% discount on
the commission rate charged by eBay.
12
Electronic copy available at: https://ssrn.com/abstract=4155772Plus badge for all listings in the three weeks after March 27, 2020, and the switch to eBay Plus 2.0
was successful, with the badge starting to reappear from the fourth week after March 27, 2020. The
technical glitch affected only the certification badge, not anything else. For example, the search
ranking algorithm is not a direct function of the certification badge, and therefore eliminating the
eTRS Plus badge does not change the ranking of a product listing—a feature that we exploit later
for a matching analysis.
We first check the claimed exogeneity of the technical glitch by plotting the time series of the
share of badged listings separately for ads and non-ads. Figure 3 shows similar decreases in the
share of badged listings for both ad and non-ad listings. In addition, we plot the share of badged
listings for some of the most searched keywords on the eBay AU website. Figure 4 shows that while
these keywords differ in their ex ante share of badged listings, the share goes down immediately
after March 27, 2020, and becomes 0 for all keywords in three weeks. Results from both figures
are consistent with the system glitch being an exogenous shock that is uncorrelated with listing or
product types. This increases our confidence on the claim on the exogeneity of the technical glitch,
and therefore the credibility of using this natural experiment to identify the effect of the quality
certificate on ad effectiveness.
Figure 3: Share of Listings with eBay Plus, Ads vs. Non-ads
How does the removal of badges affect ads and non-ads differently? In Figure 5, we plot the time
series of purchase-through rate (PTR hereafter) of listings that were badged before the technical
glitch, separately for ads and non-ads.13 The PTR of a listing is defined as the number of purchases
13
As Figure 3 shows, the share of listings that are badged before the glitch is approximately 8.5% for ads and 7%
13
Electronic copy available at: https://ssrn.com/abstract=4155772Figure 4: Share of Listings with Quality Certificate, Most Popular Keywords
per 1000 user impressions. To plot the graph, we normalize the PTR of ads and non-ads by their
respective values on the day before the technical glitch (i.e., March 26, 2020). This normalization
facilitates the interpretation of changes in percentage terms, and masks the raw values to preserve
the data confidentiality. We find that ad and non-ad listings follow similar time trends before the
system glitch, but that a gap appears immediately after the glitch. In particular, ad PTR decreases
compared to non-ad PTR. We take this as model-free evidence that the quality certificate benefits
ads relative to its effect on non-ads.
We adopt a DiD analysis to quantify the differential effect of badge removal between ads and
non-ads. Essentially, the DiD specification compares the before-after change in ad PTR and non-ad
PTR. The estimation sample is the same one used in Figure 5 (i.e., at the listing type-by-day level,
where the listing type is either ads or non-ads). On the right hand side of the regression, we include
an indicator for ad listings, its interaction with the post dummy (i.e., on or after March 27, 2020),
and date fixed effects. Regression results are reported in column 1 of Table 4: after the glitch, the
drop in ad PTR is 14.2 percentage points larger than the percentage drop in non-ad PTR.
One potential concern is that the above estimate may be driven by selection bias. For example,
the advertising decision is a seller choice. It is possible that as badges are being erased, high-quality
sellers advertise less, which could potentially explain the widening gap in PTR over time. This
for non-ads. In this analysis, we focus on listings that are badged before the glitch because we are interested in the
effect of badge removal for ads and non-ads.
14
Electronic copy available at: https://ssrn.com/abstract=4155772Figure 5: Differential Effect of Removing Quality Certificate: Ads vs. Non-Ads
Table 4: Differential Effect of Certificate Badge Removal: Ads vs. Non-Ads
(1) (2)
Purchase-through Rate Purchase-through Rate
Ads -0.000 -0.002
(0.007) (0.009)
Lost badge -0.007
(0.009)
Ads×Post -0.142*** -0.006
(0.009) (0.013)
Ads×Lost badge -0.002
(0.013)
Lost badge×Post -0.069***
(0.013)
Ads×Lost badge×Post -0.066***
(0.018)
Constant 0.996*** 0.955***
(0.003) (0.005)
Observations 106 212
R-squared 0.954 0.864
Date Fixed Effects Yes Yes
Notes: Outcome variable is the number of purchases per 1000 user impressions. One obser-
vation is a listing type-by-day in column 1 and is a listing type-by-ads-by-day in column 2.
Standard errors in parentheses. *** pmotivates us to focus on listings that existed on Day -1 (i.e., March 26th, 2020), and track the PTR
of these listings only, in order to avoid the dynamic selection of new listings after the glitch, whose
ad status can be an outcome of the glitch. Results based on the refined sample remain similar.
Besides the regression specification used in column 1 of Table 4, we also leverage an alternative
specification that compares contemporaneous changes in outcomes from listings that immediately
lost their badge after the system glitch with listings that lost their badge later on. The idea is as
follows: if the drop in PTR after the system glitch is indeed driven by fewer badges on the search
results page, then it follows that we should see a larger impact from listings that have already lost
their badge compared to those that have not yet lost their badge. To test this necessary condition
empirically, we distinguish existing listings that lost their badge in the first week after the glitch
from existing listings that did not lose their badge in the first week after the glitch (but will lose
it after the first week).14 In Figure 6, we report the time series of the average PTR of the four
listing types: listings that were badged (in the first week after the glitch) and listings that lost
the badge in the first week, by the listing’s ad status. We make two observations from this graph.
First, regardless of ad status, listings that lost their badge are hurt more compared to those that
had not lost their badge yet (hallow dots vs. solid dots). Second, the above-mentioned difference
is larger for ads than for non-ads, given that the drop from “ads, badge” to “ads, lost badge” is
bigger than the drop from “non-ads, badge” to “non-ads, lost badge”.
Figure 6: Differential Effects of Removing Quality Certificate: Badged vs. Lost Badge, by Ads
14
As robustness checks, we also change the time window to two weeks or three weeks to define lost badges or not.
We find very similar patterns across alternative time windows.
16
Electronic copy available at: https://ssrn.com/abstract=4155772To quantify the differential effects between ads and non-ads, we estimate a DiD regression with
a three-way interaction. The estimation results are reported in column 2 of Table 4. Among non-ad
listings, the glitch causes an additional 6.9 percentage point drop in PTR for listings that lost their
badge (relative to those that had not lost their badge yet). For ad listings, this additional drop is
almost twice as large (13.5 percentage points) and statistically significant.
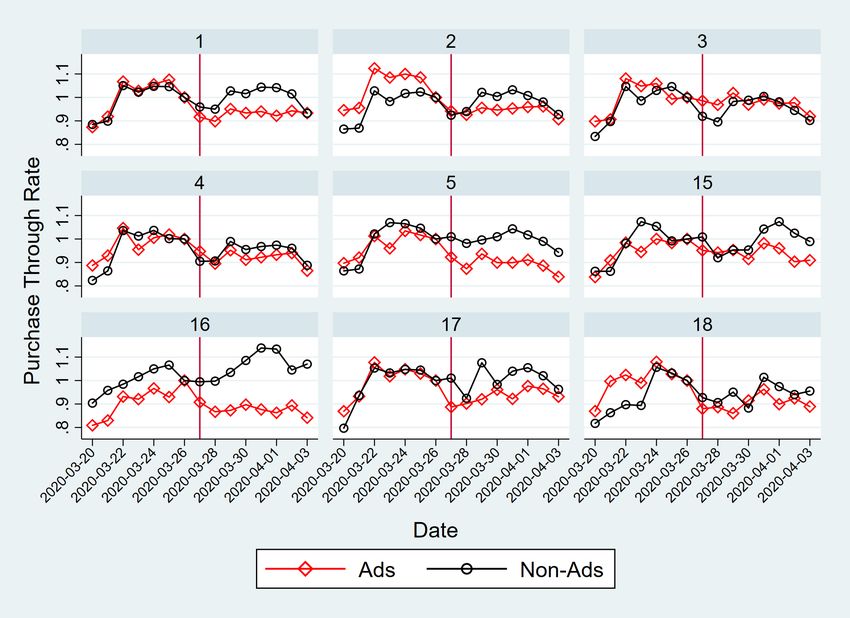
Figure 7: Differential Effects of Removing Quality Certificate: Ads vs. Non-Ads, by Search Rank
Next, since ad listings typically occupy better positions on search results pages than non-ad
listings do, one potential concern is that our results may be explained by the effect of rank alone,
instead of consumer aversion to ads. That is, it is possible that better-ranked listings are hurt more
when quality certificates are removed. To verify if this alternative explanation holds in our context,
we contrast the average PTR of ads and non-ads, by rank, and report the time trends in Figure
7. For example, the first sub-figure shows the average PTR if the top ranked listing is an ad vs.
non-ad. For each rank, both time series are normalized by their respective values at Day -1. We
report only rank 1–5 and rank 15–18 because these ranks have both ad and non-ad listings.
Figure 7 shows that across ranks, ad and non-ad listings generally follow similar pre-trends, but
ad listings seem to have a decreased PTR after the onset of the technical glitch to eBay Plus. That
is, when we hold the rank constant, we still observe a more negative shock of removing the quality
certificate to ad listings than to non-ad listings, suggesting that ad aversion is due to consumer
perception of ads as a quality signal, instead of ad listings being better ranked.
17
Electronic copy available at: https://ssrn.com/abstract=41557725.1 A Matching Approach
The results so far are based on data aggregated across many search sessions within the coarse
categorization of ads by badge. Next, we conduct an analysis at a more granular level, which allows
us to adjust for session-level characteristics when estimating the impact of quality certificates on
ads and non-ads.
Specifically, we match sessions (i.e., search result pages) during the sample period, where they
are identical in the following aspects: (1) the search keywords, (2) the returned ordered list of search
results, (3) the ad status in each search position, and (4) the price of each listing. We restrict the
matches to meet the above-mentioned conditions for the first 15 listings 15 , and we use these first
15 listings of a session in the sample. We allow the matches to differ only in the number of listings
with badges. Figure 8 provides an example of two matched sessions, where one session has three
badges (Figure 8a) and the other has only one (Figure 8b). Essentially, this strict matching of
search results sessions allow us to hold many things constant, such as the exact listings, the rank
order, ad status, and prices, while varying only the badge count by the sudden removal of the badge
due to the glitch. This way we are able to more cleanly identify the badge effect on ad effectiveness.
That said, we note a few caveats for this matching-based method. First, since it took three
weeks for all the badges to be eliminated during the system glitch, our matched sessions are typically
from different days, which makes this method essentially an event study analysis. This means that
even though the matched sessions are usually just one or two days apart, we still need to take into
consideration the possible time trend across days. Given this, we keep only matches whose sessions
are one day apart from each other. The second caveat is that estimation from the matched sample
gives more weight to standardized products, such as consumer electronics, because they are more
likely to be matched given our strict matching criteria, compared to heterogeneous products such as
collectibles. Lastly, the matching is done only on the first 15 listings of each search result, because
of a tradeoff between matching precision and statistical power.
Using the matched search sessions approach, we study the badge effect on the number of clicks,
purchases, and sales at the session level by ads. This is done by regressing the outcome variables
on the number of badges in ad listings and the number of badges in non-ad listings, controlling for
match fixed effects. Essentially, we exploit the variation in ads-badges and non-ads-badges within
15
But listings down the list could meet these conditions as well. We choose the cutoff at 15 listings so that we have
good sample size. Out of all search sessions with a sale, the first 15 positions on the first search result page account
for 75% of all sales (in AUD) based on the data from the month before the start of our experiment.
18
Electronic copy available at: https://ssrn.com/abstract=4155772(a) (b)
Figure 8: An Example of Matched Search Results Sessions
the matched sessions. Regression results are reported in Table 5. First, we find that the presence of
badges in ad listings boosts the sales of ad listings, according to columns (1)–(3), but at the same
time it reduces the sales of non-ad listings, as seen in columns (4)–(6). We interpret this as direct
evidence that when ads have quality certificates, consumers are willing to buy more ad listings and
buy fewer non-ad listings. However, when we increase the badges in non-ads, we see that ad clicks
and purchases are increased, but non-ad listings’ sales are not increased. This spillover effect is
interesting because normally one would think that ad listings and non-ad listings are competitors,
so giving one side quality signals will naturally lead to fewer sales of the other. However, the
results suggest that quality signals in non-ad listings can help ad listings better. This can happen
if consumers are uncertain about the quality of ad listings, so when their competitors (i.e., non-ad
listings) are of high quality, consumers may update their belief on the quality of ad listings and
buy more of them instead. This is similar to the findings that ads may cause a positive spillover
effect to competitors in Sahni (2016). Taken together, evidence suggests that ad listings, as well as
non-ad listings, can benefit greatly from certification badges.
19
Electronic copy available at: https://ssrn.com/abstract=4155772Table 5: Matched Search Sessions: Effect of Badges in Ad Listings and Non-Ad Listings
(1) (2) (3) (4) (5) (6)
Ads Non-Ads
Number of Number of Sales Number of Number of Sales
Clicks Purchases in AUD Clicks Purchase AUD
No. Badges in Ads 0.004 0.004*** 0.085** -0.007 -0.003** -0.122**
(0.004) (0.002) (0.036) (0.005) (0.001) (0.051)
No. Badges in Non-Ads 0.010*** 0.003** 0.028 -0.004 -0.000 -0.040
(0.003) (0.001) (0.029) (0.004) (0.001) (0.041)
Matched Session Yes Yes Yes Yes Yes Yes
Fixed Effects
Observations 148,536 148,536 148,536 148,536 148,536 148,536
R-squared 0.304 0.267 0.272 0.281 0.256 0.334
Notes: Results based on matched search sessions, which are identical in search keywords, the returned ordered
list of search results, the ad status in each position, and the price of each listing. One observation is a session.
Standard errors in parentheses. *** pthe search ranking algorithm essentially maximizes two things: click-through rate and some quality
metrics. The weights set on these two metrics can potentially explain the differences in the empirical
findings.17 The third factor is the fee structure of ads, e.g., whether it is based on cost-per-click
(CPC) or cost-per-action (CPA), which can affect the composition of advertisers in equilibrium,
thereby affecting sales.18 Lastly, another thing that could affect consumer response towards ads is
the platform’s rule on duplicate listings, which defines whether an organic listing promoted to ads
still appears in its original position in the list of organic search results. This design choice could
affect consumers’ inference about ad quality by being able (or not) to observe its organic ranking,
and hence affect their search and purchase decision.19
Because various market institutions can dramatically change consumers’ response towards ad-
vertising, managers and policy makers need careful measurement of this parameter on a case-by-case
basis as a first step towards effective management or policy regulation, instead of assuming that
this parameter will be qualitatively the same across all settings. We leave empirical evaluations of
the different mechanism designs for future work.
The second implication from our work is that in settings where consumers dislike sponsored
search advertising, quality certificates can mitigate consumers’ aversion towards ads and increase
ad sales. Since search advertising has been comprising a larger share of business revenue, ad
publishers and platform managers should consider highlighting quality signals, such as reputation
signals, to improve ad performance. Other types of signals, such as on good deals, fast shipping,
and seller warranties, may also interact with advertising. We leave these topics for future work.
and shoes categories, a finding that is likely explained by the amount of asymmetric information between the seller
of the products and the platform. Also, the finding in Yang et al. (2021) that advertising can disproportionately help
new products is also consistent with its informative role.
17
The optimal weight would depend on the search engine’s revenue model and its discount factor, i.e., its relative
value on the incremental revenue from each click today versus higher revenue from repeated user interactions with
the platform in the future due to high-quality clicks.
18
As argued in Choi and Mela (2019), CPC incentivizes high-quality sellers to advertise, because their high conver-
sion rate will justify the high per-click fees. On the other hand, CPA may incentivize more bidding from low-quality
sellers, because they do not need to pay any fee unless the product is sold. Long et al. (2022) study a related
question on setting optimal ad fees taking into account the information learned from sellers’ advertising bids. In
the previous literature, the platform in Sahni and Nair (2020a) uses CPC, and the platform in Moshary (2021) uses
CPA. Therefore, the difference in the signalling effect of ad disclosure could potentially be explained in part by the
different advertiser pools on the two platforms.
19
For example, in Sahni and Nair (2020a), duplicate listings are allowed, whereas in Moshary (2021), they are not
allowed. This means that buyers can infer the quality of the advertiser in the first setting by observing the position
of the organic listing (corresponding to the ads) in the list of organic search results. This then could give rise to a
positive signaling value of ad disclosure, which captures quality information that is not observed by the platform.
21
Electronic copy available at: https://ssrn.com/abstract=4155772References
Abhishek, V., K. Jerath, and S. Sharma (2022). The impact of sponsored listings on online mar-
ketplaces: Insights from a field experiment. Available at SSRN 3013468 .
Aribarg, A. and E. M. Schwartz (2020). Native advertising in online news: Trade-offs among clicks,
brand recognition, and website trustworthiness. Journal of Marketing Research 57 (1), 20–34.
Athey, S. and G. Ellison (2011). Position auctions with consumer search. The Quarterly Journal
of Economics 126 (3), 1213–1270.
Bai, J. (2018). Melons as lemons: Asymmetric information, consumer learning and quality provi-
sion. Technical report, Working paper.
Barach, M. A., J. M. Golden, and J. J. Horton (2020). Steering in online markets: the role of
platform incentives and credibility. Management Science.
Blake, T., C. Nosko, and S. Tadelis (2015). Consumer heterogeneity and paid search effectiveness:
A large-scale field experiment. Econometrica 83 (1), 155–174.
Bollinger, B., P. Leslie, and A. Sorensen (2011). Calorie posting in chain restaurants. American
Economic Journal: Economic Policy 3 (1), 91–128.
Cabral, L. and A. Hortacsu (2010). The dynamics of seller reputation: Evidence from ebay. The
Journal of Industrial Economics 58 (1), 54–78.
Chevalier, J. A. and D. Mayzlin (2006). The effect of word of mouth on sales: Online book reviews.
Journal of marketing research 43 (3), 345–354.
Choi, H. and C. F. Mela (2019). Monetizing online marketplaces. Marketing Science 38 (6), 948–972.
Dai, D., H. Kim, and M. Luca (2022). Which firms gain from online advertising? evidence from a
field experiment. Working Paper .
Dai, W. and M. Luca (2020). Digitizing disclosure: The case of restaurant hygiene scores. American
Economic Journal: Microeconomics 12 (2), 41–59.
Dellarocas, C. (2003). The digitization of word of mouth: Promise and challenges of online feedback
mechanisms. Management science 49 (10), 1407–1424.
Dranove, D. and G. Z. Jin (2010). Quality disclosure and certification: Theory and practice. Journal
of Economic Literature 48 (4), 935–63.
Einav, L., C. Farronato, and J. Levin (2016). Peer-to-peer markets. Annual Review of Economics 8,
615–635.
Elfenbein, D. W., R. Fisman, and B. McManus (2015). Market structure, reputation, and the value
of quality certification. American Economic Journal: Microeconomics 7 (4), 83–108.
Farronato, C., A. Fradkin, B. Larsen, and E. Brynjolfsson (2020). Consumer protection in an online
world: An analysis of occupational licensing. Technical report, National Bureau of Economic
Research.
22
Electronic copy available at: https://ssrn.com/abstract=4155772Ghose, A., P. G. Ipeirotis, and B. Li (2014). Examining the impact of ranking on consumer behavior
and search engine revenue. Management Science 60 (7), 1632–1654.
Goldfarb, A. and C. Tucker (2011). Online display advertising: Targeting and obtrusiveness.
Marketing Science 30 (3), 389–404.
Goldstein, D. G., S. Suri, R. P. McAfee, M. Ekstrand-Abueg, and F. Diaz (2014). The economic
and cognitive costs of annoying display advertisements. Journal of Marketing Research 51 (6),
742–752.
Hollenbeck, B., S. Moorthy, and D. Proserpio (2019). Advertising strategy in the presence of
reviews: An empirical analysis. Marketing Science 38 (5), 793–811.
Huang, J., D. Reiley, and N. Riabov (2018). Measuring consumer sensitivity to audio advertising:
A field experiment on pandora internet radio. Available at SSRN 3166676 .
Hui, X., G. Z. Jin, and M. Liu (2022). Designing quality certificates: Insights from ebay. Technical
report, National Bureau of Economic Research.
Hui, X., M. Liu, and T. Chan (2020). Targeted incentives, broad impacts: Evidence from an
e-commerce platform. Broad Impacts: Evidence from an E-commerce Platform (October 11,
2020).
Hui, X., M. Saeedi, Z. Shen, and N. Sundaresan (2016). Reputation and regulations: Evidence
from ebay. Management Science 62 (12), 3604–3616.
Jeziorski, P. and S. Moorthy (2018). Advertiser prominence effects in search advertising. Manage-
ment science 64 (3), 1365–1383.
Jin, G. Z. and P. Leslie (2003). The effect of information on product quality: Evidence from
restaurant hygiene grade cards. The Quarterly Journal of Economics 118 (2), 409–451.
Johnson, G. A., R. A. Lewis, and E. I. Nubbemeyer (2017). Ghost ads: Improving the economics
of measuring online ad effectiveness. Journal of Marketing Research 54 (6), 867–884.
Joo, M., J. Shi, and V. Abhishek (2021). Seller incentives in sponsored product listings on online
marketplaces. Available at SSRN 3896716 .
Kaiser, U. and M. Song (2009). Do media consumers really dislike advertising? an empirical
assessment of the role of advertising in print media markets. International Journal of Industrial
Organization 27 (2), 292–301.
Lin, T. and S. Misra (2022). Frontiers: the identity fragmentation bias. Marketing Science 41 (3),
433–440.
Long, F., K. Jerath, and M. Sarvary (2022). Designing an online retail marketplace: Leveraging
information from sponsored advertising. Marketing Science 41 (1), 115–138.
Luca, M. (2016). Reviews, reputation, and revenue: The case of yelp. com. Com (March 15, 2016).
Harvard Business School NOM Unit Working Paper (12-016).
Milgrom, P. and J. Roberts (1986). Price and advertising signals of product quality. Journal of
political economy 94 (4), 796–821.
23
Electronic copy available at: https://ssrn.com/abstract=4155772Moshary, S. (2021). Sponsored search in equilibrium: Evidence from two experiments. Available
at SSRN 3903602 .
Narayanan, S. and K. Kalyanam (2015). Position effects in search advertising and their moderators:
A regression discontinuity approach. Marketing Science 34 (3), 388–407.
Nelson, P. (1974). Advertising as information. Journal of political economy 82 (4), 729–754.
Park, S., W. Shin, and J. Xie (2021). The fateful first consumer review. Marketing Science.
Resnick, P., R. Zeckhauser, J. Swanson, and K. Lockwood (2006). The value of reputation on ebay:
A controlled experiment. Experimental economics 9 (2), 79–101.
Revel, M., A. Tohidi, D. Eckles, A. Jadbabaie, et al. (2021). Native advertising and the credibility
of online publishers.
Rysman, M. (2004). Competition between networks: A study of the market for yellow pages. The
Review of Economic Studies 71 (2), 483–512.
Saeedi, M. (2019). Reputation and adverse selection, theory and evidence from ebay. RAND
Journal of Economics.
Sahni, N. S. (2016). Advertising spillovers: Evidence from online field experiments and implications
for returns on advertising. Journal of Marketing Research 53 (4), 459–478.
Sahni, N. S. and H. S. Nair (2020a). Does advertising serve as a signal? evidence from a field
experiment in mobile search. The Review of Economic Studies 87 (3), 1529–1564.
Sahni, N. S. and H. S. Nair (2020b). Sponsorship disclosure and consumer deception: Experimental
evidence from native advertising in mobile search. Marketing Science 39 (1), 5–32.
Sahni, N. S. and C. Zhang (2019). Are consumers averse to sponsored messages? the role of search
advertising in information discovery.
Simonov, A. and S. Hill (2021). Competitive advertising on brand search: Traffic stealing and click
quality. Marketing Science 40 (5), 923–945.
Tadelis, S. (2016). Reputation and feedback systems in online platform markets. Annual Review
of Economics 8, 321–340.
Tuchman, A. E., H. S. Nair, and P. M. Gardete (2018). Television ad-skipping, consumption
complementarities and the consumer demand for advertising. Quantitative Marketing and Eco-
nomics 16 (2), 111–174.
Ursu, R. M. (2018). The power of rankings: Quantifying the effect of rankings on online consumer
search and purchase decisions. Marketing Science 37 (4), 530–552.
Wilbur, K. C. (2016). Advertising content and television advertising avoidance. Journal of Media
Economics 29 (2), 51–72.
Yang, J., N. S. Sahni, and H. Nair (2021). Advertising as information for ranking e-commerce
search listings. Available at SSRN 3895782 .
Yao, S. and C. F. Mela (2011). A dynamic model of sponsored search advertising. Marketing
Science 30 (3), 447–468.
24
Electronic copy available at: https://ssrn.com/abstract=4155772You can also read