QR Codes on Packaging: A Technology Acceptance Model approach comparing informative and entertaining content - Universidade Católica ...
←
→
Page content transcription
If your browser does not render page correctly, please read the page content below
QR Codes on Packaging: A
   Technology Acceptance Model
approach comparing informative and
       entertaining content.

                      Francesca Ales

Dissertation written under the supervision of Paulo Romeiro

Dissertation submitted in partial fulfilment of requirements for the
    MSc in International Management, at Universidade Católica
Portuguesa and for the MSc in Marketing Management, at Bocconi
                 University, 13th September 2019
ABSTRACT

Title: QR Codes on packaging Acceptance Model: a comparison between informative and
entertaining content.

Author: Francesca Ales

Nowadays the increase of smartphone usage by consumers has led marketers to design new
forms of mobile marketing in order to better connect with them. Among latest marketing trends
smart packaging is emerging as one of the most sought after by brands; in particular, the
incorporation of QR Code on packaging, is the most widespread form. There are many studies
aimed at understanding consumers’ behavior towards QR Code, but previous researches lack
in determining which are the specific drivers related to QR Code applied to packaging. The
present dissertation wants discuss what a QR Code is and which are its applications, together
with exploring the challenges and opportunities faced by QR Codes on packaging. The original
Technology Acceptance Model (Davis, Perceived Usefulness, Perceived Ease of Use, and User
Acceptance of Information Technology, 1989) and its later adaptation (Davis, Bagozzi, &
Washaw, Extrinsic and Intrinsic Motivation to Use Computers in the Workplace’, 1992) were
used in order to build the conceptual framework which includes Perceived Ease of Use,
Perceived Usefulness and Perceived Enjoyment as the independent variables and Intention to
Use as the dependent variable. Results reveal that all the independent variables have a positive
influence on consumers’ Intention to Use QR Codes on packaging, where Perceived Enjoyment
has the strongest impact. Finally, the non-parametric equivalent of the T-test, the Mann-
Whitney U Test, revealed a statistically significant difference in the usage intention of those
respondents that saw the entertaining QR Code and those that saw the informative QR Code,
suggesting that a QR Code on packaging which directs consumers to an entertaining content
leads to increased level of usage intention.
Given the results obtained, this study also discusses possible managerial implications taking
into consideration the limitations that affect the entire study.

Keywords: QR Code, Smart Packaging, E-content, Technology Acceptance Model

                                                                                               I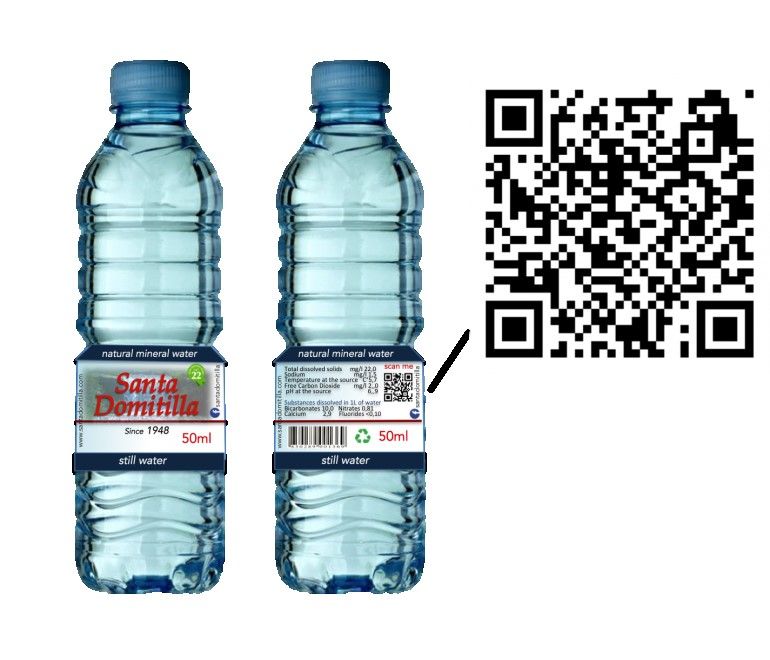
SUMÁRIO

Title: Incorporação de QR Codes em embalagens Acceptance Model: comparação entre
conteúdo informativo e divertido

Author: Francesca Ales

Hoje em dia, o aumento da utilização de smartphones pelos consumidores levou os
comerciantes a conceber novas formas de marketing móvel, a fim de melhor se conectarem com
eles. Uma das últimas tendências é a incorporação de um QR Code na embalagem do produto,
o que é considerado como uma forma de embalagem inteligente. Há muitos estudos que têm
em vista perceber o comportamento dos consumidores em relação ao QR Code, mas faltam
ainda pesquisas anteriores para determinar quais os principais causadores de um tipo específico
de QR Code: o aplicado à embalagem. A presente dissertação pretende discutir o que é um QR
Code e quais são suas aplicações, juntamente com a exploração dos desafios e oportunidades
enfrentados pelos QR Codes em embalagens. O modelo original de Aceitação de Tecnologia
(Davis, Perceived Usefulness, Perceived Ease of Use, and User Acceptance of Information
Technology, 1989) e sua posterior adaptação (Davis, Bagozzi, & Washaw, Extrinsic and
Intrinsic Motivation to Use Computers in the Workplace', 1992) foram usados para construir a
estrutura conceitual que inclui Perceived Ease of Use (facilidade de uso), Perceived
Usefulness (utilidade) e Perceived Enjoyment (nível de divertimento) como as variáveis
independentes e Intention of Use (intenção de uso) como a variável dependente. Os resultados
revelam que todas as variáveis independentes têm uma influência positiva na intenção de
usar Códigos QR na embalagem, onde a variável com maior impacto é o nível de
divertimento. Finalmente, o equivalente não paramétrico do teste T, o teste Mann-Whitney U
Test, revelou uma diferença estatisticamente significativa na intenção de uso dos entrevistados
que viram o divertido QR Code e daqueles que viram o informativo QR Code, sugerindo que
um QR Code na embalagem que direciona os consumidores para um conteúdo divertido leva
ao aumento do nível de intenção de uso.
Tendo em conta os resultados obtidos e todas as suas limitações, este estudo também aborda
possíveis implicações para os gestores.

Keywords: QR Code, Smart Packaging, E-content, Technology Acceptance Model

                                                                                             II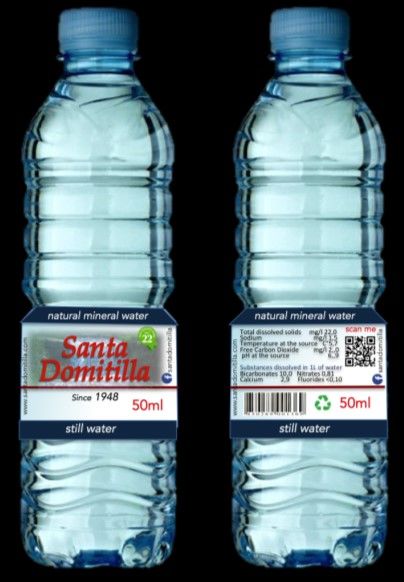
TABLE OF CONTENTS

ABSTRACT                                                                        I

SUMÁRIO                                                                        II

TABLE OF FIGURES                                                                V

TABLE OF TABLES                                                                VI

CHAPTER 1: INTRODUCTION                                                         1
1.1 BACKGROUND                                                                  1
1.2 PROBLEM STATEMENT                                                           1
1.3 RELEVANCE                                                                   2
1.4 RESEARCH METHODS                                                            3
1.5 DISSERTATION OUTLINE                                                        3

CHAPTER 2: LITERATURE REVIEW                                                    4
2.1 QR CODE AND ITS APPLICATIONS                                                4
2.2 TECHNOLOGY ACCEPTANCE MODEL                                                10
2.3 EXTENDED TAM: EXTRINSIC AND INTRINSIC MOTIVATION TO USE COMPUTERS IN THE
WORKPLACE                                                                      12
2.4 MODIFIED TAM: QR CODE ON PACKAGING ACCEPTANCE MODEL                        14

CHAPTER 3: METHODOLOGY                                                         16
3.1 SECONDARY DATA                                                             16
3.2 PRIMARY DATA                                                               16
3.3 BRAND NEW PACKAGING AND QR CODE GENERATION                                 17
3.4 CONSTRUCT MEASUREMENT                                                      19
3.5 DATA ANALYSIS                                                              21

CHAPTER 4: RESULTS AND DISCUSSION                                              22
4.1 SAMPLE CHARACTERIZATION                                                    22
4.2 QR CODE AWARENESS AND HABITS                                               26
4.3 RELIABILITY OF CONSTRUCTS                                                  28
4.4 HYPOTHESES TESTING                                                         29
4.4.1 THE EFFECT OF PERCEIVED EASE OF USE ON INTENTION TO USE                  30
4.4.2 THE EFFECT OF PERCEIVED EASE OF USE ON PERCEIVED USEFULNESS              31
4.4.3 THE EFFECT OF PERCEIVED USEFULNESS ON INTENTION TO USE                   32
4.4.4 THE EFFECT OF PERCEIVED EASE OF USE ON PERCEIVED ENJOYMENT               35
4.4.5 THE EFFECT OF PERCEIVED ENJOYMENT ON INTENTION TO USE                    36
4.5 DIFFERENCE AMONG GROUPS                                                    38
4.6 DISCUSSION                                                                 40

CHAPTER 5: CONCLUSIONS AND LIMITATIONS                                         44
5.1 CONCLUSIONS                                                                44
5.2 MANAGERIAL IMPLICATIONS                                                    44
5.3 LIMITATIONS AND FUTURE RESEARCH                                            46

                                                                               III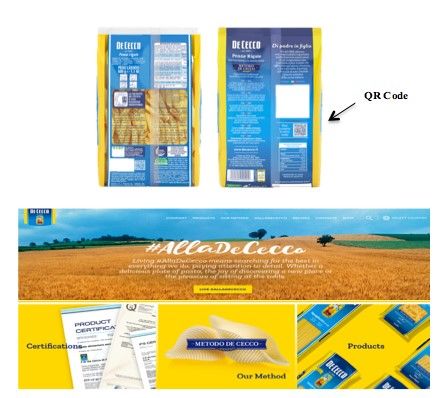
REFERENCE LIST                                                                      I

APPENDICES                                                                        IV
APPENDIX 1: SURVEY FLOW                                                            IV
APPENDIX 2: SPSS OUTPUT – DEMOGRAPHICS STATISTICS                                 XVI
APPENDIX 3: SPSS OUTPUT – QR CODE AWARENESS AND QR CODE HABITS                  XVIII
APPENDIX 4: SPSS OUTPUT – RELIABILITY ANALYSIS                                    XIX
APPENDIX 5: SPSS OUTPUT – EFFECT OF PERCEIVED EASE OF USE ON INTENTION TO USE     XXI
APPENDIX 6: SPSS OUTPUT – EFFECT OF PERCEIVED EASE OF USE ON PERCEIVED USEFULNESS
                                                                                 XXII
APPENDIX 7: SPSS OUTPUT – EFFECT OF PERCEIVED USEFULNESS ON INTENTION TO USE XXIII
APPENDIX 8: SPSS OUTPUT – EFFECT OF PERCEIVED EASE OF USE ON INTENTION TO USE
THROUGH PERCEIVED USEFULNESS                                                     XXIV
APPENDIX 9: SPSS OUTPUT – EFFECT OF PERCEIVED EASE OF USE ON PERCEIVED ENJOYMENT
                                                                                  XXV
APPENDIX 10: SPSS OUTPUT – EFFECT OF PERCEIVED ENJOYMENT ON INTENTION TO USE XXVI
APPENDIX 11: SPSS OUTPUT – EFFECT OF PERCEIVED EASE OF USE ON INTENTION TO USE
THROUGH PERCEIVED ENJOYMENT                                                     XXVII
APPENDIX 12: SPSS OUTPUT – DIFFERENCE BETWEEN INFORMATIVE AND ENTERTAINING QR
CODE                                                                           XXVIII

                                                                                  IV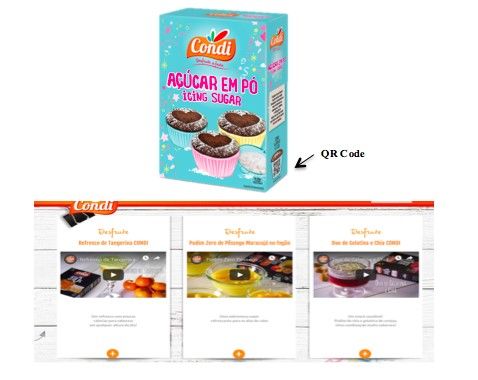
TABLE OF FIGURES

Figure 1: QR Code’s elements……………………………………………………………...4
Figure 2: Entertaining QR Code on Coca-Cola’s packaging……………………………….8
Figure 3: Informative QR Code on Kemon’s hair cream packaging …………………....... 8
Figure 4: Informative QR Code on De Cecco’s pasta packaging…………………………..9
Figure 5: Informative QR Code on Condi’s powder sugar packaging …………………….9
Figure 6: Technology Acceptance Model, Davis 1989…………………………………....10
Figure 7: Extrinsic and Intrinsic motivation to use computers in the workplace Davis,
Bagozzi & Warshaw 1992………………………………………………………………...13
Figure 8: Modified TAM: QR Code on Packaging Acceptance Model…………………...14
Figure 9: New Product Packaging…………………………………………………………18
Figure 10: Informative QR Code…………………………………………………………..19
Figure 11: Entertaining QR Code……………………………………………….………....19
Figure 12: Answers to the question “Do you drink bottled water?” …………….……......23
Figure 13: Answers to the question “Why didn’t you scan the QR Code?” ………………24
Figure 14: Demographics: Gender………………………………………………………...24
Figure 15: Demographics: Age…………………………………………………………….25
Figure 16: Demographics: Education……………………………………………………...25
Figure 17: Demographics: Employment…………………………………………………..26
Figure 18: Demographics: Nationality……………………………………………………..26
Figure 19: Percentage of people that recalled the QR Code……………………………….27
Figure 20: The effect of Perceived Ease of Use on intention to use……………………….30
Figure 21: The effect of Perceived Ease of Use on Perceived Usefulness………………...32
Figure 22: The effect of Perceived Usefulness on Intention to Use………………………..33
Figure 22: The effect of Perceived Ease of Use on Intention to Use through Perceived
Usefulness…………………………………………………………………………………..34
Figure 23: The effect of Perceived Ease of Use on Perceived Enjoyment………………...35
Figure 24: The effect of Perceived Enjoyment on Intention to Use……………………….37
Figure 25: The effect of Perceived Ease of Use on Intention to Use through Perceived
Enjoyment…………………………………………………………………………………..38

                                                                                        V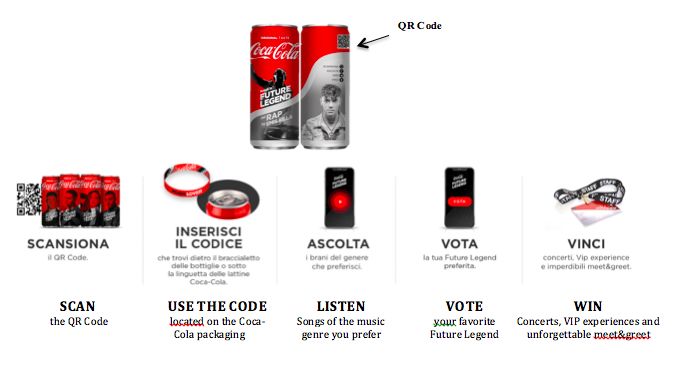
TABLE OF TABLES

Table 1: Real examples of different contents…………………………………………………7
Table 2: Definitions applied to the proposed conceptual model…………………………… .15
Table 3: Hypotheses …………………………………………………………………………15
Table 4: Constructs Measurements…………………………………………………………. 21
Table 5: Constructs’ Cronbach’s Alpha……………………………………………………...28
Table 6: Variables Descriptives.. ……………………………………………………………29
Table 7: Mann-Whitney Test.. ………………………………………………………………40
Table 8: Intention To Use Medians: Informative vs. Entertaining ………………………… 40
Table 9: Conceptual Framework………………………. …………………………………...42
Table 10: Summary of relationship between the variables………………………………......42

                                                                           VI
CHAPTER 1: INTRODUCTION

1.1 Background

The number of people using smartphones registered an increase of 1.9% CAGR from 2013,
reaching 7.33 billion users in 2019 (The.Radicati.Group, (n.d.)). As a consequence, global
expenditure for mobile Internet advertising by marketers has been growing at a 28.1% CAGR
from 2015, and it is expected to reach 247.36 billion dollars by 2020 (eMarketer, (n.d.)).
Consumers feel increasingly more attached to their smartphones and tend to always carry them,
including when they go shopping. For this reason, marketers are coming up with new ideas and
methods in order to better reach consumers (Hui, 2016). More specifically, QR Codes are
emerging as a form of mobile advertising thanks to their ability to easily and rapidly connect
consumers with brands and products directly on their smart devices. Among various types of
QR Codes, QR Code applied to packaging, has particularly stood-out lately as a form of smart
packaging, a market which is expected to reach 20 billion U.S. dollars by 2021 (BusinessWire,
2017). However, it is not taken for granted that QR Code, as a form of smart packaging, will
successfully grow in Italy. In fact, incorporating a QR Code on a product packaging brings
many advantages to companies only if used in the right way, such as to enhance brand
awareness and positioning, but at the same time there are many challenges that this marketing
tool faces. One of the biggest one is that companies incorporate QR Code on products
packaging without putting enough effort in understanding which content should be shared with
consumers, often underestimating the impact that this cheap but powerful tool can have on the
brand and on its relationship with consumers (Pozin, 2012).

1.2 Problem Statement

By exploring and measuring the impact of Perceived Ease of Use, Perceived Usefulness and
Perceived Enjoyment on the Intention to Use QR Codes on packaging, the study will try to
assess, given its limitations, which are the major determinants of its usage and whether a
specific type of content leads to an increase in consumers’ willingness to use QR Codes on
packaging. In fact, two types of QR Code contents will be compared in terms of their impact
on consumers’ intention to use it.

                                                                                            1
In order to address the problem stated above, this thesis will answer the following research
questions:
RQ1: “What is QR Code and what are its applications? What are the opportunities and
challenges of QR Code on packaging?”
RQ2: “What is the level of awareness of QR Codes on Packaging?”
RQ3: “What are the drivers on a person’s likelihood to use QR Codes on packaging?”
RQ4: “What types of content are consumers willing to be directed to once they scan the
QR Code?”
1.3 Relevance
This thesis’ relevance is supported by three main factors.
First of all, there are many researches on QR Code that study its acceptance and usage level,
but they focus on different QR Codes applications and the available literature lacks specific
studies on users’ acceptance of QR Codes on packaging. For example, many of these researches
study consumers’ acceptance of QR Codes in general without specifying any context (Ozkaya,
Ozkaya, Roxas, Bryant, & Whitson, 2015), other researches study the QR Code as a payment
method (Liébana-Cabanillas, Luna, & Ríos, 2015), as a marketing tool but from a different
perspective, not considering packaging (Ryu & Murdock, 2013) (Thayer, 2012), as an
advertising tool, focusing on its usage on billboards or magazines (Jung, Somerstein, & Kwon,
2012). Secondly, these studies were mainly conducted in Asia, U.S. and few other countries in
Europe, but never in Italy, where nevertheless QR Codes on products packaging is widely used.
Moreover, in order to make this study more relevant, the research will focus on two main types
of QR Code content: informational vs. entertaining. In fact, one of the problems of the QR
Code efficacy is whether companies are delivering the right content or not (Pozin, 2012) (Klie,
2012). By doing so, companies may understand which type of content consumers are more
willing to be directed to, and thus maximize the benefits granted by QR Codes.
21.4 Research Methods
Research questions 1 to 4 will be answered by collecting both primary and secondary data.
Secondary data will be collected by going through the available literature on the QR Code, on
its applications, on its specific applications on packaging, on the original Technology
Acceptance Model and on its later adaptation by Davis, Bagozzi & Warshaw (1992).
Since the research entails a comparison between two types of QR Code’s content (informative
vs. entertaining), the study will collect primary data through a questionnaire where one group
of people will see an informative QR Code and one group of people will see the entertaining
QR Code. For this purpose the following elements were designed in order to make the study
more relevant: a new product packaging, two different QR Codes (one informative and one
entertaining) and two different websites (one linked to the informative QR Code and the other
linked to the entertaining QR Code).
1.5 Dissertation Outline
The thesis consists of five main chapters. This first chapter represents an introduction aiming
at giving the reader an overview on the topic and research questions. The Literature Review is
then outlined in Chapter 2, which provides the reader with basic knowledge on what a QR Code
is, what are its applications today, how it applies on packaging and what are the opportunities
and challenges of this marketing tool. Moreover, real examples of QR Codes on packaging will
be presented distinguishing between two types of QR Codes: informative and entertaining.
Finally the chapter will present the original version of the Technology Acceptance Model, one
of its extended versions (Extended TAM: Extrinsic and Intrinsic motivation to use computers
in the workplace) and the final conceptual framework of this dissertation (Modified TAM: QR
Code on packaging Acceptance Model). Chapter 3 covers the methodology implemented in
order to collect data: both primary and secondary data. It will guide the reader through the
process of creation of a new packaging, two different QR Codes (one informative and one
entertaining) and two main websites linked to the QR Code. Chapter 4 is dedicated to the
analysis ran with IBM SPSS in order to answer the remaining Research Questions (RQ2-RQ4)
and to the discussion of the results obtained. Finally, Chapter 5 will present the conclusions,
limitations and recommendations for further researches.
3CHAPTER 2: LITERATURE REVIEW
This chapter aims at enabling the reader to acquire knowledge on QR Codes, its application and
its opportunities if used correctly. More specifically, it will introduce the concept of QR Codes
on packaging providing real examples of types of content collected by the author. Finally it will
review the Technology Acceptance Model and one of its later extensions in order to create a
conceptual framework that could explore usage intention of QR Codes on packaging based on
the two different types of content previously identified: informative vs. entertaining.
2.1 QR Code and its applications
QR Code stands for Quick Response Code and its invention dates back in 1994, when Denso
Wave, a division of Denso Corporation, owned by the Toyota Group, released it in order to
track inventory more quickly and more conveniently (Fine & Clark, 2015).
FINDING PATTERN TIMING PATTERN
ALIGNMENT
PATTERN
CELL
QUIET ZONE
Figure 1: QR Code’s elements
The QR Code is a matrix symbol composed by five different elements: the quite zone, which is
the white margin around the QR Code that, through contrast, allows it to be more readable; the
finding pattern, which consists of the three rectangles at the corners that enable the detection of
the QR Code position; the alignment pattern, placed in order to avoid and correct any QR Code
distortion; the timing pattern, made of one horizontal and on vertical lines connecting the
finding patterns; and finally the cells, which consist in the “data area”, the section in which
data is stored (Soon, 2008).
Nowadays QR Codes are used in different contexts and for different purposes: not only to track
4different products but, for example, to add Facebook users, to connect Whatsapp chats on the
laptop, to finalize payments, to collect additional information on a specific product, to allow
fast online purchasing, to receive discounts, to advertise movie trailers and so on (Coleman,
2011). A study on QR Codes carried out in 2015 revealed that most of the respondents
encountered QR Codes on product packaging, pharmaceutical and drug packaging, coupon,
magazine advertisements, newspaper advertisements, catalogs, outdoor advertisement and
television. However, the context in which QR Code was most often encountered is products
packaging (Demir, Kaynak, & Demir, 2015).
QR Code applied to packaging consists of a form of smart packaging. More precisely, three
different types of smart packaging were identified: design-led, active and connected. QR Code
on packaging is part of connected packaging, defined as:
“Packaging that contains technology (e.g. sensors, codes, and tags) capable of generating data
that can be captured, treated, analyzed and communicated to people or machines to change
behavior in the physical world”
(Armstrong, Herrmann, Fazio, & Duckworth, 2018)
QR Codes’ potential to reach consumers directly on their phones is not the only reason why
marketers are engaging in this new trend. In fact, if used in the right way, QR Codes on
packaging can provide them with real advantages. One first advantage is that QR Codes can
storage a huge amount of content, including media such as videos and images. In this way QR
Codes on packaging become a meaningful link between offline and online and can provide
consumers with additional contents that can’t be directly printed on the packaging because of
the limited space available.
As demonstrated by several studies, packaging itself is considered to be a powerful marketing
tool and an important product element that can be determinant in product positioning (Ampuero
& Vila, 2006) and branding strategy (Butler, 2013). Packaging’s efficacy as a marketing tool is
strengthened by the inclusion of technology, which in turns increases the packaging’s potential
to increase customer engagement, satisfaction and retention, by making consumer’s
engagement with the product more interactive (Armstrong, Herrmann, Fazio, & Duckworth,
2018) (Asare & Asare, 2015). The level of customer engagement and trust is considered to be
5higher when the company shares more information about the product by being completely
transparent towards consumers (Huang, 2018). Moreover, a new trend regarding QR Codes
consists of the customization of the QR Codes itself in terms of color and images, making it a
powerful branding tool that can increase brand awareness (Asare & Asare, 2015). An example
includes the Guinness QR Cup Campaign in 2012, in which the company has created special
cups that, once filled with beer (exclusively Guinness beer) would show a QR Code connecting
the customers directly to the company’s Facebook Page and accessing discounts (Mall, 2015).
Finally, the implementation of a QR Code is cheap, and this makes all of the aforementioned
advantages even more valuable because it automatically translates itself in a convenient
marketing tool (Ashford, 2010) (Asare & Asare, 2015) (Gramigna, 2017).
However, even though an increase in QR Code usage for marketing purposes has been
registered (Fine & Clark, 2015), this new trend is still in its “adolescent” maturity level (Huang,
2018). In fact, there are two main issues considered as the main causes behind QR Codes limited
usage so far, and that will be explored in the present dissertation. The first problem is QR Code
awareness (Klie, 2012). In fact, not everyone is aware that it is possible to find and scan these
QR Codes on packaging, and if consumers do not know about its existence they don’t look for
it. The second problem is that companies might deliver the wrong content to consumers, and,
as a consequence, they are not willing to scan the QR Code (Pozin, 2012). What are consumers
willing to see once they scan a QR Code? In order to make the QR Code an efficient marketing
tool and to exploit all its advantages, it is important that companies think of which type of
content is likely to drive consumer’s use of QR Codes on packaging. By collecting a number
of products that included a QR Code on the packaging it was possible to distinguish between
two different types of content:
1. Informational Content. This type of QR Code directs the consumer to the company’s
website in the informative section, where it is possible to know more about the company’s itself,
its corporate social responsibility and sustainability, additional information about specific
products and their ingredients.
2. Entertaining Content. The QR Code directs the consumer to content such as videos,
contests, discounts, cooking recipes, games and so on.
Coca-Cola, in Italy, has printed QR Code
on cans. Once the QR Code is scanned the
6consumer receives a promotional code
that allows the consumer to listen to
Coca Cola unreleased songs by famous singers and
https://www.coca- vote for the best. This initiative is called Entertaining
“Future Legend”, the first music contest
cola.it/it/future-legend/ through cans.
Kemon’s main business is hair product. In
Italy it has added on the packaging of a
hair conditioner a QR Code. Once
scanned, the QR Code directs the
consumer on the company’s webpage in
the section of CSR. They are sharing
Kemon through the QR Code their effort to Informative
https://www.kemon.com respect the environment and to avoid any
damage to it. They also share their
certifications such as “Love Nature”,
“Certified Vegan” and “I am green
plastic”.
De Cecco is an Italian brand for pasta. The
company has included on the primary
packaging a QR Code that, once scanned,
De Cecco directs the consumer on the company’s Informative
https://www.dececco.com/pt_e webpage. This webpage provides
consumers with additional information on
n/ the company and includes the following
sections: “Our History”, “Certification”,
“Our Method” and finally “Products”.
Condi is a Portuguese brand, which can be
considered a leader in the powder desserts
Condi industry. The QR Code is located on the Entertaining
primary packaging of powder sugar.
https://condi.pt Once scanned, the QR code directs the
consumer to a page where he/she can
access entertaining videos showing the
preparation of desserts. These videos are
proper tutorial videos.
Table 1: Real examples of different contents
7Figure 2: Entertaining QR Code on Coca-Cola’s packaging
Figure 3: Informative QR Code on Kemon’s hair cream packaging
8Figure 4: Informative QR Code on De Cecco’s pasta packaging
Figure 5: Informative QR Code on Condi’s powder sugar packaging
92.2 Technology Acceptance Model
Together with the Theory of Interpersonal Behavior and the Theory of Planned Behavior, the
Technology Acceptance Model (TAM) finds its roots in the Theory of Reasoned Action,
developed in 1975 by Fishbein and Azjen, and which explores consumers’ behaviors through
attitudes, social norms and intentions (Taherdoost, 2018).
TAM was developed in order to construct and validate “new scales for two specific variables,
perceived usefulness and perceived ease of use, which are hypothesized to be fundamental
determinants of user acceptance” (Davis, Perceived Usefulness, Perceived Ease of Use, and User
Acceptance of Information Technology, 1989).
Even though the Technology acceptance model was originally developed in order to understand
individual’s acceptance and adoption of technology at workplace, it was proved that is able to
predict consumers acceptance of new form of mobile marketing that have been developed in recent
years. In fact, extended versions of the Technology Acceptance Model have been used to research
consumers’ acceptance of marketing communications through QR Codes (Ryu & Murdock, 2013)
(Thayer, 2012).
Figure 6: TAM, Davis 1989
According to the TAM, individuals tend be willing to adopt a new technology when it is perceived
to be useful and easy to use. In fact, as demonstrated, these two are the main determinants of
consumers’ acceptance of a technology. Moreover, the findings show that perceived usefulness
also plays the role of mediator between perceived ease of use and usage intention (Davis, Perceived
Usefulness, Perceived Ease of Use, and User Acceptance of Information Technology, 1989).
10Perceived Usefulness (PU)
Studies with regard to individuals’ motivation have always identified two distinct categories:
extrinsic motivation and intrinsic motivation. We should refer to extrinsic motivation when “a
situation contains a specific goal which provides satisfaction independent of the actual activity
itself” (Calder & Staw, 1975). Following Calder & Saw’s (1975) definition of extrinsic motivation,
Davis, Bagozzi and Warshaw refer to it as “the performance of an activity because it is perceived
to be instrumental in achieving valued outcomes that are distinct from the activity itself, such as
improved job performance, pays or promotions” (Davis, Bagozzi, & Washaw, Extrinsic and
Intrinsic Motivation to Use Computers in the Workplace’, 1992). Through Perceived Usefulness,
the TAM wants to explore individuals’ extrinsic motivation of using a computer system.
PU: “the degree to which a person believes that using a particular system would enhance his or
her job performance” (Davis, Perceived Usefulness, Perceived Ease of Use, and User Acceptance
of Information Technology, 1989)
Perceived Usefulness has been proved to be the strongest determinant of individuals’ intention to
use a technology (Davis, Bagozzi, & Washaw, Extrinsic and Intrinsic Motivation to Use
Computers in the Workplace’, 1992). Fishbein and Azjen (1975) defined intention as “a person
subject probability that he will perform some behavior”. This suggests that the extent to which the
individual finds the QR Code useful will influence his/her intention to its usage. For this reason:
H1a: Perceived Usefulness has a positive impact on consumers’ intention to use of QR Codes on
Packaging.
Perceived Ease of Use (PEU)
Although usefulness-usage relation was stronger, Davis’ study on the two determinants of usage
shows that an ease-usage relation exists too.
PEOU: "the degree to which a person believes that using a particular system would be free of
effort” (Davis, Perceived Usefulness, Perceived Ease of Use, and User Acceptance of Information
Technology, 1989)
11Not only Perceived Ease of Use has a strong impact on consumers’ acceptance of a new
technology, but it also has a positive impact on Perceived Usefulness, which mediates the ease-
usage relationship. This means that a high level of perceived ease of use will directly impact and
positively influence consumers’ intention to use QR Codes applied on packaging, but it will also
impact on perceived usefulness, which behaves as a mediator in their relationship.
H2a: Perceived Ease of Use has a positive impact on consumers’ intention to use QR Codes on
packaging
H2b: Perceived Ease of Use has a positive impact on Perceived Usefulness of QR Codes on
packaging
2.3 Extended TAM: Extrinsic and Intrinsic motivation to use computers in the
workplace
Few years later, in 1992, the TAM has been modified, and one important variable, which did not
capture the attention of many researchers before, was introduced: Enjoyment. Davis, Bagozzi &
Warshaw (1992) have extended the original version of the TAM in order to study how individuals’
perceived enjoyment, other than perceived usefulness, would impact on their intention to use and
their effective usage of computers when working.
Indeed, the proposed model considers as the main determinants of Usage Intention and Actual
Usage of computer system at the workplace, Perceived Usefulness and Perceived Enjoyment,
which explained, together, 62% (in the first study) and 75% (in the second study) of the variance
in usage intention (Davis, Bagozzi, & Washaw, Extrinsic and Intrinsic Motivation to Use
Computers in the Workplace’, 1992). Not only the latter are directly influencing usage intentions,
but they also play the role of mediators in the following relationships: Perceived Ease of Use-
Usage Intention and Output Quality-Usage Intention. Output Quality, which is the second “new
entry” of the proposed model, is defined as the “intermediate or end products of using the system,
such as documents, graphs, calculations, and the like” (Davis, Bagozzi, & Washaw, Extrinsic and
Intrinsic Motivation to Use Computers in the Workplace’, 1992).
12Figure 7: Extrinsic and Intrinsic motivation to use computers in the workplace
(Davis, Bagozzi & Warshaw 1992)
Perceived Enjoyment
By including Perceived Enjoyment, the authors wanted to study how workers’ intrinsic motivation
would influence the usage intention and the actual usage of computers. We refer to intrinsic
motivation as “the doing of an activity for its inherent satisfactions rather than for some separable
consequence” (Ryan & Deci, 2000). Here, intrinsic motivation is studied in the form of Perceived
Enjoyment, which is defined as follows:
PE: “extent to which the activity of using the computer is perceived to be enjoyable in it’s own
right, apart from any performance consequences that may be anticipated” (Davis, Bagozzi, &
Washaw, Extrinsic and Intrinsic Motivation to Use Computers in the Workplace’, 1992).
Marketers are increasingly designing and developing products that make it possible for consumers
to interact with it. Not only interactivity is of utmost importance nowadays, but it is also one feature
of the QR Code. Perceived enjoyment has been considered as a determinant variable of QR Code
usage in many researches, it has never been linked to the different types of content that the
consumer can be directed to once the QR Code is scanned. For example, Chong (2017) found that
Perceived Enjoyment was a strong determinant of consumers’ intention to accept QR Code as a
general marketing tool. Moreover Thayer (2012) suggests that future researches on QR Code as a
marketing tool should explore how intrinsic motivation, and thus, enjoyment, would impact on
consumers’ intention to use it.
Finally, Perceived Enjoyment also plays the role of mediator in the relationship between Perceived
Ease of Use and Usage intention. In fact, as demonstrated by Davis, Bagozzi and Warshaw (1992),
a high level of perceived ease to use leads to an increased perception of enjoyment, which in turns
has a significant impact on usage intention.
13H3a: Perceived Enjoyment has a positive impact on consumers’ intention to use QR Codes on
Packaging.
H2c: Perceived Ease of Use has a positive impact on Perceived Enjoyment of QR Codes on
packaging
2.4 Modified TAM: QR Code on packaging Acceptance Model
The Technology Acceptance Model and its findings, together with its extension by Davies,
Bagozzi and Warshaw (1992), constitute the base for the conceptual framework that will make
it possible to explore the hypothesis anticipated throughout the literature review.
Figure 8: Modified TAM: QR Code on Packaging Acceptance Model
The proposed conceptual framework exploits already existing variables in order to explore
consumers’ intention to use QR Codes on packaging. On one hand it finds its roots in the study
carried out by Davies (1989), taking into account Perceived Usefulness and Perceived Ease of
Use and exploring their direct relationship with intention to use and the mediation effect of
Perceived Usefulness in the ease-usage relationship. On the other hand, it also considers
intrinsic motivation as suggested by Davis, Bagozzi and Warshaw (1992) by introducing
Perceived Enjoyment in the model. However, one major difference is that the proposed model
does not take into account the variable Output Quality, which can’t be applied to this specific
model.
14The proposed model, which represents a modified version of the Technology Acceptance
Model, is a multiple mediator model, where Perceived Ease of Use is the Independent Variable
and Intention to Use is the Dependent Variable. Perceived Usefulness and Perceived Enjoyment
play the role of mediators.
Perceived Usefulness (PU) The extent to which consumers perceive that QR Codes on
packaging are useful
Perceived Ease of Use (PEOU) The degree to which consumers perceive QR Codes on
packaging are easy to use and require small effort
Perceived Enjoyment (PE) The degree to which consumers perceive QR Codes on
packaging to be enjoyable and entertaining
Intention to Use (IU) Consumers’ intention to scan QR Codes on packaging in the
future
Table 2: Definitions applied to the proposed conceptual model
HYPOTHESES DESCRIPTION
H1a Perceived Usefulness has a positive impact on consumers’ intention to use
QR Codes on Packaging.
H2a Perceived Ease of Use has a positive impact on consumers’ intention to use
QR Codes on packaging
H2b Perceived Ease of Use has a positive impact on Perceived Usefulness of QR
Codes on packaging
H2c Perceived Ease of Use has a positive impact on Perceived Enjoyment of QR
Codes on packaging
H3a Perceived Enjoyment has a positive impact on consumers’ intention to use
of QR Codes on Packaging.
Table 3: Hypotheses
15CHAPTER 3: METHODOLOGY
3.1 Secondary Data
In order to answer Research Questions 1-4 both secondary and primary data was collected.
Secondary data was collected and used for the purpose of building Chapter 2: Literature
Review. As a matter of fact data presented in Chapter 2 makes it possible to answer RQ1:
What is QR Code and what are its applications? What are the opportunities and challenges of
QR Code on packaging?
However, even though Chapter 2 enables the reader to acquire basic knowledge on what the
QR Code is, how does it apply on packaging and what are the main opportunities and
challenges, primary research is necessary in order to study more in depth consumers’ behavior
with regards to QR Codes on packaging.
Thus, primary data will be collected in order to answer the remaining following research
question:
RQ2: What is the level of awareness of QR Codes on Packaging?
RQ3: What are the drivers on a person’s likelihood to use QR Codes on packaging?
RQ4: What type of content is consumers willing to be directed to once scanned the QR Code?
3.2 Primary Data
Primary data was collected through a survey that was built in order to explore how variables
such as Perceived Ease of Use, Perceived Usefulness and Perceived Enjoyment of QR Code on
packaging impact on consumers’ intention to use it.
The survey is composed of 33 questions and was distributed first by email and later the
questionnaire was shared in Facebook groups, mainly university Facebook groups.
First of all, respondents answered questions on demographics and after that, since the stimulus
regarded a bottle of water, a question on whether they drink bottled water or not was asked.
When the answer to this question was negative, respondents were considered unable to continue
the survey, and thus, were redirected to the end of the survey.
16After this first screening, there is a question which was added in order to measure respondents’
level of awareness of QR Codes on packaging and thus, to answer RQ2.
From this point, consumers will be directed to different branches according to the
randomization factor as follow:
- 1/3 of respondents were immediately asked to answer questions in order to measure
their Perceived Ease of Use, Perceived Usefulness and Perceived Enjoyment of QR
Codes on packaging.
- 1/3 of respondents will be invited to scan with their phones an “Informative” QR Code,
directing them to the water company’s website in the section in which more information
about the product and its sustainability is available. After that, they were asked to give
their opinion on Perceived Usefulness, Perceived Ease of Use, Perceived Enjoyment
and Usage Intention.
- 1/3 of respondents were invited to scan with their phones an “Entertaining” QR Code,
directing them to the water company’s website in the section in which they can play
three different quizzes in order to win one free month on Spotify Premium (the prize
was fake and respondents were informed). After that, they were asked to give their
opinion on Perceived Usefulness, Perceived Ease of Use, Perceived Enjoyment and
Usage Intention.
Finally, at the end of the survey, respondents where asked four questions on their habits with
regards to QR Codes. Hopefully, these questions will enable the researcher to know more about
respondents’ usage of this marketing tool and to enrich the research with valuable insights, that
could be used in order to build managerial implications.
3.3 Brand New Packaging and QR Code Generation
The purpose of this research is to understand whether a consumer is more intentioned to scan
an informative QR Code or an entertaining QR Code on packaging.
For this reason, before the questionnaire was sent, few steps were completed:
1. Since the focus is on packaging, a brand new packaging was created in order to avoid
any kind of bias. The type of product chosen is a plastic bottle of water, and this is for
two main reason: first of all almost everyone has drunk from a plastic bottle and thus,
the kind of packaging is common to everyone; secondly, this specific product can be
associated with both informative and entertaining content. To better explain this point I
17will take into account the example of Coca Cola. The latter is a product that is mainly
associated to entertaining contents, more precisely to music, and for this reason couldn’t
be taken into consideration for this specific research. This works for every product that
can be associated to only one of the types of content and not to both.
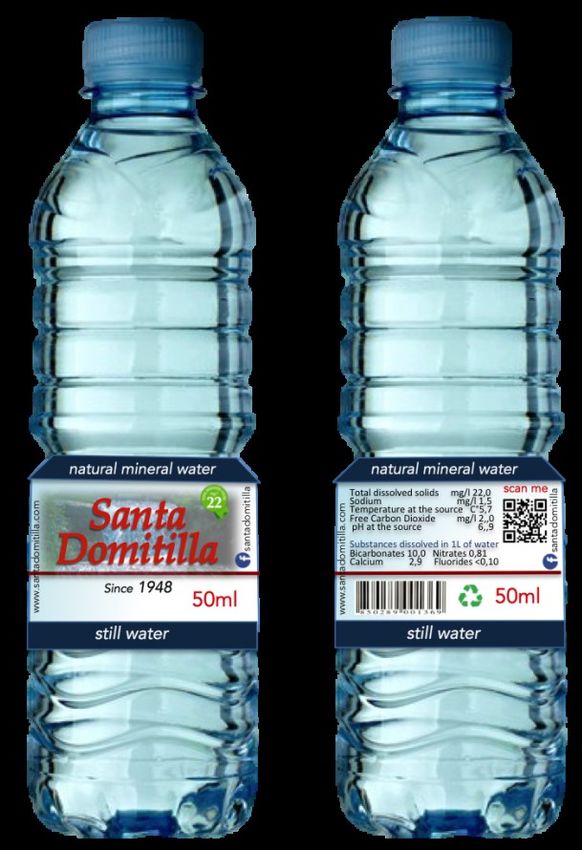
As it is possible to observe in Figure 9, the new packaging is a plastic bottle of water
that includes the following elements: name of the brand, which is fake in order to avoid
bias, date in which the water company was founded, type of water, size of the water
bottle, water facts, barcode, recyclable logo, company’s website, company’s Facebook
account and finally a QR Code.
Figure 9: New product packaging
2. Two different QR Codes were created in order to respect the characteristics of the
informative and entertaining QR Codes. There are many websites that allow creating
and customizing free QR Code. The website used by the researcher was QR Code
Monkey (https://www.qrcode-monkey.com/#url).
Figure 10: Informative QR Code Figure 11: Entertaining QR Code
183. Finally, two different websites to which respondents are directed once they scan the QR
Code were created. One website for the informative QR Code
(https://frallales.wixsite.com/santadomitilla) that allows consumers to gather additional
information about the company, such as the history, a map that shows the exact place
in which the water is taken, sustainability projects such as BIO packaging and finally a
chat box that allows respondents to ask more questions. The other website is for the
entertaining QR Code (https://frallales.wixsite.com/santadomitilla2) that simulates
three different games among which the respondents can choose. In fact, it gives
respondents the chance to win one free month on Spotify Premium by playing one of
the three quizzes presented on the website: one quiz is about the company’s history, one
quiz is about music and the last one is a science quiz. Respondents are informed at the
end of the quiz that the prize is not real and that the websites were exclusively created
for the thesis. With regards to the entertaining QR Code, two other websites were
created: one for those who win the quiz (https://frallales.wixsite.com/congratulations)
and one for those who loose it (https://frallales.wixsite.com/ohnoyoulost).
3.4 Construct Measurement
Chapter 1 was fundamental in order to explore previous researches and in order to find valid
construct measurements for Perceived Ease of Use, Perceived Usefulness, Perceived
Enjoyment and finally Intention to Use. Perceived Ease of Use was measured according to
Davis (1989), who is the author of the Technology Acceptance Model, and who proofed the
validity and reliability of his measurement (Cronbach alpha = 0.94), consisting of 5 items
measured on a 7-points scale. In order to measure Perceived Usefulness, the measurement used
by Jayasingh & Eze (2010) was adopted. The latter successfully used an extended version of
the Technology Acceptance Model in order to investigate consumers’ adoption of Mobile
Coupons. Their conceptual framework included Perceived Usefulness, which constituted of 5
items measured on a 7-points scale. The measurement built by Jayasingh & Eze (2010), proofed
its validity with a Cronbach alpha of 0.963. Davis, Bagozzi & Warshaw (1992) included
Perceived Enjoyment for the first time in the Technology Acceptance Model as a predictor of
Usage Intention. Given the validity of this measurement (Cronbach alpha = 0.92) and its fit into
the present dissertation, it was used in order to measure Perceived Enjoyment of QR Codes on
packaging. This construct consists of three items measured on a 7-points scale. The last
construct is Intention to Use and its measurement was adapted from the one proposed by Hui
19(2017), who studied consumers’ behavioral intention with regards to QR Codes as a marketing
tool, but never mentioned packaging as the specific “host” of QR Code. Moreover, Hui (2017)
did not use a Technology Acceptance Model, but he based his research on Diffusion of
Innovation Theory. His conceptual framework included Intention to Use that scored a Cronbach
alpha of 0.886.
Construct and Literature Adapted Items Measurement
1. Learning to operate QR Code on
packaging would be easy for me
2. I would find it easy to get QR
Code on packaging to do what I
want to do
3. My interaction with QR Code on
Perceived Ease of Use packaging would be clear and 7-points scale (Likely/Unlikely)
understandable
Davis (1989)
4. I would find QR Code on
packaging to be flexible to interact
with
5. It would be easy for me to
become skillful at using QR Code
on packaging
1. Using QR Code on packaging
would make me a smarter
consumer
Perceived Usefulness 2. Using QR Code on packaging
7-points scale
would make my shopping easier
Jayasingh & Eze (2010) (Strongly agree/Strongly
3. Using QR Code on packaging
would save money disagree)
4. Using QR Code on packaging
make shopping more enjoyable
5. Overall QR Code on packaging
is very useful
1. I find using QR Code on
packaging to be enjoyable
(likely/unlikely)
Perceived Enjoyment 2. Using QR Code on packaging)
7-points scale
would be (unpleasant/pleasant)
Davis, Bagozzi & Warshaw (Likely/Unlikely)
3. I would have fun using QR Code
(1992) on packaging (likely/unlikely). (Unpleasant/Pleasant)
1. I intend to increase my use of QR
code on packaging 7-points scale
Intention to Use
2. I intend to invest my time and (Strongly disagree/Strongly
Hui (2017) effort to QR code on packaging
agree)
3. I intend to use QR codes on
packaging in the future.
Table 4: Constructs Measurements
203.5 Data Analysis
The data gathered from the distribution of the online survey was analyzed by using the IBM
SPSS Statistic Platform. The very first analysis consists of descriptive statistics and frequencies
that finally allow an in-depth analysis of the sample. Cronbach’s Alpha is calculated for each
construct in order to assess their validity. Normal distribution of data is assumed according the
Central Limit Theorem, and when the number of respondents was reduced because of the
analysis of two different groups, non-parametric analyses were implemented. Simple Linear
Regression Analysis and Weighted Least Squares Regression Analysis are used on SPSS in
order to explore the relationships among all the variables (Perceived Usefulness, Perceived
Enjoyment, Perceived Ease of Use and Intention to Use). In order to ensure validity of the
analysis, all the assumptions are first checked and then results interpreted. In order to
investigate the existence of a mediation effect in the relationship ease-usage, where the
mediator are either Perceived Usefulness or Perceived Enjoyment, Model 4 from PROCESS
macro is used and direct and indirect effects are compared. Finally, the Mann-Whitney U Test
is run in order to see whether a statistically significant difference in usage intention is found
between the two groups that saw two different QR Codes.
21CHAPTER 4: RESULTS AND DISCUSSION
This chapter aims at presenting the results obtained throughout the analysis on IMB SPSS and
at their discussion. The first part of the chapter analyzes step by step how the researcher
obtained the final, valid sample population and studies in depth its characteristics. After that,
the validity of the construct measurements is assessed in order to proceed with the analysis and
the four hypotheses presented in the Literature Review, Chapter 2, are tested. The second part
of this chapter is dedicated to the discussion of the results obtained going through each Research
Question.
4.1 Sample Characterization
Before every kind of analysis was started, the dataset was cleaned from all the errors by
checking minimum, maximum and missing values of each variable.
The survey distributed has collected a total of 465 answers. However, not all of them are valid
and, before the sample characterization is presented, it is worthwhile to understand every step
that led to the final and valid sample, made of 309 answers.
First of all, the questionnaire reported 32 responses in progress that from now on will not be
counted in the final sample, which now accounts for 433 answers.
As presented in the Methodology section, Chapter 3, the questionnaire included 3 main
screening questions:
1. The first screening question was: “Do you drink bottled water?”
In fact, the stimulus presented to the respondents consisted of a bottle of water whose
label included a QR Code, that is the object of the analysis. For this reason, all those
people not drinking bottled water were not invited to continue the questionnaire and
from now on they will be excluded from the analysis. Out of the 433 responses, 25 will
not be considered because they answered “no” to this question (Figure 12). This result
suggests that they probably drink filtered water or simply drink sink water.
6%
NO
YES
94%
Figure 12: Answers to the question “Do you drink bottled water?”
222. The second screening question was: “Do you own a smartphone?”
Since the questionnaire required the respondents to scan the QR Code with their
smartphone, only those who own a smartphone could continue with the questionnaire.
However, nowadays it is very common to own this kind of device, and as a matter of
fact only 4 people out of 408 claimed that they don’t own a smartphone, leading to a
sample made of 404 responses.
3. The third, and most important screening question was: “Did you scan the QR Code?”
As explained in the Methodology section, the questionnaire would generate three
different groups of people: one control group, which after the stimulus would directly
fill the questionnaire; one group that was invited to scan the informative QR Code and
finally complete the questionnaire; one group that was instead invited to scan an
entertaining QR Code and then to fill the questionnaire. The last two groups, which
were nudged to scan the QR Code, were asked the above-mentioned screening question.
In this way, only those people that effectively scanned the QR Code would proceed with
the questionnaire. Out of 404 respondents 89 did not scan the QR Code and from now
on will not be considered for further analysis and thus, the sample accounts for 315
responses.
The respondents whose answer to this question was negative were also asked to specify
why they did not scan the QR Code. The main reasons were either that they did not
know how to scan or that they did not have an App to scan the QR Code (Figure 13).
Fortunately, none of the respondents that could not scan the QR Code stated that it was
due to a malfunctioning of the QR Code itself.
DON'T
KNOW HOW
43% TO SCAN
57% DON'T HAVE
THE APP
Figure 13: Answers to the question “Why didn’t you scan the QR Code?”
23Finally, cases 2, 4, 26, 106, 112 and 254 were deleted because considered outliers.
The final sample is made of 309 valid responses that are divided as following:
- 103 respondents that are part of the control group
- 103 respondents that scanned the informative QR Code
- 103 respondents that scanned the entertaining QR Code
The sample population was analyzed by conducting descriptive analysis on SPSS.
As we can see from Figure 14 the number of people who answered the questionnaire is almost
evenly distributed among males and females, 126 and 183 respectively. Figure 15 shows the
age distributions and we can observe that the dominant age range is 18-29 years old (255
respondents), leaving all the other age ranges with small representativeness of the sample.
41% Male
59% Female
Figure 14: Demographics: Gender
82,5%
4,5% 7,4%
3,6% 0,6% 1,3%
Under 18 years 18-29 years old 30-39 years old 40-49 years old 50-59 years old 60 years and
old over
Figure 15: Demographics: Age
The education distribution showed in Figure 16 reveals that the sample population is quite well
educated with most of respondents that have accomplished either an Undergraduate or a
24You can also read