Protist communities along freshwater-marine transition zones in Hudson Bay (Canada)
←
→
Page content transcription
If your browser does not render page correctly, please read the page content below

Jacquemot, L, et al. 2021. Protist communities along freshwater–
                                                                 marine transition zones in Hudson Bay (Canada). Elem Sci Anth, 9: 1.
                                                                 DOI: https://doi.org/10.1525/elementa.2021.00111

RESEARCH ARTICLE

Protist communities along freshwater-marine
transition zones in Hudson Bay (Canada)
Loı̈c Jacquemot1,2,*, Dimitri Kalenitchenko1,2, Lisa C. Matthes3, Adrien Vigneron1,2,
Christopher J. Mundy3, Jean-Éric Tremblay1, and Connie Lovejoy1,2

One of the most striking ecological divides on Earth is between marine and nearby freshwater environments,

                                                                                                                                        Downloaded from http://online.ucpress.edu/elementa/article-pdf/9/1/00111/459987/elementa.2021.00111.pdf by guest on 02 December 2021
as relatively few taxa can move between the two. Microbial eukaryotes contribute to biogeochemical and
energy cycling in both fresh and marine waters, with little species overlap between the two ecosystems.
Arctic and sub-Arctic marine systems are relatively fresh compared to tropical and temperate systems, but
details of microbial eukaryote communities along river-to-sea transitions are poorly known. To bridge this
knowledge gap, we investigated three river-to-sea transitions (Nelson, Churchill, and Great Whale Rivers) in
sub-Arctic Hudson Bay through 18S rRNA amplicon sequencing to identify microbial eukaryotes along the
salinity and biogeochemical gradients. Salinity acted as the principal dispersal barrier preventing freshwater
microorganisms from colonizing marine coastal waters, with microbial eukaryote communities of the three
rivers clustering together. Just offshore, communities clustered by coastal regions associated with nutrient
concentrations. Analysis of indicator species revealed that communities in the nitrate-depleted coastal water
off the Churchill and Great Whale Rivers were dominated by heterotrophic taxa and small photosynthetic
protists. In contrast, the Nelson offshore community was characterized by a high proportion of the diatom
Rhizosolenia. A distinct community of heterotrophic protists was identified in the three estuarine transition
zones, suggesting specialized estuarine communities. Such specialization was most marked in the Nelson River
system that was sampled more intensely and showed estuarine circulation.The autochthonous community was
composed of the bacterial grazers Katablepharis, Mataza, and Cryothecomonas, as well as brackish species of
the diatoms Skeletonema and Thalassiosira. These findings suggest that flow regulation on the Nelson River
that modifies estuarine circulation would affect estuarine community composition and distribution in the
transition zone.

Keywords: Microbial eukaryotes, Arctic Ocean, Hudson Bay, Estuary, Freshwater gradient, Maximum turbidity
zone

Introduction                                                     circulation patterns that depend on wind, tides, estuarine
The environmental gradient from rivers to the sea can be         geomorphology, and the volume and flow rate of riverine
sharp or more gradual depending on hydrodynamic pro-             water entering the estuary (Simpson et al., 1990). Due to
cesses and the residence times within estuaries (Uncles et       the coupling between tidal forcing and river runoff, estu-
al., 2002; Burchard et al., 2018). Bridging the river and the    aries are complex transition areas where pronounced gra-
sea, estuaries are important boundaries between two eco-         dients not only of salinity but also of temperature, organic
systems and constitute major gateways delivering fresh-          matter, light, and nutrients influence bacterial (Bouvier
water into the marine system. Freshwater entering the            and del Giorgio, 2002; Crump et al., 2004) and microbial
coastal ocean influences physical, biogeochemical, and           eukaryote communities (Muylaert et al., 2009; Vigil et al.,
biological properties and processes of the recipient marine      2009; Bazin et al., 2014).
system. Within estuaries, salinity is variable and driven by        Discharge timing and intensity influence the maximum
                                                                 turbidity zone in many estuaries (Uncles et al., 2002;
                                                                 Burchard et al., 2018). On regulated rivers, discharge
1
    Département de biologie, Université Laval, Québec City,   events depend on dam-controlled runoff and affect light
    Quebec, Canada
2
                                                                 and nutrient availability through suspended particulate
    Institut de biologie intégrative et des systèmes (IBIS),
    Université Laval, Québec City, Quebec, Canada
                                                                 matter (Domingues et al., 2012). During high-discharge
3                                                                events, suspended material and nutrient loading in the
    Centre for Earth Observation Science, University of
    Manitoba, Winnipeg, Manitoba, Canada                         estuary increase, and the maximum turbidity zone moves
                                                                 seaward. Conversely, low-discharge events are associated
* Corresponding author:
Email: loic.jacquemot42@gmail.com                                with reduced nutrient inputs, sedimentation of suspended
Art. 9(1) page 2 of 20                                                   Jacquemot et al: Sub-Arctic estuarine transition zones

materials in the estuarine transition zone, increasing light      about the composition and structure of microbial eukary-
availability for phytoplankton, and displacement of the           ote communities (hence referred to as protists) in coastal
remaining maximum turbidity zone toward the river. On             Hudson Bay.
unregulated rivers in the Arctic and sub-Arctic, seasonal            The present study aims to make a first inventory of
discharge is usually closely tied to spring freshets when         protist communities in the coastal and estuarine environ-
snow pack melt contributes to increased flow. All of these        ments of the Hudson Bay sequencing the V4 region of 18
factors will likely affect estuarine plankton communities.        S rRNA (rRNA) and the 18S rRNA gene (rDNA). Our objec-
Because of the inaccessibility of these regions during            tive was to identify protist community composition along
spring, when ice conditions are unstable, Arctic and sub-         a salinity gradient in the Nelson, Churchill, and Great
Arctic systems have been studied less compared to                 Whale River estuarine systems. Samples were collected
temperate estuaries. The moderately lower salinity of the         along transects at the surface and below the fresher sur-
Arctic Ocean and adjacent seas and the less abrupt salinity       face layer to capture diversity associated with the estua-
changes between the estuary and open water could also             rine processes. Within this objective, we aimed to better
result in less marked community transitions between               understand the underlying environmental mechanisms
fresh and marine waters. In this study, we investigated           structuring the communities in Arctic estuaries and to

                                                                                                                                      Downloaded from http://online.ucpress.edu/elementa/article-pdf/9/1/00111/459987/elementa.2021.00111.pdf by guest on 02 December 2021
river systems in Hudson Bay (Canada), a sub-Arctic inland         assess the influence of river discharge on the composition
sea that receives up to 800 km3 year–1 of freshwater from         and distribution of microbial eukaryote assemblages.
23 major rivers (McClelland et al., 2012). This river runoff
to the coastal Hudson Bay freshens surface waters, which          Materials and methods
can range from salinities of 25 to 29. The fresher surface        Field sampling
waters remain on top of more saline and deeper waters             The study was part of a larger multidisciplinary investiga-
with salinities up to 33 (Granskog et al., 2011).                 tion to understand the contributions of climate change
    Specifically, we compared three river systems to exam-        and hydroelectric regulation to the freshwater–marine
ine freshwater–marine coupling on biological communi-             coupling in the Hudson Bay System (BaySys; Barber,
ties shortly after ice breakup. Many larger rivers in Hudson      2014). The main aim of the ship-based study was to sam-
Bay are now under the influence of hydroelectric projects         ple close to the seasonal peak of freshwater discharge. The
that change the timing and volume of freshwater brought           original mission was to have occurred in 2017, but due to
by rivers into the coastal sea (Déry et al., 2011). The Nelson   ice and logistical constraints, the ship was not able to
River is the largest contributor of freshwater to Western         sample Western Hudson Bay. The Great Whale River was
Hudson Bay and the most impacted by hydroelectric                 therefore sampled opportunistically in 2017 once the ship
development (Déry et al., 2016; Stadnyk et al., 2019). Since     was able to enter Hudson Bay. The original ship-based
1976, approximately 75% of the annual flow of the                 study focusing on Western Hudson Bay was subsequently
Churchill River has been diverted into the catchment              carried out in 2018.
basin of the Nelson River for enhanced hydropower pro-                Samples were collected from three rivers that discharge
duction (Newbury et al., 1984; Déry et al., 2016). As a con-     into Hudson Bay and adjacent coastal sites (Figure 1). All
sequence, the annual freshwater discharge of the Nelson           marine and outer estuarine samples were collected from the
has increased and the flow regime has evolved toward              Canadian Coast Guard Icebreaker CCGS Amundsen using
a flattened hydrograph, with the high spring discharge            a Rosette system equipped with 12-L Niskin-type bottles and
held in reservoirs and increased winter flow to meet high-        a conductivity, temperature, and depth (CTD) profiler (Sea-
er hydroelectric demand (Déry et al., 2011; Déry et al.,        Bird SBE-911 CTD). The rosette was also equipped with rela-
2016; McCullough et al., 2019). Although seasonality of           tive nitrate (In-Situ Ultraviolet Spectrometer, ISUS, Satlantic),
the Churchill River flow was only altered slightly, the           dissolved oxygen (Seabird SBE-43), chlorophyll fluorescence
annual discharge decreased significantly since the diver-         (Seapoint), fluorescent-colored dissolved organic matter
sion. The unregulated Great Whale River on the eastern            (fCDOM; Wetlabs ECO), photosynthetically active radiation
side of Hudson Bay contributes to freshwater discharge in         (PAR; Biospherical Instruments QCP3200), and transmissom-
the same range as the Churchill River (Bhiry et al., 2011;        eter (WETlabs C-Star, SeaBird Scientific) sensors. The dis-
Déry et al., 2016; Stadnyk et al., 2019) and was a counter-      solved oxygen sensor was calibrated onboard against
point to the Churchill system.                                    Winkler titrations. Discrete water samples for nutrients, chlo-
    In Hudson Bay, freshwater inflows are considered              rophyll a (chl a), microscopy, and nucleic acids were collected
a minor source of inorganic nitrogen to the coastal sea           directly from 12-L Niskin-type bottles that were closed on the
but may contribute indirectly to the primary production           upward cast.
by influencing large-scale estuarine circulation and input            The Great Whale River system was sampled on July 7,
of nutrient-rich deep waters (Granskog et al., 2009; Kuzyk        2017, with river samples collected directly from the edge
et al., 2010). These observations, combined with the work         of the river using clean 10-L carboys that had been rinsed
of Heikkilä et al. (2014) on dinoflagellate cyst distribution,   in 5% HCL, sterile water, and sample water. The Nelson
support the view that coastal Hudson Bay is highly pro-           and Churchill River systems were sampled from June 28,
ductive compared to its center. However, except for a few         2018, to July 4, 2018 (Table S1). The river water samples
studies investigating the main photosynthetic protist con-        were collected directly into clean carboys from a zodiac or
tributors to primary production (Harvey et al., 1997; Fer-        a barge deployed from the CCGS Amundsen. River conduc-
land et al., 2011; Lapoussière et al., 2013), little is known    tivity and temperature were obtained using a SeaBird 19
Jacquemot et al: Sub-Arctic estuarine transition zones                                               Art. 9(1) page 3 of 20

                                                                                                                              Downloaded from http://online.ucpress.edu/elementa/article-pdf/9/1/00111/459987/elementa.2021.00111.pdf by guest on 02 December 2021
Figure 1. Water sampling sites in three river systems of Hudson Bay. Left panel shows the location of Hudson Bay with
  red boxes indicating the Churchill, Nelson, and Great Whale Rivers and offshore sites. Water depth (m) is indicated by
  the color scale bar. The right panels indicate the stations sampled in the three systems. DOI: https://doi.org/10.1525/
  elementa.2021.00111.f1

þ CTD probe. Turbidity in the Nelson and Churchill Rivers       al., 1999). All FCM samples were fixed by adding 90 ml of
was measured with a transmissometer (WETlabs C-Star,            25% glutaraldhehyde to 1.8 mL of seawater. Preserved
SeaBird Scientific) deployed from a barge.                      samples were left at 4  C for 30 min in the dark, deep
    Samples for chl a, nucleic acids, flow cytometry (FCM),     frozen in liquid nitrogen, and stored at –80  C until lab-
and particulate organic carbon (POC) along the Nelson           oratory analysis. Water samples for chl a and POC were
and Churchill River transects were collected mostly from        collected in dark Polycarbonate Nalgene1 bottles. For chl
the surface using a bucket except for stations NE-D and         a, samples were filtered onboard the ship onto 25-mm
NE-E (Figure 1), where near bottom water from 5- and            GF/F (Whatman) filters using a vacuum pump and placed
7-m depths, respectively, was collected with a submersible      in 10 mL of 90% acetone at 5  C for 18–24 h to extract
pump (Cyclone1) mounted on a telescope pole.                    the pigments. Fluorescence was measured using a 10AU
    For all samples, 6 L of water was subsampled for nucleic    Field Fluorometer (Turner Designs) before and after acid-
acids. This water was sequentially filtered through a 50-mm     ification with 5% HCL (Parsons et al., 1984). Chl a concen-
nylon mesh, a 47-mm diameter and 3-mm polycarbonate             trations were determined using the equations by Holm-
filter, and finally through a 0.22-mm SterivexTM unit (Milli-   Hansen et al. (1965). For POC analysis, subsamples from
pore Canada Ltd, Mississauga, Ontario, Canada). Large (50–      the Nalgene bottles and a filtration blank (from filtered
3 mm) and small (3–0.22 mm) fraction filters were retained      seawater) for each sampling station were filtered onto
for sequencing. The 3-mm filters were folded and placed in      precombusted (450  C for 5 h) 25-mm GF/F filters. After-
1.5-mL tubes with RNAlaterTM (ThermoFisher). The RNAla-         ward, filters were wrapped in tinfoil and stored at –80  C
ter was added to the Sterivex units, and the large and small    for later analysis using a COSTECH ECS 4010 Elemental
fraction samples were stored at –80  C until nucleic acid      Analyser coupled with a continuous-flow DeltaPlus XP
extraction. Nutrients, FCM, and microscopy samples were         Isotope Ratio Mass Spectrometer (IRMS, Thermo Electron
collected from the same depths and sample bottles.              Co, ThermoScientific, Waltham, MA, USA) at the University
    Water samples for nitrate (NO3) and nitrite (NO2; re-       of British Columbia as in Glaz et al. (2014). Microscopy
ported as the sum NO3 þ NO2), phosphate (PO4), and              samples were filtered onto black 0.8-mm polycarbonate
silicate (Si(OH)4) measurements were collected into acid-       filters, stained with 40 ,6-Diamidino-2-phenylindole dihy-
rinsed 15-mL FalconTM tubes (Corning) after the filtration      drochloride (DAPI), mounted in immersion oil onto glass
through a 0.22-mm syringe filter and analyzed on board          slides and stored at –20  C until they were examined (Joli
the ship using a Bran-Luebbe 3 autoanalyzer (Grasshoff et       et al., 2018).
Art. 9(1) page 4 of 20                                                 Jacquemot et al: Sub-Arctic estuarine transition zones

   DNA and RNA samples were co-extracted from the fil-          cross-comparisons between samples, small and large frac-
ters using AllPrep DNA/RNA Mini kit (Qiagen, Germany)           tion communities were summed together, and singletons
following the suggested protocol. For RNA purification, an      were removed from the analysis using the R package Phy-
additional DNAase step was carried out to remove possi-         loseq (McMurdie and Holmes, 2013).
ble DNA contamination. Absence of residual DNA was                 To correct for the influence of rare species and differ-
confirmed by Polymerase Chain Reaction (PCR) with eu-           ential sequencing depth, data standardization was per-
karyotic primers and the cleaned RNA as template show-          formed with the Hellinger method using vegan
ing no amplification after 30 cycles. The RNA was then          (Oksanen et al., 2007) and OTUs below the threshold of
converted to cDNA using the High Capacity Reverse Tran-         1  10–5 total relative abundance were removed from the
scription Kit (ThermoFisher, USA). The V4 region of 18S         matrix table. This correction resulted in a relative abun-
rRNA gene (rDNA) and 18S rRNA (rRNA) was amplified to           dance table of 6010 OTUs for rDNA (Table S3) and 4230
construct libraries using a combination of universal for-       OTUs for rRNA (Table S4). A Bray–Curtis distance matrix
ward E572F (CYG CGG TAA TTC CAG CTC) and reverse                was then calculated based on the relative abundance ta-
primers E1009 R (CRA AGA YGA TYA GAT ACC RT; Comeau             bles. Singletons were removed from the species table.
et al., 2016). Amplicons were tagged for multiplexing with      Distance-based multivariate regression trees (db-MRT)

                                                                                                                                Downloaded from http://online.ucpress.edu/elementa/article-pdf/9/1/00111/459987/elementa.2021.00111.pdf by guest on 02 December 2021
MiSeq1-specific linking primers, and equimolar concen-          were performed with the R package mvpart (De’Ath,
trations of amplicons were sequenced on an Illumina MiS-        2002) to explore and predict the relationship between
eq1 by the “Plateforme d’Analyses Génomiques” (IBIS,           microbial community distance and environmental vari-
Université Laval, Quebec, Canada). Raw paired-end reads        ables. This method allows partitioning of a group of sam-
have been merged with BBMmerge (Bushnell et al., 2017)          ples where each successive partition from the Bray–Curtis
and deposited in NCBI under the BioProject accession            distance predicts the influence of an environmental vari-
number PRJNA627250.                                             able. Salinity, temperature, depth, total phytoplankton
                                                                (from FCM), and nutrient concentrations (phosphate,
FCM and microscopy                                              nitrate þ nitrite and silicate) were used as explanatory
Microbial cell concentrations were measured on a BD Ac-         variables in the analysis. For each split, the method retains
curiTM C6 flow cytometer equipped with a Csampler (BD           the variable and the associated value, which minimizes
Biosciences); phytoplankton cell counts were based on           the resulting sum of within-group squared distance to the
chlorophyll red fluorescence and forward-scattered light        group mean for the response data. Six leaves were defined
(Marie et al., 2005) using a 14.7 mW 640 nm Diode Red           based on the minimum cross-validated relative error
Laser and 20 mW 488 nm Solid State Blue Laser. For              (CVRE) through 1,000 iterations. To test the robustness
phytoplankton, data acquisition was performed at a fast         of our analysis, we compared this predictive model of
flow rate (66 ml/min) for 10 min with three wash and            communities with an unconstrained method of cluster
three agitation cycles between each sample. Flow rate was       analysis (nonmetric multidimensional scaling [NMDS]) to
recalibrated daily with standard-size beads to normalize        determine whether the clustering was similar between
cell counts. Data were processed with BD CSampler Soft-         techniques. A Bray–Curtis distance matrix was performed
ware. We confirmed the presence of the diatom Rhizosole-        on Hellinger-standardized density data based on the OTUs
nia and other cells from the DAPI-stained filters with the      with the R package vegan. Environmental vectors were fit-
40 objective and appropriate settings for high resolution      ted on the ordination with the envfit function.The indicator
using an SP8 Leica confocal laser scanning microscope.          value index IndVal was used to identify specific OTUs that
Potential cyanobacterial symbionts within the cells were        characterized previously identified sample groups (Dufrêne
searched under blue laser excitation (488 nm, Lambda            and Legendre, 1997). Indicator value analysis was run with
scan 500–795 nm) targeting phycocyanin and phycoery-            the R package indicspecies (v1.7.8; Cáceres and Legendre,
thrin by using “lightning” settings on the microscope to        2009) using the multipatt function “indval.g,” and statisti-
enhance visualization.                                          cal significances of indicator taxa were tested by random
                                                                permutations of stations (999 permutations). Only OTUs
Data analysis                                                   with a p value  .001, indicator value (stat)  0.9, and high
Large (50–3 mm) and small (3–0.22 mm) fractions from 37         average relative proportions (total relative abundance
samples were sequenced (Table S1). Overlapping paired-          0.1%) were considered as significant, resulting in a final
end reads from the fastq files were merged using BBMerge        data set of 55 indicator OTUs. OTUs with low taxonomic
algorithm (Bushnell et al., 2017). The data reads were          assignment were further scrutinized with the “BLASTn”
quality filtered using vsearch (fastq_maxee ¼ 0.5). Short       algorithm against the NBCI nr database. Indicator OTUs
sequences were identified in vsearch and removed from           were represented on a ternary plot using the R package
the analysis. USEARCH was used for chimera checking and         ggtern (Hamilton and Ferry, 2018).
Operational Taxonomic Unit (OTU) picking at a threshold            To further increase the taxonomic resolution of estua-
of 98% similarity. The assignment of taxonomic identity         rine diatom OTUs of Thalassiosira, Skeletonema, and Rhi-
was performed in mothur against the PR2 Database v4.9.0         zosolenia, sequences were aligned with full-length 18S
(Guillou et al., 2013). Sequences affiliated to chloroplasts,   rRNA representative sequences using MUSCLE (Edgar,
Metazoa, and fungi were excluded from the diversity and         2004). Representative sequences were selected based on
protist proportional analysis. For information, fungi re-       blast results of OTU sequences on NCBI and previously
sults are presented separately (Table S2). For the protist      published phylogenies. Reference trees were constructed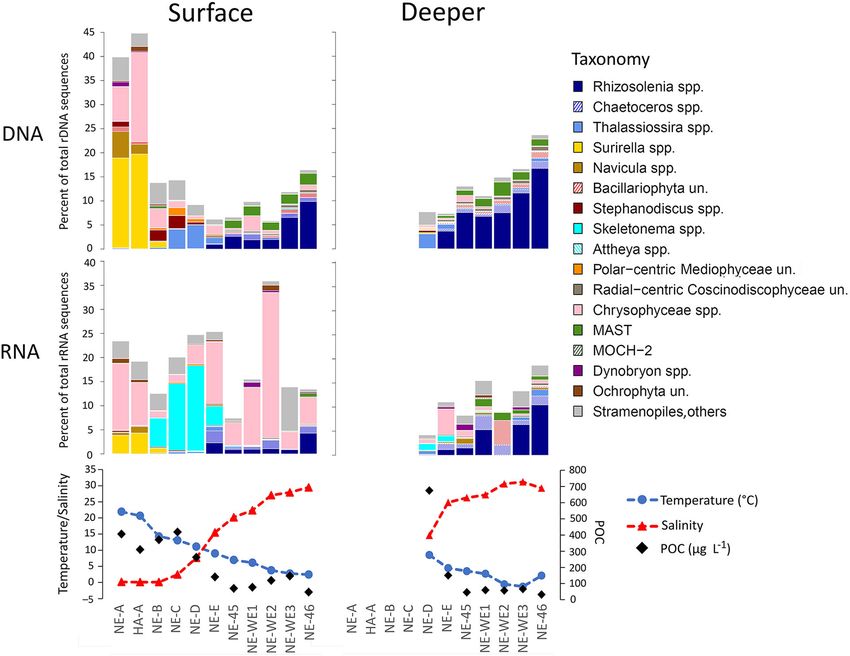
Jacquemot et al: Sub-Arctic estuarine transition zones                                                    Art. 9(1) page 5 of 20

Table 1. Environmental data for the Churchill, Nelson, and Great Whale River systems. DOI: https://doi.org/10.1525/
elementa.2021.00111.t1

                            Temperature              NO3 þ NO2         Si(OH)4        PO4         N:P        Chl a       POC
Stationa        Depth (m)      ( C)      Salinity    (mmol L–1)      (mmol L–1)   (mmol L–1)   (molar)     (mg L–1)   (mg L–2)

CH-A                  0        10.54        0.11           0.32         18.11         0.05        7.16        1.85       nab
CH-B                  0         9.85       10.9            0.03         17.72         0.32        0.03        0.44        na
CH-B                  4.5       3.21       29.44           0.01          2.89         0.49        0.08        0.54        na
CH-C                  0         8.97       23.81           0.01          6.09         0.37        0.02        0.23        na
CH-C                  7         5.35       28.72           0.01          5.01         0.36        0.03        0.25        na
CH-D                  0         7.6        27.79           0.01          3.73         0.43        0.02        0.10        na
CH-D                  7         2.24       31.2            0.01          1.11         0.51        0.03        0.27        na

                                                                                                                                   Downloaded from http://online.ucpress.edu/elementa/article-pdf/9/1/00111/459987/elementa.2021.00111.pdf by guest on 02 December 2021
CH-E                  0         4.57       30.57           0.01          1.3          0.51        0.04        0.66        na
CH-E                  7         1.65       31.69           0.02          0.42         0.55        0.03        0.20        na
GW-A                  0         na          0              0.25          2.74         0.03        9.54         na         na
GW-B                  0         na         12.5            0.03          8.56         0.88        0.03         na         na
GW-C                  0         9.56       25.33           0.07          8.36         0.27        0.24         na         na
GW-C                 27       –1.19        28.75           0.03          7.79         0.3         0.09         na         na
HA-A                  0       20.67         0.12           0.13         34.6          0.1         1.24        5.47      304.4
NE-45                 0         6.98       20.2            0.07          1.21         0.43        0.16        0.66       64.2
NE-45                10         3.85       26.51           0.19          8.55         0.5         0.37        1.13       45.8
NE-46                 0         2.47       29.46           0.42          3.5          0.58        0.29        1.19       40.6
NE-46                11         2.47       29.47           0.14          1.68         0.48        0.72        1.11        31.9
NE-A                  0        21.93        0.16           0.44         38.52         0.28        1.56        1.29      400.9
NE-B                  0        14.3         0.12           0.43         26.05         0.26        1.67        3.50      365.0
NE-C                  0        13.08        2.45           0.34         30.06         0.28        1.22        2.91      412.6
NE-D                  0        11.14        7.61           0.32         21.22         0.45        0.72        1.79      256.4
NE-D                  5         8.83       14.84           0.31         21.3          0.47        0.66        3.07      674.8
NE-E                  0         9.01       15.49           0.23         13.97         0.56        0.41        0.62      135.2
NE-E                  7         4.79       25.07           0.1           5.75         0.53        0.19        0.50      150.4
NE-WE1                0         6.13       22.37           0.05          6.51         0.44        0.12        0.70       70.8
NE-WE1                7         3.02       27.41           0.05          2.57         0.46        0.11        1.14       59.9
NE-WE2                0         3.77       27.03           0.03          2.59         0.38        0.09        0.97      113.4
NE-WE2                7       –0.2         30.8            0.04          1.84         0.5         0.09        2.75       57.0
NE-WE3                0         2.78       27.94           0.08          2.13         0.54        0.09        1.72      140.5
NE-WE3                7       –0.94        31.4            0.04          1.18         0.43        0.15        2.60       66.1
Chl a ¼ chlorophyll a; POC ¼ particulate organic carbon.
a
Station locations shown in Figure 1, except for station HA-A which was at the mouth of the Hayes River.
b
    Not available.

with RAxML (Stamatakis, 2014) under the GTR þ GAMMA                Results
model of substitution from 1,000 distinct randomized max-          Environmental characteristics and estuarine
imum parsimony starting trees (Yang, 1994). OTU queries            circulation
were placed on the reference trees using the evolutionary          Within the Nelson River system, which included the Hayes
placement algorithm in RAxML, and the expected distance            River mouth (station HA-A), river waters were very warm
between placement location value was calculated with               (>20  C) and fresh (salinity < 0.2; Table 1). The surface
PPlacer (Matsen et al., 2010). Final trees were visualized         freshwater signal persisted and salinity increased to 20 at
using the R package ggtree (Yu et al., 2017).                      NE-45 (Figure 2). More typical marine salinities of >30
Art. 9(1) page 6 of 20                                               Jacquemot et al: Sub-Arctic estuarine transition zones

                                                                                                                              Downloaded from http://online.ucpress.edu/elementa/article-pdf/9/1/00111/459987/elementa.2021.00111.pdf by guest on 02 December 2021
Figure 2. Temperature and salinity at the sample collection sites. In the left panels, transects along the Churchill and
  Nelson estuarine system are plotted using Ocean Data View, where black dots indicate depth and stations where water
  samples were collected. The deeper water sampling depths were chosen to target just off the bottom of the river
  channel and a similar depth once out of the channel but are somewhat variable due to sampling constraints on board
  the ship. These deeper offshore sample depths approximately corresponded to a subsurface chlorophyll maximum.
  The right panel shows a line plot of the salinity and temperature profiles of the marine site (GW-C) off the Great Whale
  River. Due to time and logistical constraints, we did not conduct a detailed transect of the Great Whale River. DOI:
  https://doi.org/10.1525/elementa.2021.00111.f2

Figure 3. Vertical beam transmission along the Nelson River system. Black dots indicate where the water samples were
  collected. The deeper depths at station NE-D and NE-E were just off the bottom. The deeper water sample depths were
  from similar depths once out of the channel but are somewhat variable due to sampling constraints on board the
  ship. These deeper offshore sample depths approximately corresponded to a subsurface chlorophyll maximum. DOI:
  https://doi.org/10.1525/elementa.2021.00111.f3

and colder temperatures (0  C) were measured offshore.        CH-B. Surface salinity and temperature profiles along that
The deeper (32 m) marine waters at station NE-46 were          transect showed a sharp freshwater gradient highlighting
even more saline (salinity: 31.7) and colder (–1.3  C). The   low riverine discharge (Figure 2). The water column was
orientation of isopycnals supports salinity as the major       stratified at station CH-B defined by a warm (9.8  C) and
parameter influencing stratification in the estuary (Figure    fresher (10.9) layer in the surface on top of a salty (29.4)
S1). POC concentrations (Table 1) and beam transmission        and cold (3.2  C) marine layer at 4 m, indicating a marine
indicated a sharp turbidity front where the riverine water     intrusion into the enclosed estuary (Table 1). Waters off-
meets the seawater just before station NE-D and NE-E           shore of the Churchill River system were warmer than
(Figure 3). The Churchill River water was also fresh with      those offshore of the Nelson River system (Figure S1). For
a low salinity of 0.1 but cooler than the Nelson River, with   the Great Whale River, we recorded a salinity of 0 at the
temperatures of approximately 10  C at stations CH-A and      river station GW-A and 12.5 at station GW-B (temperatures
Jacquemot et al: Sub-Arctic estuarine transition zones                                              Art. 9(1) page 7 of 20

                                                                                                                             Downloaded from http://online.ucpress.edu/elementa/article-pdf/9/1/00111/459987/elementa.2021.00111.pdf by guest on 02 December 2021
Figure 4. Eukaryote community structure along the Churchill, Nelson, and Great Whale River systems. (A) Distance-
  based multivariate regression tree analysis based on Bray–Curtis distance between 37 samples. Distances are based on
  the composition of 6010 OTUs. Shapes at the tips represent the putative similar communities (Groups 1–6) with the
  corresponding number of samples (n). Pie charts represent proportions of each taxonomic category listed, first
  separating the fresher from more marine samples and second within the groups. Red letters indicate the variance
  explained (R2) at each separation point, specifically A ¼ 0.66, B ¼ 0.07, C ¼ 0.06, D ¼ 0.03, and E ¼ 0.01. (B) Location
  of each sample with the groups along the transects. Asterisks indicate additional replicates. Note that the station at
  the Hayes River (HA-A) is not displayed on the plot but belonged to Group 6. Sample clustering was used for
  subsequent analysis and was referred to as “River” for Group 6, “Estuary” for Groups 4 and 5, and “Sea” for
  Groups 1–3. DOI: https://doi.org/10.1525/elementa.2021.00111.f4

not available). Surface water at station GW-C was relatively    values
Art. 9(1) page 8 of 20 Jacquemot et al: Sub-Arctic estuarine transition zones
Downloaded from http://online.ucpress.edu/elementa/article-pdf/9/1/00111/459987/elementa.2021.00111.pdf by guest on 02 December 2021
Figure 5. Ternary diagrams representing indicator species along the Nelson, Churchill, and Great Whale River transects.
River, Estuary, and Sea groups were defined according to the distance-based multivariate regression tree analysis
(Figure 4). Only indicator OTUs with a mean proportion >0.01% are shown. Colors correspond to the taxonomic level
as indicated in the legend, and dot sizes indicate the mean proportion of the taxa from the three ecological categories
(River, Estuary, and Sea). DOI: https://doi.org/10.1525/elementa.2021.00111.f5
systems (Groups 1, 2, and 3). Phosphate concentrations in the Nelson and Churchill River systems. In addition,
again were associated with the clustering of the marine exclusive OTUs in the three salinity environments can be
stations with the Great Whale River system having the seen at the apex of the diagrams. Freshwater communities
lowest values (Group 3; PO4 < 0.33). NO3 þ NO2 concen- (Figure 4, Group 6) were characterized by higher propor-
trations split the Western Hudson Bay marine samples tions of rare taxa (indicated here as “others”) and unclas-
into the Churchill Group 2 (NO3 þ NO2 < 0.02) and pre- sified eukaryotes. Although not classified as indicator taxa
dominantly Nelson Group 1 (NO3 þ NO2 0.02). The only by our analysis, three offshore Great Whale River OTUs
geographic exception was the deeper sample at station with a high proportion (0.8%–1.5%) of surface rDNA
CH-E, which was associated with Group 1. These results reads (Supplementary Data S1) were affiliated to the tem-
were consistent with clustering in the unconstrained perate Micromonas commoda clade (Figure S6B). The
NMDS analysis (Figure S3). “riverine” community at all three sites was composed of
Relative proportions of 18S rDNA (Figure S4) and rRNA typical freshwater and brackish organisms. In the Nelson
(Figures S5 and S6) reads along the transects revealed River, these organisms were represented by Chrysophy-
marked changes in microbial community composition ceae clade C, freshwater Dinobryon spp., and freshwater
from the rivers to the oceanic waters. Relative contribu- representatives of the diatom genera Surirella and Navi-
tions and abundance of OTUs that contributed to the cula (Figure 6). The marine communities (Groups 1–3)
three salinity environments in the three systems were were composed of higher proportions of Dinophyceae,
plotted on ternary diagrams and showed the sharp distinc- Choanoflagellatea, Prymnesiophyceae, Telonemia, and Ma-
tion of the river and sea communities in the three systems miellophyceae. Estuarine communities (Groups 4 and 5)
(Figure 5). The diagrams also showed a progressive both showed an increase in proportions of reads affiliated
replacement, in terms of percent community contribu- with heterotrophic taxa including Cercozoa and Katable-
tion, among shared OTUs between the estuary and sea pharidaceae (Figures S4–S6). Ciliates showed an increas-
taxa in all three systems and the river and estuary taxa ing proportion of reads in the estuarine transition zone ofJacquemot et al: Sub-Arctic estuarine transition zones Art. 9(1) page 9 of 20
Downloaded from http://online.ucpress.edu/elementa/article-pdf/9/1/00111/459987/elementa.2021.00111.pdf by guest on 02 December 2021
Figure 6. Relative abundance of sequences assigned to diatoms and other Stramenopiles along the Nelson River
transect. Top panels show data from the rDNA (gene) analysis and middle panel from the rRNA analysis. The
bottom panels show (left axis) salinity and temperature ( C) and (right axis) particulate organic carbon (in mg L–1)
at the surface and deeper samples along the same transect. DOI: https://doi.org/10.1525/elementa.2021.00111.f6
all three river systems, but the composition of the estua- indicator taxa (Group 2) included two representatives of
rine ciliate communities differed among the estuaries the Marine Ochrophyta group MOCH-2 (Massana et al.,
(Figure S7A). In the Churchill River estuary, herbivorous 2014; OTUs 2730 and 745), several Cercozoan OTUs
ciliates Urotricha spp. and Didiniidae spp. increased in including Protaspa spp. (OTU 1771), the Bolidophyceae
relative proportions while Mesodinium spp. and Strombi- classified as Triparma strigata (OTU 1205), the haptophyte
dium spp. were recovered from the Great Whale River Chrysochromulina sp. (OTU 327), and the choanoflagellate
estuary. The most abundant OTU in the Great Whale River Lagenoeca antarctica (OTU 1323). Offshore the Great
estuary was related to Mesodinium rubrum (Myrionecta Whale River (Group 3), which included both surface and
rubra). The Nelson River estuarine groups included more Subsurface Chlorophyll Mamimum (SCM) offshore data,
diatoms with genera classified as Thalassiosira and Skele- indicator OTUs were classified as Syndiniales (OTU 3280
tonema. The Thalassiosira OTUs mapped to a node consist- and 913), and an OTU affiliated with the marine Strame-
ing of Thalassiosira pseudonana and Thalassiosira nopiles MAST_4D (OTU 587; Figure 7).
weissflogii (Figure S8), and the Skeletonema OTUs mapped The Nelson offshore indicators (Group 1) were Rhizoso-
to Skeletonema potamos (Figure S9). lenia spp. and an OTU matching Strombidiida B (PR2 clas-
sification). We examined the Nelson offshore indicators in
Indicator species of coastal heterogeneity more detail as more samples had been taken along that
To visualize the indicators of the three offshore groups marine transect. The diatoms were placed on the Rhizoso-
from Figure 4, we plotted the relative proportion of indi- leniales reference tree with most at a node of Rhizosolenia
cator species (Figure 7; Table S5) based on the three spp. An unclassified diatom (OTU 184) was placed on the
groups (Groups 1–3) that segregated the three regions. lower branches of a reference phylogenetic tree (Figure
This visualization highlighted species that were present S10). These Rhizosoleniales were highly specialized to
in a single region and showed species present in two the Nelson River system (at the apex of the ternary plot;
regions to the exclusion of a third. Churchill offshore Figure 7).Art. 9(1) page 10 of 20 Jacquemot et al: Sub-Arctic estuarine transition zones
Downloaded from http://online.ucpress.edu/elementa/article-pdf/9/1/00111/459987/elementa.2021.00111.pdf by guest on 02 December 2021
Figure 7. Ternary diagram representing indicator species OTUs of the marine communities. Group 1 (offshore Great
Whale River), Group 2 (mostly offshore Churchill River), and Group 3 (offshore Nelson River) were defined according
to the distance-based multivariate regression tree analysis. Colors represent the higher-level taxonomy of the OTUs
and dot sizes indicate the mean proportion of each OTU (species level) in the three groups. Taxa placed at the
extremities of the ternary diagram can be considered specialists, while taxa placed between groups are more
generalists. DOI: https://doi.org/10.1525/elementa.2021.00111.f7
The Churchill (Group 2) and Nelson River (Group 1) in the Nelson River offshore samples (Figure S11a).
coastal systems shared a number of taxa that were absent Although we could clearly distinguish chloroplasts, no
from the Great Whale River coastal region. The Churchill cyanobacteria with phycocyanin or phycoerythrin fluores-
River coastal system also shared taxa with the offshore cent signals were detected inside of the frustules, suggest-
Great Whale River system (Group 3). No indicator taxa ing the absence of the potential N-fixing symbionts within
were shared between the Great Whale and the Nelson the Rhizosolenia cells (Figure S11b).
Rivers. The cryptophyte Teleaulax gracilis (OTU 2014) was
the main photosynthetic OTU in the Western Hudson Bay Discussion
(Nelson and Churchill River coastal region). More strik- Salinity as a dispersal barrier
ingly was the number of heterotrophic flagellates shared Salinity was the major environmental parameter separat-
between the two sites, Ebriida sp. (OTU 383) and Minorisa ing microbial communities along the three transects
sp. (OTU 199), Telonema (OTU 222, 555, 1098, 2554 and (Figure 4). The Nelson and Churchill River systems have
818), Cryothecomonads (Protaspa; OTU 712 and 543), the very different freshwater and seawater mixing regimes. At
choanoflagellate Stephanoecidae (OTU 896), and a thecofi- the time of sampling, the Nelson River estuary had warm
losean in the Ventricleftida (OTU 1239). The shared taxa and fresh riverine water grading into cold and salty marine
between the Churchill and Great Whale coastal region water. The gradual dissipation of freshwater and cooler
included different heterotrophic flagellates: MAST_1A surface waters suggested that the Nelson River plume
(OTU 605), Picozoa—a centroheliozoan Pterocystida sp. extended up to 25 km offshore from the river mouth
(OTU 1554), and an environmental clade of Dinoflagel- (Figure 2). The freshwater discharge rate, underlying geo-
lates (OTU 86, 21806 and 2032). In addition, there were morphology (a channel), and estuarine circulation led to
several diatoms including Chaetoceros neogracile (OTU the development of a strong maximum turbidity zone at
1928) and Chaetoceros decipiens (OTU 7975) common to the convergence of marine and riverine waters (Figures 2
the Churchill (Group 2) and Great Whale (Group 3) Rivers. and 3). In contrast, for the Churchill estuary, the salinity of
The diatom genera in surface coastal waters were the deeper layer was more uniform with open ocean salinity
confirmed by confocal microscopy by examining the near the bottom of the sampled river region. This saline
DAPI-stained microscopy filters under a range of water below the fresh riverine water caused strong vertical
excitation–emission settings. Major diatom taxa included stratification at the CH-B station with little evidence of
Halochaete Chaetoceros spp. and Rhizosolenia. As with the freshwater offshore (Figures 2 and S1). The different salin-
indicator analysis, Rhizosolenia was particularly common ity profiles reflected the strength of the river runoff, whichJacquemot et al: Sub-Arctic estuarine transition zones Art. 9(1) page 11 of 20
differs greatly between these two Western Hudson Bay estu- bloom followed ice breakup in mid-May depleting nutri-
aries and would have been amplified by the ongoing ents in the surface mixed layer (Barbeido de Freitas et al.,
Churchill River diversion into the Nelson catchment begin- n.d.; Matthes et al., n.d,). The accepted phenology of Arctic
ning in 1974 (Newbury et al., 1984; Déry et al., 2016). phytoplankton is that assemblages move from a peak of
The influence of salinity on the microbial communities diatom or Phaeocystis colonies, depending on the avail-
was not surprising and suggests that the sub-Arctic com- ability of silica, to small single-celled flagellates that rely
munities in summer are driven by similar salinity con- on recycled nitrogen sources such as ammonium and urea
straints as reported in temperate estuaries for protist (Mei et al., 2003; Simpson et al., 2008; Joli et al., 2017). At
communities (Muylaert et al., 2009; Bazin et al., 2014; Lee the time of sampling, NO3 þ NO2 and silicate concentra-
et al., 2017; Filker et al., 2019). The microbial communities tions were 10-fold higher in the Nelson offshore samples
in the three river systems all contained characteristic compared to the Churchill samples (0.1 compared to
freshwater “riverine” taxa. The proportion of the reads 0.01). The lower nitrate concentrations in the offshore
from freshwater organisms abruptly declined with increas- Churchill River were consistent with the opening of the
ing salinity, and freshwater eukaryotes were essentially northwestern Hudson Bay coastal polynya and a preco-
absent in marine waters, indicating a clear dispersal bar- cious bloom developing at the ice edge of the polynya.
Downloaded from http://online.ucpress.edu/elementa/article-pdf/9/1/00111/459987/elementa.2021.00111.pdf by guest on 02 December 2021
rier. Both the upper and lower estuarine communities The bloom was evident in the Nelson River estuary a few
contained a mix of freshwater, marine, and presumably weeks later when Rhizosolenia was found at the seaward
euryhaline or lower-salinity (brackish) taxa. Taxonomic dif- station NE-46 (Figure 6).
ferences between marine and freshwater groups have Rhizosolenia spp. are found in both marine and brack-
been observed in bacteria, archaea, and unicellular eukar- ish waters and can form huge blooms in temperate estu-
yotes consistent with evolutionary separation between aries and coastal waters (Rousseau et al., 2002). They have
marine and freshwater lineages (reviewed by Logares et been consistently reported in Arctic Seas over the past 100
al., 2009). Among parameters that could prevent local years (Lebour, 1930), and some species have a pan-Arctic
adaptation of riverine organisms to high-salinity condi- distribution (Lovejoy et al., 2002; Poulin et al., 2011).
tions is a slower cellular division rate as a cost of osmo- Although the molar N:P ratio was low, the relatively high
regulation (Demmig-Adams et al., 2017) exposing taxa to proportions of Rhizosolenia in both rDNA and rRNA reads
competition with locally adapted lineages and net losses in the offshore stations of the Churchill and Nelson Rivers
by predation. On the other hand, marine or ice-associated suggest that Rhizosolenia cells were active. Some Rhizoso-
species could be selected against in the warmer surface lenia spp. can bypass nitrogen limitation by forming an
waters from the stratified estuaries as Arctic species tend endosymbiotic association with the nitrogen-fixing cyano-
to be temperature sensitive (Lovejoy et al., 2007; Daugb- bacteria Richelia spp. (Villareal, 1990; Singler and Villareal,
jerg et al., 2018). Thus, although the temperature was not 2005; Zeev et al., 2008). Although we could clearly distin-
considered as the most influential parameter separating guish chloroplasts, we were not able to detect cyanobac-
estuarine and marine groups, the estuary could also rep- terial symbionts within the Rhizosolenia cells using
resent a possible thermal barrier for the observed marine a confocal microscope (Figure S11). At the time of the
species as the temperature in the shallower river water Nelson River sampling, the limit of the mobile ice cover
tended to covary with salinity. (defined as 50% ice concentration) was approximately 90
km offshore of the estuary and a large phytoplankton
Coastal communities as an indicator of regional bloom was observed in the open water at the ice edge
conditions (LC Matthes, personal communication). Rhizosolenia
The three coastal communities were composed exclusively blooms are also reported to be associated with ice-edge
of marine taxa (Figure 5), but the species composition conditions and have been used to trace ice conditions and
differed. Based on the Bray–Curtis distance, the offshore carbon flow through the polar marine trophic web (Goutte
marine coastal communities were separated into distinct et al., 2013; Brown et al., 2018), and Rhizosolenia may have
Nelson, Churchill, and Great Whale River clusters (Groups been part of an ice-edge bloom. The healthy chloroplasts
1, 2, and 3, respectively; Figure 4). The only exception was seen under confocal microscopy and the presence of Rhi-
the deeper water community at CH-E, which clustered zosolenia in the rRNA libraries suggest that light and nutri-
predominantly with the Nelson River Group 1. Phosphate ent levels continued to be favorable closer inshore where
and NO3 þ NO2 concentrations were the main factors they may have arrived initially through estuarine
separating the three coastal locations but accounted for circulation.Art. 9(1) page 12 of 20 Jacquemot et al: Sub-Arctic estuarine transition zones
waters affected by ice melt (Thaler and Lovejoy, 2012). communities were a mix of specialist taxa, freshwater and
Another identified indicator species was an environmental marine species. The marine diatom species, mostly Chae-
Marine Ochrophyta MOCH-2, which is one of the five toceros spp. found in the Churchill and Great Whale River
MOCH groups described to date and most likely feeds transition zones, tended to decrease toward the shore
on bacteria (Massana et al., 2014), as would the OTU with consistent with advection and loss of taxa shoreward. In
the closest match to the choanoflagellate L. antarctica, the Nelson River transition zone, several diatom OTUs
originally isolated from deep Antarctic waters (Nitsche et with closest matches to the euryhaline species S. potamos,
al., 2007). Two small photosynthetic protists were also T. pseudonana, and T. weissflogii (Hevia-Orube et al., 2016)
recorded as indicators of Churchill River coastal waters: were found at the intermediate salinities in both rRNA
the Prymnesiophyceae Chyrsochromulina sp., a mixo- and rDNA libraries (Figures 6, S8, and S9). The same
trophic taxon reported in highly stratified or ice species contribute to phytoplankton blooms in temperate
melt–freshened waters in the Arctic (Comeau et al., coastal environments (Cloern et al., 1985; Urrutxurtu et
2013; Lovejoy, 2014; Ardyna et al., 2017), and a Parmales al., 2003; Quinlan and Phlips, 2007; O’Boyle and Silke,
(bolidophyte), with match closest to T. strigata (99.5%) 2010). In particular, S. potamos is a common species in
and environmental sequences including those from the temperate rivers and lakes of Europe and North America
Downloaded from http://online.ucpress.edu/elementa/article-pdf/9/1/00111/459987/elementa.2021.00111.pdf by guest on 02 December 2021
Arctic (Terrado et al., 2013). Non-silicious bolidophytes are but can grow at salinities up to 24 (Paasche, 1975; Torgan
reported to be mixotrophic, consuming bacteria (Piwosz et et al., 2009). The spatial distribution of these brackish
al., 2013), but whether the OTU represented a flagellate or diatoms in the Nelson River estuary coincided with
silicified form cannot be stated without confirmation by silicate-rich waters and the maximum of POC concentra-
electron microscopy (Yamada et al., 2020). In summary, tions measured at the surface (Figure 6).
following ice breakup about 1 month earlier (beginning Heterotrophic flagellates and ciliates have been re-
of June 2018), most of the indicator species off the ported from turbidity zones of major rivers flowing into
Churchill estuary were associated with postbloom condi- the sea, for example, the Saint Lawrence (Lovejoy et al.,
tions with increasing surface temperature, remaining 1993) and the Columbia River (Herfort et al., 2011). In
mobile sea ice and low inorganic nutrients concentrations Hudson Bay, we found distinct communities of heterotro-
in the area at the time of sampling (July 4, 2018). phic protists in all three estuarine transition zones, con-
Two of the indicator taxa from the marine coastal Great sistent with a distinct euryhaline habitat. In the Nelson
Whale River (Figure 7) belonged to the marine parasitic River estuary, high POC concentrations and low beam
order Syndiniales (Guillou et al., 2008). Because these transmission signals (Figures 3 and 6) in the transition
parasites tend to infect dinoflagellates and other hetero- zone were indicative of a maximum turbidity zone. Both
trophs that occur later during the postbloom stage, their rDNA and rRNA Nelson River estuary data sets indicated
predominance is consistent with the offshore Great Whale higher proportion of phagotrophic thecofilosean Cercozoa
River system being at a later bloom state on July 7 and including lineages related to Mataza sp. and Ventricleftida
supported by the earlier opening of Eastern Hudson Bay in sp. (Figure S5). Many of these flagellated amoebae are
2017 relative to 2018 (Kirillov et al., 2020). The presence described from soil and freshwater habitats but are not
of M. rubrum along with fewer cryptophytes would also be restricted to these environments. For example, the first
consistent with being later in the bloom stage. A third described Mataza was isolated from a surface seawater
Great Whale River marine OTU was placed within the sample in Tokyo Bay (Yabuki and Ishida, 2011), and related
uncultured marine stramenopile clade MAST_4. Members lineages have also been detected in both fresh and brack-
of MAST_4 are picoplanktonic protists widely reported in ish waters in the estuary of the Vistula River in the Baltic
temperate waters but rare in Arctic samples (Massana et Sea (Piwosz et al., 2018). Katablepharidales, another pha-
al., 2004, 2014). The clade was previously reported from gotrophic flagellate group, were also found in the brackish
western Arctic surface waters, however, during the then environment of the Nelson River, including 13 OTUs
record warm summer in 2005 (Lovejoy and Potvin, 2011), closely related to Katablepharis japonica, which is
which suggests that warmer water species may have been a broad-spectrum predator, feeding on heterotrophic bac-
present in Hudson Bay at the time of sampling. In support teria, diverse phytoplankton, dinoflagellates, and ciliates
of this notion was the high proportion of surface rDNA (Kwon et al., 2017). The relatively high proportions of
reads affiliated with the temperate M. commoda clade Katablepharis and other phagotrophs in the Nelson estu-
(Figure S6B). The M. commoda clade co-occurred with Mi- ary suggest that local conditions in the estuarine environ-
cromonas polaris. M. polaris has a pan-Arctic distribution ment favor the development of an autochthonous
and has been reported throughout the year (Lovejoy et al., heterotrophic community in the estuarine transition zone
2007; Joli et al., 2017). The presence of the more temper- (Figures S4 and S5). Moreover, the peak of rDNA Katable-
ate taxa in the relatively warm surface water (9 C) at GW- pharis reads at station NE-C coincided with the position of
C suggests that warming of surface water favors non-Arctic the turbidity front (Figures 3 and S4). A similar ecologi-
populations of coastal protists in Hudson Bay, but as of cally constrained distribution of Katablepharis was previ-
yet, Arctic species are not excluded. ously reported in the estuarine turbidity maximum zone
of the Columbia River (Herfort et al., 2011; Kahn et al.,
Estuaries as a separate ecological habitat 2014). Herfort et al. (2011) hypothesized that Katable-
A distinct estuarine community was detected in the tran- pharis cells may be retained as cysts in the turbidity max-
sition zones of all three river systems (Figure 5). The imum; however, the co-occurrence with other bacterivoresJacquemot et al: Sub-Arctic estuarine transition zones Art. 9(1) page 13 of 20
(Telonemia, Mataza, and Ventricleftida) in our rRNA data A specialized estuarine community in the transition
would be consistent with an active in situ grazer commu- zone
nity (Figure S5). The formation of a transition zone in an estuary is the result
Ciliates accounted for a greater proportion of reads in of complex freshwater and marine interactions that are
the estuarine transition zone of all three river systems, highly variable in time and space and differ substantially
but with species differences found in the three systems. among estuaries (Uncles et al., 2002; Burchard et al., 2018).
Ciliates are a significant component of the Arctic mixo- In temperate and sub-Arctic seas, estuarine fronts observed
trophic protist communities (Stoecker and Lavrentyev, at the convergence of river runoff and tidal forcing can trap
2018), and in the Great Whale River estuarine region, the suspended sediments and planktonic organisms in a maxi-
most abundant OTU was related to M. rubrum (M. rubra). mum turbidity zone, which is a common feature in estuar-
This ciliate, which is part of a species complex (Lasek- ies (Frenette et al., 1995; Hetland and Hsu, 2013). Within
Nesselquist and Johnson, 2019), is routinely reported this “hydrodynamic trapping” environment, conditions of
from temperate estuarine communities and has also high turbidity, low light, high organic matter accumulation,
been reported to form blooms at the ice–water interface and high microbial activity should be advantageous for
during pack ice formation in the Arctic Ocean (Olsen et heterotrophic and mixotrophic plankton. In the Nelson
Downloaded from http://online.ucpress.edu/elementa/article-pdf/9/1/00111/459987/elementa.2021.00111.pdf by guest on 02 December 2021
al., 2019). M. rubrum is dependent on sequestered chlor- River, the estuarine circulation led to the formation of a tur-
oplasts from cryptophyte prey such as Teleaulax and Pla- bidity front between station NE-C and NE-E that coincided
gioselmis, which were also found in the same Great with the peaks observed for several estuarine species (Fig-
Whale River samples. Teleaulax itself is favored by low ures 7, S4, and S5). Heterotrophic flagellates such as Kata-
light conditions (Johnson et al., 2006), suggesting that blepharis or Cercozoa and ciliates were retained there and
there may have been a turbidity zone at this site; unfor- would sustain an active microbial food web by influencing
tunately, we were not able to measure CDOM or POC at bacterial dynamics, carbon remineralization, and nutrient
the time. The Nelson River brackish conditions in the regeneration through phagotrophy and grazing. Diatoms
estuary tended to favor ciliates Tintinnidium spp., Didi- were also recovered in the Nelson River turbidity maximum
niidae spp., and Litostomatea spp. These genera were zone, highlighting that some taxa were able to grow and
previously reported from brackish environments, in the adapt to low light conditions when nutrients, especially
upper part of the transition zone with Strombidium spp. silicate, are available. In the Churchill and the Great Whale
and in the lower part, as previously detected in other systems, the estuarine community was constrained in a nar-
Arctic marine samples (Onda et al., 2017). The spatial rower transition area and was mainly composed of mixo-
repartition of the brackish community in the estuaries trophic ciliates. This difference in the composition and
appears to be species-specific and suggests multiple eco- distribution of the estuarine community may be related
logical niches in the estuarine transition zones, especially to geomorphology and lower river discharge of the Church-
in the Nelson River where two distinct estuarine commu- ill and Great Whale Rivers compared to the Nelson River.
nities were identified (Figures 6, S4, and S5). However, for the Great Whale River sampled in 2017, inter-
The definition of the estuary as a boundary between annual variability cannot be ruled out since the river runoff
freshwater and marine systems has been the subject of and the start of the productive season might differ. Prelim-
debate, with two types of transition zones proposed: eco- inary hydrodynamic modeling in the Nelson River estuary
cline and ecotone (Kent et al., 1997; Attrill and Rundle, has shown that water could reside in the transition zone
2002). For most of the protist groups, the patterns of more than 30 days before flushing out (K Wong and K Sydor,
community assemblage along the gradient resembled pro- Manitoba Hydro, personal communication). Such a period
gressive change from fresh to brackish and from brackish would be long enough to allow the development of an
to marine, with few species occurring across the whole adapted autochthonous community that may move within
transition (Figure 5). A gradient in protist assemblages the turbidity front depending on river runoff and tidal cycle.
from the river to the marine systems would support the
view of the estuarine ecocline. However, we distinguished Perspective
a distinct subset of estuarine species in all three systems, The question remains as to how protist assemblages in
with the Nelson River, which was also the most intensively coastal Hudson Bay might change in response to different
sampled, having the highest representation of estuarine river flow regimes, whether as a result of climate change
taxa (Figure 5). These species distributions fit with the or managed discharge. In temperate estuaries, ecological
definition of an ecotone, which is a narrow ecological disturbance associated with freshwater regulation has
zone between two different and relatively homogeneous been described in the Guadiana estuary, where abundance
ecosystems. This community was composed of few species and biomass of diatoms and cyanobacteria decreased
that may have an inherent ecological tolerance and resi- (Domingues et al., 2014), and in the Danube River, where
lience to stress induced by the high environmental vari- a shift from a diatom to a flagellate-based community was
ability (Elliott and Whitfield, 2011). From our attributed to a reduction of silica discharge (Humborg et
observations, the definition of the estuarine boundary as al., 1997, Rocha et al., 2002). What we have shown here is
an ecotone or an ecocline was variable, depending on the that the three estuaries had different species assemblages,
taxa studied, highlighting the estuarine transition zone as with the Nelson River system being more mixotroph and
a combination of the two ecological concepts rather than heterotroph-dominated in keeping with the presence of
a clear distinction between the two. a maximum turbidity zone. The extent, location, andYou can also read