Q3 2018/19 PRESENTATION BY CEO PETER RØPKE & CFO MORTEN AXEL PETERSEN WIRELESS WISDOM WORKS IN ANY ENVIRONMENT

Page created by Derek Patton
 
CONTINUE READING
Q3 2018/19 PRESENTATION BY CEO PETER RØPKE & CFO MORTEN AXEL PETERSEN WIRELESS WISDOM WORKS IN ANY ENVIRONMENT
COPENHAGEN | 30 AUGUST 2019

                  R T X P R E S E N TAT I O N
                            Q3 2018/19

                                    PRESENTATION BY
                                  CEO PETER RØPKE &
                           CFO MORTEN AXEL PETERSEN

WIRELESS WISDOM
WORKS IN ANY
ENVIRONMENT
Q3 2018/19 PRESENTATION BY CEO PETER RØPKE & CFO MORTEN AXEL PETERSEN WIRELESS WISDOM WORKS IN ANY ENVIRONMENT
DISCLAIMER

This presentation contains statements regarding expectations for the future development of RTX A/S, in particular the direction of
future product development, future sales, operating profits and business expansion.

Such statements are subject to risks and uncertainties as various factors, many of which are outside the control of RTX, may cause the
actual development and results to differ materially from the expectations expressed directly or indirectly in this presentation.

Factors that might affect such expectations include, among others, rapid technological changes and evolving markets, overall economic
and business conditions, fluctuations in currencies, demand for RTX’s services, competitive factors in the market and uncertainties
concerning possible investments.

                                                                                                             RTX Presentation Q3 18/19 - 30 Aug 2019   2
Q3 2018/19 PRESENTATION BY CEO PETER RØPKE & CFO MORTEN AXEL PETERSEN WIRELESS WISDOM WORKS IN ANY ENVIRONMENT
AGENDA

1.   RTX BUSINESS MODEL                                          9:00 – 9:15

2.   FINANCIAL RESULTS Q3 AND 9M 2018/19                         9:15 – 9:30

3.   BUSINESS UPDATE Q3 2018/19                                  9:30 – 9:40

4.   OUTLOOK 2018/19                                             9:40 – 9:45

5.   Q&A SESSION                                                 9:45 – 10:00

                                           RTX Presentation Q3 18/19 - 30 Aug 2019   3
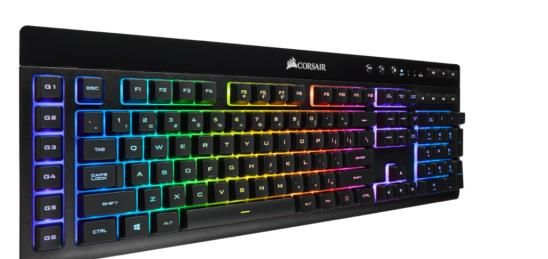
Q3 2018/19 PRESENTATION BY CEO PETER RØPKE & CFO MORTEN AXEL PETERSEN WIRELESS WISDOM WORKS IN ANY ENVIRONMENT
STRENGTH PROFILE

RTX has a:

• Market-leading position in wireless solutions.

• Proven ability to develop, innovate and manufacture customized solutions.

• Dedicated growth strategy - focus on 4 business areas: Enterprise, Headset, ProAudio and Healthcare.

• Solid business model with high degree of recurring revenue from loyal customers.

• High profitability, that can be maintained with the right product mix.
• Leverage opportunity within the current business setup.

• Sustained focus on shareholder value - CFFO invested in value creation or paid back to the shareholders.

                                                                                                RTX Presentation Q3 18/19 - 30 Aug 2019   4
Q3 2018/19 PRESENTATION BY CEO PETER RØPKE & CFO MORTEN AXEL PETERSEN WIRELESS WISDOM WORKS IN ANY ENVIRONMENT
RTX @ A GLANCE

RTX is a global company with 25 years of extensive experience and knowledge in design of advanced wireless short-range radio systems
and products. Our heritage has provided us with a unique combination of software and hardware capabilities through which RTX
manages projects for globally recognized customers, from conceptualization to finished products and modules.

                                                                                                                                                              Globally certified

1993            Founded in 1993 and
                headquarter in Denmark      +1,000              Projects
                                                                completed            264          FTE employees by 30
                                                                                                  September 2018                 ISO       9001               according to
                                                                                                                                                              ISO 9001:2015

REVENUE & GROWTH                                      EBITDA & EBITDA-MARGIN                                       EBIT & EBIT-MARGIN
DKKm                                             %    DKKm                                             %           DKKm                                                     %
500                                              25   100                                              20          100                                                     20
400                                              20    80                                              15           80                                                     15
300                                              15    60                                                           60
                                                                                                       10                                                                  10
200                                              10    40                                                           40
100                                              5     20                                              5                                                                   5
                                                                                                                    20
  0                                              0      0                                              0                0                                                  0
       2013/14 2014/15 2015/16 2016/17 2017/18               2013/14 2014/15 2015/16 2016/17 2017/18                        2013/14 2014/15 2015/16 2016/17 2017/18
                  Revenue      Growth %                                 EBITDA      EBITDA %                                            EBIT       EBIT-margin

                                                                                                                                       RTX Presentation Q3 18/19 - 30 Aug 2019     5
Q3 2018/19 PRESENTATION BY CEO PETER RØPKE & CFO MORTEN AXEL PETERSEN WIRELESS WISDOM WORKS IN ANY ENVIRONMENT
W H AT W E D O

Enterprise                                                                               ProAudio
In the Enterprise segment, RTX designs, develops,              With years of experience in ProAudio
and supplies wireless IP telephony solutions used                         design, development and
in communication systems for professional use,                   manufacturing, RTX has gained the
e.g. in office environments, call centers, retail or           expertise to deliver incredible sound
storage facilities etc. The wireless IP telephony                          quality in high-density RF
solutions are supplied on both an ODM and an                 environments as well as in challenging
OEM / white label basis.                                      radio environments having high inter-
                                                                                symbol interference.

                                                                                       Healthcare
                                                         In the Healthcare segment, RTX is involved
Headsets                                                  in the development, design and supply of
As an Enterprise adjacency, the RTX                         wireless modules and products used for
headset range for call centers & offices                 continuous patient monitoring in hospitals
consists of several different models                      as well as the design of wireless solutions
from high-end to low-end, supporting                   for projects in assisted living such as hearing
customer demand for high quality and                                                   aid accessories.
deep integration.
                                                                RTX Presentation Q3 18/19 - 30 Aug 2019   6
H O W W E W O R K : M O V I N G F R O M D E S I G N TO P R O D U C T S
TO G E N E R AT E R E C U R R I N G R E V E N U E

Taking a customer-centric approach, understanding market trends and acting as a professional partner is an
integral part of how we do business at RTX. We believe that we provide a true value proposition and best
results when collaborating closely with our customers – either through projects or in ODM or OEM solutions.

SPECIFICATION AND                          DEVELOPMENT AND                      TESTING AND                           PRODUCTION AND SUPPLY
DESIGN                                     INTEGRATION                          CERTIFICATION                         CHAIN MANAGEMENT

 At RTX, we start by combining             Following agile development          Based on years of experience,         Using a well-established
 customers’ requirements and user          practices, we develop prototypes     our in-house pretest services         network of ISO9001, SO14001,
 needs with our wireless know-how into     to evaluate system performance in-   reduce your time to market and        ISO13485, TS16949 and AS9100
 a Product Requirement Specification.      house. We integrate each design at   lower approval and certification      certified manufacturers,
 Our engineering teams then design a       system level so that every           costs. If required, we can also       we guarantee a production
 solution that is based on the right       component and sub-system works       handle the full type approval         through the entire product life-
 combination of mechanics, hardware        perfectly, evaluating performance    service for our customers.            cycle.
 and software. Combined with our list of   against test cases for the fully
 patented solutions and in-house           integrated system.
 developed protocols, we promise our
 customers a compelling result.

                                                                                                                   RTX Presentation Q3 18/19 - 30 Aug 2019   7
RTX BUSINESS MODEL HAS INHERENT TIME -LAG FOR
RECURRING REVENUE
                                 Illustrative RTX Business Case by Product Life Cycle

        Effort & Revenue
                                                                                                               Revenue
                                                                                                               Engineering Effort
                                                                    ODM/OEM Revenue

                   NRE Revenue

                                                                                                       Years
                           Y1           Y2           Y3        Y4            Y5         Y6      Y7

                                                                                             End of
                   Development          Ramp Phase                     Main Phase
                                                                                              Life

                                                                                                     RTX Presentation Q3 18/19 - 30 Aug 2019   8
W I T H S I M U LTA N EO U S D E V E LO P M E N T S , T H E E F F E C T O F
T I M E - L A G M AY B E C O M P O U N D E D
                                                       Customer X: Project Xxx
                                           Customer C: Project Charlie
                                       Customer B: Project Bravo
                                  Customer A: Project Alpha
    Effort & Revenue                      (Illustrative)                                Revenue
                                                                                        Engineering Effort

                                                ODM/OEM Revenue

               NRE Revenue

                                                                                      Years
                        Y1   Y2   Y3             Y4            Y5           Y6   Y7

                                                                                                             RTX Presentation Q3 18/19 - 30 Aug 2019   9
F O C U S E D G R O W T H S T R AT E G Y

                      RTX Focus Segments                                                  RTX Growth Strategy

            Total = 475m
                 6%        Healthcare                               Strengthen position in Healtchcare
Design
                                                                        • Increase share-of-wallet
Services
                26%        ProAudio                                 Utilize unique position in ProAudio
                                                                        • Leverage unique technology into recurring revenues
                                                                        • Lead the transition into digital wireless

Business        68%        Enterprise                               Expand leadership and grow into adjacencies in Enterprise
Commu-                     (wireless IP & telephony and headsets)      • Continue to gain share and consolidate market
nications
                                                                       • Recurring revenue from long-term customer agreements
                                                                       • Leverage position to establish a presence Headsets as an adjacency
                                                                       • Utilize system integration as competitive advantage

               Revenues
               2017/18
                                                                                                              RTX Presentation Q3 18/19 - 30 Aug 2019   10
WHO WE WORK FOR

                  RTX Presentation Q3 18/19 - 30 Aug 2019   11
AGENDA

1.   RTX BUSINESS MODEL                                          9:00 – 9:15

2.   FINANCIAL RESULTS Q3 AND 9M 2018/19                         9:15 – 9:30

3.   BUSINESS UPDATE Q3 2018/19                                  9:30 – 9:40

4.   OUTLOOK 2018/19                                             9:40 – 9:45

5.   Q&A SESSION                                                 9:45 – 10:00

                                           RTX Presentation Q3 18/19 - 30 Aug 2019   12
GROUP HIGHLIGHTS FROM Q3 2018/19
REVENUE                        EBITDA                 EBIT                          EBITDA-MARGIN            CFFO                             EQUITY RATIO

DKK 149m DKK 30m                                      DKK 26m                       20%                      DKK 34m                          73%

REVENUE                                                EBITDA                                                EBIT
DKKm                                                   DKKm                                                  DKKm
160                                                     35                                                    35
140                                                     30                                                    30
120                                                     25                                                    25
100
                                                        20                                                    20
 80
                                                        15                                                    15
 60
 40                                                     10                                                    10
 20                                                      5                                                     5
  0                                                      0                                                     0
       Q3 14/15 Q3 15/16 Q3 16/17 Q3 17/18 Q3 18/19           Q3 14/15 Q3 15/16 Q3 16/17 Q3 17/18 Q3 18/19          Q3 14/15 Q3 15/16 Q3 16/17 Q3 17/18 Q3 18/19

                                                                                                                               RTX Presentation Q3 18/19 - 30 Aug 2019   13
GROUP P&L Q3 AND 9M 2018/19
DKK million                               Q3 18/19   Q3 17/18   YTD 18/19   YTD 17/18   • Net revenue increased by 30.4% in Q3 to DKK 148.9 million. Both Business
                                                                                          Communications (+31.6%) and Design Services (+27.9%) achieved revenue
                                                                                          growth. Growth driven by execution of strategy with the two major framework
Revenue                                      148.9      114.2      403.2       321.8      agreements announced during 2017/18 (in Business Communications) and
                                                                                          increased recurring revenues from product sales (in Design Services)
Cost of sale                                 -64.9      -50.9     -174.2      -136.8      contributing significantly to the growth. 9M growth was 25.3% compared to last
                                                                                          year (Business Communications +27.8% and Design Services +20.4%).
Gross profit                                  83.9       63.3      229.0       185.1
                                                                                        • The revenue growth in Q3 and 9M was positively affected by the USD exchange
Gross margin. %                              56.4%      55.4%       56.8%       57.5%
                                                                                          rate with FX corrected revenue growth of 23.3% and of 19.2%. Conversely, the
                                                                                          implementation of IFRS15 had a negative impact on Q3 revenues compared to
Other external cost                          -14.4      -13.8       -46.2       -36.8     last year (positive impact for 9M compared to last year).
Staff cost                                   -45.0      -38.5     -133.7      -112.1
                                                                                        • The Gross Margin in 9M was 0.7%-point below last year due to changes in the
Value of own work transferred to assets        5.1        4.8       14.3        14.5      revenue mix.

EBITDA                                        29.7       15.7       63.3        50.6    • Capacity costs increased as planned with the strategy execution – both for
                                                                                          ramping-up capacity in order to execute the two major framework agreements
Depreciation and amortization                 -3.4       -2.2        -9.7        -5.4     announced during 2017/18 and for continuing to build the organization and
                                                                                          infrastructure necessary for further growth. The average number of FTEs
Operating Profit (EBIT)                       26.2       13.5       53.6        45.2      increased to 273 in 9M 2018/19 compared to 241 in 9M 2017/18.

                                                                                        • Operating performance in Q2 improved with EBITDA increasing by 89.2% and
                                                                                          EBIT increasing by 94.7%. In 9M, EBITDA increased by 25.2% and EBIT by 18.6%.

                                                                                                                           RTX Presentation Q3 18/19 - 30 Aug 2019   14
GROUP BALANCE SHEET
DKK million                    30 Jun          30 Jun       Change
                               18/19           17/18                   • Intangible assets increased due to the continued investments in own
                                                                         financed development projects
Assets

Total intangible assets                 52.3        39.8      +31.6%   • Other long term assets decreased, utilizing the deferred tax asset.

Total tangible assets                   14.6        14.7       -1.1%   • Inventories increase with increased activity and decreased due to IFRS15
                                                                         implementation.
Other long term assets                   7.9        23.2      -65.9%

Inventories                             21.1        20.2       +4.1%   • Receivables increased as a consequence of the higher revenue, the timing of
                                                                         sales and IFRS15 implementation.
Receivables                        156.0           103.7      +50.4%
                                                                       • Cash and cash equivalents increased to DKK 190 million due to the cash flow
Cash and cash equivalents          190.0           150.4      +26.3%
                                                                         generated from operations. Further, the shareholder-related initiatives
Total assets                       441.8           352.1      +25.5%     (dividends in Q2 and share buy-back programme in Q2 and Q3) affect the
                                                                         cash position.
Liabilities
                                   324.1           285.2      +13.7%   • Equity increased by DKK 38.9 million compared to last year driven by
Equity
                                                                         earnings generated, while impacted by the shareholder-related initiatives.
Long term liabilities                    4.3            0.3 +1561.6%
                                                                       • Short term liabilities increased as a result of higher activity level.
Short term liabilities             113.4            66.6      +70.2%

                                   441.8           352.1      +25.5%   • Very solid equity ratio of 73.4%, with dividends and share buy-back affecting
Total equity and liabilities
                                                                         equity ratio.
Equity ratio                     73.4%           81.0%                                                           RTX Presentation Q3 18/19 - 30 Aug 2019   15
G R O U P C A S H F LO W

                                                                                                                                            • Increasing cash flow from operations with earnings increase.
  DKK million                                                                                                      YTD 18/19   YTD 17/18

  Cash flow from operations (CFFO)                                                                                     62.4         56.3    • Cash flow from investments primarily impacted by acquisition of current
                                                                                                                                              securities in the trading portfolio, while the underlying investment level in
  Cash flow from investments(1)                                                                                       -50.6        -22.0
                                                                                                                                              tangible and intangible assets is similar to last year.
  Cash flow from financing activities                                                                                 -37.2        -36.2
                                                                                                                                            • Shareholder-related activities (dividends and share buy-back programme) for 9M
  Change in cash                                                                                                      -25.3          -1.9
                                                                                                                                              is on par with last year, thus cash flows from financing is a the same level as last
                                                                                                                                              year.
(1)   Including acquisition of current securities in the trading portfolio – with impact 9M 2018/19 of DKK -32.6
      million (9M 2017/18: DKK -1.2 million).
                                                                                                                                            • When disregarding acquisition of current securities in the trading portfolio, cash
                                                                                                                                              generation during 2018/19 has been slightly positive – i.e. most cash generated
                                                                                                                                              in 2018/19 has been distributed to shareholders via dividends and share buy-
                                                                                                                                              back.

                                                                                                                                                                                      RTX Presentation Q3 18/19 - 30 Aug 2019   16
AGENDA

1.   RTX BUSINESS MODEL                                          9:00 – 9:15

2.   FINANCIAL RESULTS Q3 AND 9M 2018/19                         9:15 – 9:30

3.   BUSINESS UPDATE Q3 2018/19                                  9:30 – 9:40

4.   OUTLOOK 2018/19                                             9:40 – 9:45

5.   Q&A SESSION                                                 9:45 – 10:00

                                           RTX Presentation Q3 18/19 - 30 Aug 2019   17
B U S I N E S S U P D AT E
•   Strong Q3 and 9M results and solid order book for Q4 – full year guidance upgraded on 19 Aug 2019.

•   Executing on growth strategy
     •    Growth from framework agreements announced during 2017/18
     •    Continued growth in recurring revenues from product sales within ProAudio.

•   New handset and base station range sold to existing large Enterprise customers – ensuring prolonged revenue streams.

•   Continue to build the organization and infrastructure necessary for further growth and targeting further growth avenues in both
    Enterprise and ProAudio.

                                                                                                                           RTX Presentation Q3 18/19 - 30 Aug 2019 18
                                                                                                                              RTX Presentation Q2 18/19 - 3 May 2019
G A M I N G P R O D U C T S W I T H R T X T E C H N O LO G Y
Currently in Market:

                                                                                                   K57/Attila Wireless Keyboard
                                         IRONCLAW RGB Wireless
 Hi-End PS4 Gaming controller with
 audio capabilities (confidential
 customer)                                                 HARPOON Wireless

Follow-on Products (several customers):
        Sept’19                      Oct’19                       Dec’19              1H2020                              2H2020
        Headset A                    Headset B                   Mouse A & B   Keyboard A & B & mouse C              Headset C & more

                                                                                                          RTX Presentation Q3 18/19 - 30 Aug 2019   19
ANNOUNCED SHARE BUY-BACK PROGRAMME CONTINUES
                            • RTX will buy back shares for an amount up to DKK
                              20 million from 1 August 2019 to 31 December
                              2019.

                            • As of 22 August, RTX has bought back shares for an
                              amount of DKK 2.4 million under the programme
                              (cf. company announcement 38/2019), which
                              continues as announced.

                                                             RTX Presentation Q3 18/19 - 30 Aug 2019   20
AGENDA

1.   RTX BUSINESS MODEL                                          9:00 – 9:15

2.   FINANCIAL RESULTS Q3 AND 9M 2018/19                         9:15 – 9:30

3.   BUSINESS UPDATE Q3 2018/19                                  9:30 – 9:40

4.   OUTLOOK 2018/19                                             9:40 – 9:45

5.   Q&A SESSION                                                 9:45 – 10:00

                                           RTX Presentation Q3 18/19 - 30 Aug 2019   21
O U T LO O K 2 0 1 8 / 1 9 U P G R A D E D O N 1 9 A U G – A N D C O N F I R M E D
    DKK million                              Result 2015/16      Result 2016/17   Result 2017/18    Original Outlook            Updated Outlook
                                                                                                            2018/19             2018/19 (19 Aug)

    Net Revenue                                     395.6               433.5            475.3           520-550                         550-565

    EBITDA                                           70.0                77.2             83.1            85-100                           90-100

    EBIT                                             65.8                72.3             74.9              65-80                            77-87

•     As described in our annual report in the section concerning risk management, RTX is relatively highly exposed to foreign currencies,
      as a considerable part of the revenue is settled in US dollars.

•     With the above major risk element in mind Executive Management expects a revenue in the range of DKK 550-565 million, EBITDA in
      the range of DKK 90-100 million and EBIT in the range of DKK 77-87 million for the financial year 2018/19.

                                                                                                                RTX Presentation Q3 18/19 - 30 Aug 2019   22
AGENDA

1.   RTX BUSINESS MODEL                                          9:00 – 9:15

2.   FINANCIAL RESULTS Q3 AND 9M 2018/19                         9:15 – 9:30

3.   BUSINESS UPDATE Q3 2018/19                                  9:30 – 9:40

4.   OUTLOOK 2018/19                                             9:40 – 9:45

5.   Q&A SESSION                                                 9:45 – 10:00

                                           RTX Presentation Q3 18/19 - 30 Aug 2019   23
Q&A SESSION

       RTX Presentation Q3 18/19 - 30 Aug 2019 24
T H A N K YO U F O R YO U R AT T E N T I O N
Further information please contact
CEO Peter Røpke at 91230000

                                               RTX Presentation Q3 18/19 - 30 Aug 2019   25
You can also read