Preparation Methods of Polypropylene/Nano-Silica/ Styrene-Ethylene-Butylene-Styrene Composite and Its Effect on Electrical Properties - MDPI
←
→
Page content transcription
If your browser does not render page correctly, please read the page content below
polymers
Article
Preparation Methods of Polypropylene/Nano-Silica/
Styrene-Ethylene-Butylene-Styrene Composite and
Its Effect on Electrical Properties
Mingze Gao 1 , Jiaming Yang 1, *, Hong Zhao 1, *, Hui He 1 , Ming Hu 2 and Shuhong Xie 2
 1   Key Laboratory of Engineering Dielectric and its Application, Ministry of Education,
     Harbin University of Science and Technology, Harbin 150080, China;
     gaomingze00@163.com (M.G.); angleman666@163.com (H.H.)
 2   Zhongtian Technology Submarine Cable Co., Ltd., Nantong 226000, China;
     hum@chinaztt.com (M.H.); xiesh@chinaztt.com (S.X.)
 *   Correspondence: jmyang@hrbust.edu.cn (J.Y.); hongzhao@hrbust.edu.cn (H.Z.);
     Tel.: +86-451-8639-1655 (J.Y.); +86-451-8639-2397 (H.Z.)

 Received: 21 March 2019; Accepted: 29 April 2019; Published: 4 May 2019

 Abstract: Compared with traditional insulation materials, such as cross-linked polyethylene (XLPE),
 polypropylene (PP) is famous for its better recyclable and thermal properties, as well as its good
 electrical performance. However, the problem of poor impact strength has restricted the application of
 pure PP in high-voltage, direct current (HVDC) cables. In this paper, styrene-ethylene-butylene-styrene
 block copolymer (SEBS) was used as a toughening filler, and nano-SiO2 was expected to improve
 the electric properties of the nano-composite. By controlling the masterbatch system, the dispersion
 characteristics of nano-SiO2 in the ternary composite system were changed. When PP/SiO2 was used
 as the masterbatch and then blended with SEBS, nano-SiO2 tended to disperse in the PP phase, and the
 number of nano-particles in the SEBS phase was lower. When PP/SEBS was used as the masterbatch,
 nano-SiO2 was distributed in both the PP phase and the SEBS phase. When SEBS/SiO2 was used
 as the masterbatch, nano-SiO2 tended to be dispersed in the SEBS phase. The different dispersion
 characteristics of nano-SiO2 changed the crystallization and mechanical properties of the ternary
 composite system and produced different electrical performance improvement effects. The results of
 our experiment revealed that the space charge suppression capability was positively correlated with
 the direct current (DC) breakdown strength improvement effect. Compared with the DC performance
 of 500 kV commercial XLPE materials, the self-made PP-based ternary composite system has better
 space charge suppression effects and higher DC breakdown strength. When nano-SiO2 was more
 dispersed in the PP phase, the space charge improvement effect was best. When the nano-SiO2
 particles were more dispersed in the SEBS phase, the expected electrical property improvement was
 not obtained. Scanning electron microscopy showed that the nano-SiO2 particles in the SEBS phase
 were more dispersed at the interface than in the SEBS matrix, indicating that the nano-particles were
 poorly dispersed, which may be a reason why the electrical properties of the composite system were
 not significantly improved.

 Keywords: polypropylene; nano-SiO2 ; SEBS; space charge; DC breakdown

1. Introduction
     In recent years, with the introduction of concepts such as the super grid and the global energy
interconnection, the demand for high-voltage power cables has increased. Intercontinental power
interconnection over long distances across the sea needs to be achieved with high-voltage DC (direct
current) cables [1]. The application of cross-linked polyethylene (XLPE) to high-voltage DC cables,

Polymers 2019, 11, 797; doi:10.3390/polym11050797                               www.mdpi.com/journal/polymers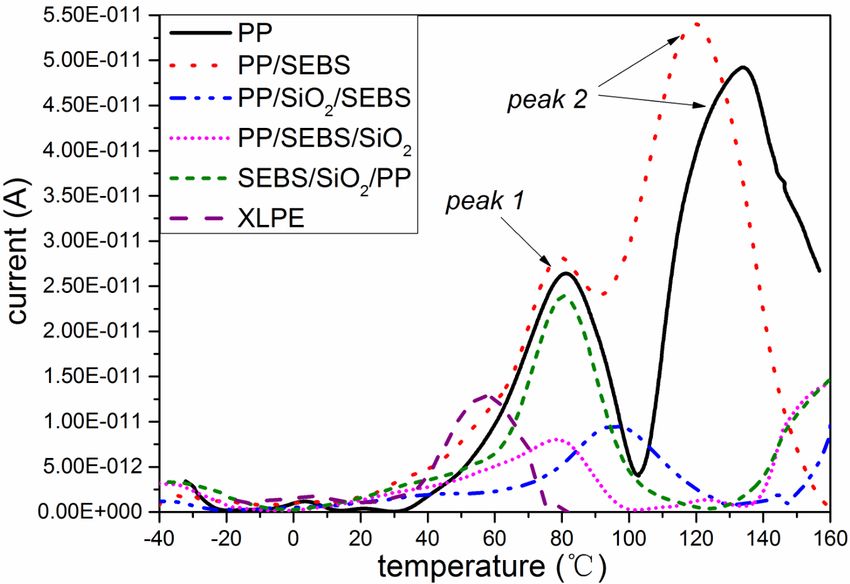
Polymers 2019, 11, 797                                                                             2 of 14

however, needs to solve the problem of space charge accumulation [2]. Based on chemically pure
technology, some manufacturers have effectively suppressed the space charge by reducing the content
of chemical impurities in XLPE and have successfully developed ±500 kV high-voltage, direct current
(HVDC) cable XLPE insulation material [3]. Japanese researchers filled XLPE with nano-particles,
which also obtained significant space charge suppression effects, and successfully developed a ±500 kV
high-voltage DC cable [4]. Although XLPE insulation has been successfully applied to HVDC cables, it is
a thermoset material that cannot be recycled. This is problematic, because the decommissioned materials
are extremely difficult to recycle and put tremendous pressure on the environment. In order to find
high-performance, recyclable, environmentally friendly polymer insulation materials, thermoplastic
polymer materials have received increasing attention in recent years [5].
     Polypropylene (PP) material has a high melting temperature and excellent electrical and mechanical
properties [6] and has been widely used in power capacitors and other fields. It can also be used as an
environmentally friendly cable insulation material to replace XLPE materials [7]. However, its poor
low-temperature impact strength makes it impossible to directly apply to cable manufacturing [8,9].
The poor low-temperature impact strength of PP can be significantly improved by filling with
thermoplastic elastomer, but the addition of the elastomer increases the space charge and significantly
reduces the breakdown strength of PP [10,11]. In order to solve this problem, the electrical properties
of PP/elastomer composites can be improved by filling with nano-additives. Zha reported that adding
nano-ZnO to PP/styrene-ethylene-butylene-styrene block copolymer (SEBS) can significantly reduce
the space charge and increase the DC breakdown strength of the materials [12]. Chi added nano-SiO2
to PP/polyolefin elastomer, which also reduces the space charge of the composite [13]. However, the
above studies paid less attention to the dispersion state of the nano-particles in the composite. From
scanning electron microscope images provided by Zha and Chi, the elastomer phase and the PP phase
cannot be clearly distinguished, and the dispersion information of the nano-particles in different phases
cannot be obtained. In a ternary composite system composed of nano-particles, the elastomer phase,
and the PP phase, when the nano-particles are more dispersed in the PP phase or more dispersed in
the SEBS phase, different electrical property improvement effects are produced.
     In this paper, three different kinds of masterbatch were prepared by selecting a combination of two
materials from among nano-SiO2 particles, PP, and SEBS and then blending them with the remaining
materials to prepare ternary composites. By changing the masterbatch system, the nano-particles
form three different distribution states, which are more dispersed in the PP phase, more dispersed
in the SEBS phase, and evenly distributed in the two phases. By studying the prepared materials,
the influence of the distribution of the nano-particles on the crystallization, mechanics, and electrical
properties of the ternary composites was further analyzed. Compared with the DC dielectric properties
of 500 kV commercial XLPE insulation materials, the DC insulation performance of the self-made
PP-based ternary composite system was evaluated.

2. Materials and Methods

2.1. Materials
     The matrix of isotactic PP (iPP, Sinopec, Beijing, China) purchased by Sinopec. SEBS (G1652EU)
was supplied by Kraton Corporation (Belpre, OH, America). Nano-SiO2 (AEROSIL R812S) with
an average diameter of 20 nm was obtained from Evonik Industries AG (Frankfurt, Germany).
Nano-SiO2 was surface treated with hexamethyldisilazane; compared with other surface modifiers,
such as 3-aminopropyltriethoxysilane, it can coat the surface of nano-particles with a dense alkane
molecular structure, which significantly reduces the polarity and improves the dispersion of nano-SiO2 .
The comparative material, XLPE, was a commercial ±500 kV high-voltage DC cable material.
The antioxidant (Irganox 1010, Dongguan shanyi plastic co. LTD, Dongguan, China) was blended into all
the samples at the beginning of the melting process to avoid degradation. PP, SEBS, and nano-SiO2 were
dried in a vacuum oven at 80 ◦ C for 24 h before preparation. The weight ratio of PP/SEBS/nano-SiO2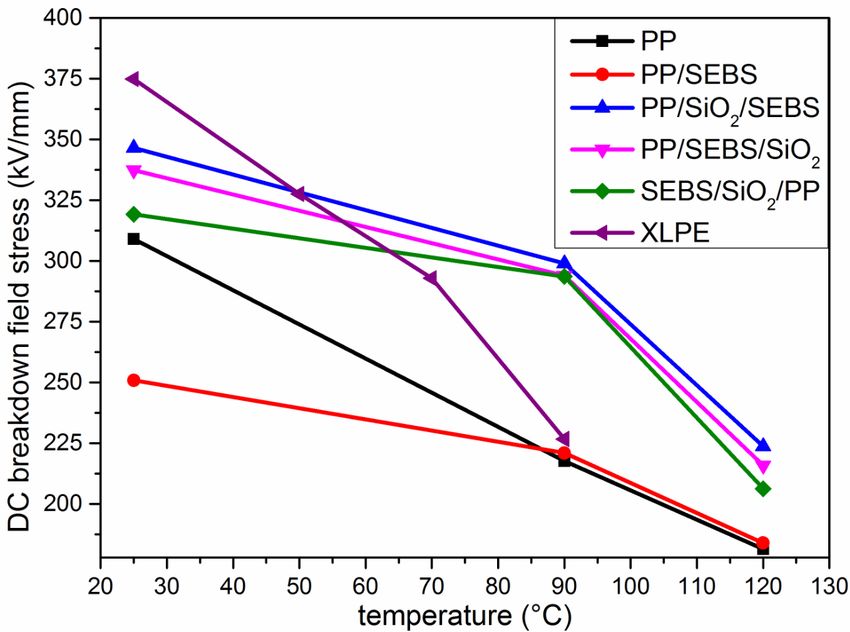
Polymers 2019, 11, 797                                                                               3 of 14

was 75:25:1. All the samples melted at 190 ◦ C and 60 rpm by using an internal mixer, and PP, SEBS, and
nano-SiO2 were melted respectively for 3, 3, and 15 min. The preparation process was as follows. First,
PP and SEBS were separately melt-blended into the internal mixer to prepare masterbatch 1, which we
called PP/SEBS, masterbatch 2 was prepared by blending PP with nano-SiO2 , and masterbatch 3 was
blended by using SEBS and nano-SiO2 . Second, the nano-composites of the PP, SEBS, and nano-SiO2
ternary systems were prepared by using three masterbatches, respectively. Nano-SiO2 was blended into
masterbatch 1, SEBS was added into masterbatch 2, and PP was melted into masterbatch 3, according to
different blending orders. We referred to these three nano-composites as PP/SEBS/SiO2 , PP/SiO2 /SEBS,
SEBS/SiO2 /PP, respectively, and the blending order and abbreviations of the composites are shown in
Table 1. PP samples were pressed to the required thickness with compression molding at 190 ◦ C, and
XLPE samples were placed in a mold and heated, first to 110 ◦ C at 2 × 10⁶ Pa pressure to melt and then
to 175 ◦ C at 15 × 106 Pa to crosslink the polymer.

                           Table 1. Abbreviation and component of the samples.

          Sample           PP (phr)         SEBS (phr)      Nano-SiO2 (phr)         Blending Order
            PP                100               0                   0                      -
         PP/SEBS              75                25                  1               masterbatch 1
       PP/SiO2 /SEBS          75                25                  1            masterbatch 2 + SEBS
       PP/SEBS/SiO2           75                25                  1            masterbatch 1 + SiO2
       SEBS/SiO2 /PP          75                25                  1             masterbatch 3 + PP

2.2. Sample Preparation for Scanning Electron Microscope (SEM) Observations
     All the samples were pressed to 1 mm thickness and fractured by liquid nitrogen at low temperature.
The fractured surfaces of the samples were then immersed for 7 h in the solution recommended by M.
Aboulfaraj for the observation of spherulitic structures in PP [14]. The formula is 1.3 wt % potassium
permanganate, 32.9 wt % concentrated H3 PO4 , and 65.8 wt % concentrated H2 SO4 . This permanganic
acid preferentially etches the amorphous part of the polymer in the spherulites, in such a way that the
lamellae then appear clearly. This method proved particularly useful in the case of PP. Subsequently,
the specimens were carefully washed with detergent, which was a mixture of concentrated sulfuric
acid water and hydrogen peroxide with a volume ratio of 2:7:1 [15]. Then, all the fractured surfaces of
the samples were sputtered with a very thin layer of gold in order to eliminate any undesirable charge
effects during the SEM observations. Field emission scanning electron microscopy (Hitachi SU8020,
Tokyo, Japan) was used to observe the microscopic morphology of the samples.

2.3. Thermal Properties
      Crystallization and melting curves were measured by differential scanning calorimetry (DSC,
DSC822e, Mettler-Toledo International, Inc., Switzerland). A specimen weighing approximately 5 mg
was heated to 200 ◦ C at a rate of 20 ◦ C/min and kept at that temperature for 2 min to eliminate thermal
history. Then, it was cooled to 30 ◦ C at the rate of 10 ◦ C/min and kept at that temperature for 2 min
to obtain its crystallization curve. Finally, the specimens were heated to 200 ◦ C again at a rate of
10 ◦ C/min to record their melting curves. The crystallinity (Xc /%) was calculated from the DSC result
by Equation (1).
                                                   ∆Hm
                                          Xc =               × 100%                                    (1)
                                                ( 1 − x ) H0
where ∆Hm (J/g) was the melting enthalpy; H0 was the theoretical melting enthalpy of the completely
crystallized form, and H0 was 209 J/g for the isotactic PP [16]. x was the mass fraction of the inorganic.

2.4. The Dynamic Mechanical Properties
   The dynamic temperature relaxation spectrum was tested by the dynamic mechanical analysis
(DMA) method using DMAQ800 manufactured by TA instruments (New Castle, DE, USA). The selection
Polymers 2019, 11, 797 4 of 14
mode was the tensile mode, in which the target amplitude was 15 µm, the frequency was 1 Hz, the
static force was 0.375 N, and the dynamic force was 0.3 N. The sample was cuboid with a length, width,
and thickness of 15 mm, 6 mm, and 1 mm, respectively. The sample was first cooled to −80 ◦ C for
5 min, and then, the elastic modulus E’, the loss modulus E”, and the loss factor tan δ from −80 ◦ C to
160 ◦ C were measured at a linear heating rate of 3 ◦ C/min.
2.5. Thermally Stimulated Depolarization Current
The charge trap characteristic was tested using the thermally stimulated depolarization current
(TSDC) method. The prepared samples were electrically polarized by applying 40 kV/mm DC high
voltage for 1 h in a vacuum environment at 60 ◦ C. The liquid nitrogen was then used for rapid cooling
the samples to −80 ◦ C so that all kinds of charge carriers had been “frozen”, after which the DC high
voltage was removed and the samples were short-circuited for about 10 min. After that, the sample was
heated linearly under a constant heating rate of 3 ◦ C/min, and the short-circuit current was measured
using a 6517B electrometer (Keithley Instrument Inc., Cleveland, OH, USA).
2.6. DC Breakdown Test
A DC breakdown test was undertaken on the film samples. The PP samples were tested at room
temperature, 90 and 120 ◦ C, and the XLPE samples were tested at room temperature, 50, 70, and 90 ◦ C.
Samples with thickness of 100 µm were placed between two electrodes. The samples were immersed
in transformer oil to prevent surface flashover, and the voltage ramp was 2 kV/s.
2.7. Space Charge Measurement
The space charge distribution within the samples under DC electric field was measured using
the pulsed electro-acoustic (PEA) system at room temperature. The space charge measurement
was performed with a pulsed electro-acoustic (PEA) system produced by Shang Hai Xiangtie
electromechanical device Co., Ltd., Shanghai, China. All the samples were kept under a 40 kV/mm DC
electrical field for 1 h and then short-circuited for 1 h. Space charge profiles were recorded at various
times for analysis.
3. Results
3.1. Morphology
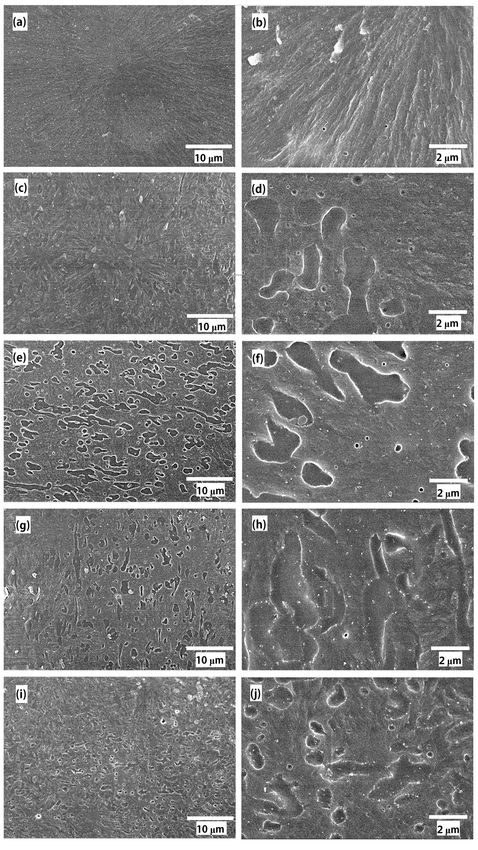
The SEM images of all the samples are shown in Figure 1. It can be seen from the images that
the structure of the PP crystal was regular, and the spherulite diameter was about 100–120 µm.
Many scholars have also confirmed the morphological structure of PP crystals [17]. The high-field
electrical properties of PP, particularly the breakdown strength, are associated with the features of
spherulites [18].
Because SEBS material contains polystyrene block copolymer and the material is amorphous in
the aggregation state, PP and SEBS cannot be homogeneous blends [19]. In Figure 1c, the “voids” in the
PP/SEBS composites are the etched SEBS phase. The “sea-island” structure distribution with SEBS as
the “island” phase and PP as the “sea” phase were presented in the PP/SEBS composite [20]. The white
bright spots in Figure 1f,h,j are the nano-SiO2 particles. Due to the different preparation methods, in
Figure 1f,h,j, it was found that nano-SiO2 in the PP/SiO2 /SEBS sample was mostly dispersed in the PP
phase and a few in the interface between PP and SEBS. In PP/SEBS/SiO2 nano-composites, both the
PP phase and the SEBS phase had nano-SiO2 particles, while in the SEBS/SiO2/PP sample, nano-SiO2
was concentrated in the PP and SEBS interface, partly in the SEBS phase and a few in the PP phase.
The dispersion of nano-SiO2 in the PP phase was relatively uniform, but the distribution of nano-SiO2
in the SEBS phase was not uniform.
Polymers 2019, 11, 797                                                                                      5 of 14
    Polymers 2019, 11, x FOR PEER REVIEW                                                                        5 of 14

     Figure 1. SEM picture of (a) PP, (b) PP, (c) PP/SEBS, (d) PP/SEBS, (e) PP/SiO2 /SEBS, (f) PP/SiO2 /SEBS, (g)
         Figure 1. SEM picture of (a) PP, (b) PP, (c) PP/SEBS, (d) PP/SEBS, (e) PP/SiO2/SEBS, (f) PP/SiO2/SEBS,
     PP/SEBS/SiO2 , (h) PP/SEBS/SiO2 , (i) SEBS/SiO2 /PP and (j) SEBS/SiO2 /PP with different magnification.
         (g) PP/SEBS/SiO2, (h) PP/SEBS/SiO2, (i) SEBS/SiO2/PP and (j) SEBS/SiO2/PP with different
         magnification.
Polymers 2019, 11, x FOR PEER REVIEW 6 of 14
Polymers 2019, 11, 797 6 of 14
In the large field of view in Figure 1c,e,g,i, it was observed that there was a spherulite
morphology in the PP/SEBS composite, and the crystal structure was smaller and looser than in PP.
It wasInalso
the found thatof
large field SEBS
viewwas distributed
in Figure along
1c,e,g,i, theobserved
it was directionthat
of the lamella
there was agrowth.
spheruliteThemorphology
dispersion
state
in the of SEBS in
PP/SEBS PP/SiO2/SEBS
composite, and theand PP/SEBS/SiO
crystal structure was2 was similar,
smaller andwhile
looserSEBS
than ininPP.
SEBS/SiO 2/PP
It was also was
found
significantly smaller. This indicates that nano-SiO in the SEBS phase caused
that SEBS was distributed along the direction of the lamella growth. The dispersion state of SEBS in
2 SEBS to form small
islands
PP/SiO2and/SEBSfacilitated the SEBS 2distribution
and PP/SEBS/SiO was similar,inwhilethe PP matrix.
SEBS 2 /PP was
One possible
in SEBS/SiO mechanism was that
significantly the
smaller.
surface of the that
This indicates nano-SiO 2 particles
nano-SiO 2 in themodified
SEBS by
phase hexamethyldisilazane
caused SEBS to form was
small coated
islands by
and dense alkane
facilitated the
molecules, which reduced the polarity of nano-SiO . It can be
SEBS distribution in the PP matrix. One possible mechanism was that the surface of
2 seen from the SEM that the dispersion
nano-SiO2
of nano-SiO
particles 2 in theby
modified non-polar PP phase was was
hexamethyldisilazane better than that
coated in thealkane
by dense weak polar SEBS which
molecules, phase,reduced
and a large
the
number of nano-SiO particles were distributed in the interface between
polarity of nano-SiO2 . It can be seen from the SEM that the dispersion of nano-SiO2 in the non-polar
2 SEBS and PP, which
improved
PP phase was the better
compatibility
than thatbetween
in the weakSEBS andSEBS
polar PP, showing
phase, and that the dispersion
a large of SEBS in
number of nano-SiO PP had
2 particles
been
were improved.
distributed in the interface between SEBS and PP, which improved the compatibility between
SEBS and PP, showing that the dispersion of SEBS in PP had been improved.
3.2. Thermal Properties
3.2. Thermal Properties
The DSC curves of all the samples are shown in Figure 2, and the crystallization temperature
The DSCtemperature
(Tc), melting curves of all(T
the
m),samples are shown(Xinc) Figure
and crystallinity 2, and the crystallization
are summarized in Table 2. temperature (Tc ),
melting temperature (Tm ), and crystallinity (Xc ) are summarized in Table 2.
(a) (b)
Figure 2.2. Heating
Heatingandand cooling
cooling curves
curves of differential
of differential scanning
scanning calorimetry
calorimetry (DSC)
(DSC) for foritsPP
PP and and its
composite.
composite. (a) crystallization
(a) crystallization process; (b)process;
melting (b) melting process.
process.
Table 2. Thermal parameters for the crystallization and melting processes.
Table 2. Thermal parameters for the crystallization and melting processes.
Sample T (◦ C)
c T (◦ C) X c (%)
Sample Tc (°C) Tmm (°C) Xc (%)
PPPP 116.2
116.2 165.8
165.8 46.22
46.22
PP/SEBS 113.2 164.2 46.23
PP/SEBS 113.2 164.2 46.23
PP/SiO2 /SEBS 113.5 165 44.69
PP/SiO 2/SEBS
PP/SEBS/SiO 113.5
113.8 165
164.6 44.69
44.56
2
SEBS/SiO2 /PP
PP/SEBS/SiO 2 113.8
114.4 164.6
164.3 44.56
43.68
SEBS/SiO2/PP 114.4 164.3 43.68
When SEBS was added into PP, the Tc and Tm of PP/SEBS were reduced compared with that of PP.
When SEBSwas
A similar result wasreported
added into PP, the Tc anda Tlow
by Jyotishkumar; m of PP/SEBS were reduced compared with that of
concentration of SEBS resulted in little change in
PP.
the Tc and a higher Tm of the polymer, but when the aamount
A similar result was reported by Jyotishkumar; low concentration of SEBS
of SEBS increased to resulted
20%, thein Tclittle
and
change in the T c and a higher Tm of the polymer, but when the amount of SEBS increased to 20%, the
Tm of composite were decreased [21]. When SEBS was less filled, SEBS acted more as a nucleating
T c and Tm of composite were decreased [21]. When SEBS was less filled, SEBS acted more as a
agent to promote the crystallization, but when the concentration of SEBS increased to a larger extent,
nucleating
more SEBS agent to promote
entangled with thethemolecular
crystallization,
chain ofbutPP,when the concentration
suppressing of SEBS increased
the crystallization process oftoPP a
larger extent, more SEBS entangled with the molecular chain of PP, suppressing the
and causing the decrease of the Tc . As shown in Figure 1, SEBS made PP spherulites smaller, and the crystallization
process
structureofbecame
PP andlooser.
causing thephenomenon
This decrease of the Tc. Asthe
allowed shown in Figure
PP crystal 1, SEBS
to melt madetemperature,
at a lower PP spherulites so
smaller, and the structure became
the Tm peak of PP/SEBS was lowered. looser. This phenomenon allowed the PP crystal to melt at a lower
temperature,
As shown sointhe Tm peak
Table 2, theofdifferences
PP/SEBS was in thelowered.
Tc and Tm between the nano-composites and PP/SEBS
were very small. Many studies indicated thatTnano-particles
As shown in Table 2, the differences in the c and Tm between the nano-composites and PP/SEBS
cause heterogeneous nucleation and
were very small. Many studies indicated that nano-particles
promote the formation of crystals [22,23]. However, there was no cause heterogeneous
obvious change in the nucleation
Tc and Tm andof
promote the formation of crystals [22,23]. However, there was no obvious change
nano-composites in this paper. One possible reason was that the content of nano-SiO was only 1 phrin the T c and Tm of
2
Polymers 2019, 11, x FOR PEER REVIEW 7 of 14
nano-composites
Polymers 2019, 11, 797 in this paper. One possible reason was that the content of nano-SiO2 was only 71of
phr
14
(parts per hundreds of resin); thus, nano-SiO2 did not produce a significant change in the Tc and Tm
of the nano-composite.
(parts per hundreds of resin); thus, nano-SiO2 did not produce a significant change in the Tc and Tm of
the
3.3.nano-composite.
The Dynamic Mechanical Properties
TheDynamic
3.3. The dynamicMechanical
mechanical spectra of PP, PP/SEBS, and the three nano-composites are illustrated
Properties
in Figure 3. From the change in the storage modulus (E') of the different materials in Figure 3a, it can
The that
be seen dynamic
the E' mechanical spectra ofdecreased
of the composites PP, PP/SEBS, andSEBS
after the three
was nano-composites
added in the whole are illustrated
temperature in
Figure 3. From the change in the storage modulus (E’) of the different materials
spectrum, and E' of the PP/SiO2/SEBS nano-composite had a significantly lower E' in the temperature in Figure 3a, it can be
seen
rangethat −80E’
of the toof−20 the°C.composites
With thedecreased
increasingafter SEBS
of the was added in
temperature, thethe
E' whole temperature
of all the spectrum,
samples gradually
and E’ of the PP/SiO
decreased. It was reported 2 /SEBS nano-composite
that the glass transition temperature of PP was about 10 °C [24]; of
had a significantly lower E’ in the temperature range in−80
the
to −20 ◦ C. With the increasing of the temperature, the E’ of all the samples gradually decreased. It was
temperature spectrum of the loss factor (tan δ) in Figure 3b, the loss peak appeared at this
reported that the glass transition temperaturerangeof PP of
was ◦ C [24]; in the temperature spectrum
temperature. Therefore, in the temperature −80about
to −20 10°C, the molecular chains of PP in the
of the loss
crystal factor
region and (tan in Figure 3b,
theδ)amorphous the loss
region werepeak
in aappeared
frozen state, at this
andtemperature.
the E' of the Therefore,
compositesinwere the
temperature rangeby of −80 ◦
−20 phase.
mainly affected the toSEBS C, the molecular chains
In the PP/SiO of PP in the crystal region and the amorphous
2/SEBS nano-composite, nano-SiO2 was more
region
dispersed in the PP phase, which induced the formation ofwere
were in a frozen state, and the E’ of the composites mainly affected
smaller-scale by the
spherulites, soSEBS
muchphase.
SEBS
In the PP/SiO 2 /SEBS nano-composite, nano-SiO 2 was more dispersed in
dispersed in the interface of PP spherulite and the E' of PP/SiO2/SEBS nano-composites were more the PP phase, which induced
the formationreduced.
significantly of smaller-scale
As the spherulites,
temperaturesogradually
much SEBS dispersed
increased andinthe
the lamella
interfacegradually
of PP spherulite
melted,andthe
the E’ of PP/SiO /SEBS
increasing SEBS2 surrounded by spherulites began to decrease E’, and then, the E' of all thegradually
nano-composites were more significantly reduced. As the temperature samples
increased
were not muchand the lamellaatgradually
different melted, the increasing SEBS surrounded by spherulites began to
high temperatures.
decrease E’, and then, the E’ of all the samples were not much different at high temperatures.
(a) (b)
Figure 3.
Figure 3. The dynamic mechanical
mechanical analysis (DMA)
(DMA) pattern
pattern of
of PP
PP and
and its
itscomposites.
composites. (a)
(a) Storage
Storage
modulus (E’);
modulus (E’); (b)
(b) loss
loss factor
factor (tan
(tan δ).
δ).
From
From thethechange
changeininthe theloss
lossfactor
factorshown
shown inin
Figure
Figure 3b,3b,
it was determined
it was determinedthatthat
the the
lossloss
factor of the
factor of
composite
the composite system increased
system afterafter
increased filling withwith
filling SEBSSEBS
compared
comparedwithwith
PP. After the addition
PP. After of nano-SiO
the addition of nano- 2,
the
SiOloss
2, thefactor of the of
loss factor nano-composite
the nano-composite furtherfurther
increased. This was
increased. Thisdue
wastodue
the to
entanglement of SEBS
the entanglement of
and
SEBSnano-SiO 2 with2 with
and nano-SiO PP molecules,
PP molecules,and theandincrease in friction
the increase during
in friction mechanical
during mechanical relaxation
relaxationledled
to
an increase
to an increasein in
internal
internalfriction. AtAtthe
friction. thesame
sametime,
time,ititwas
wasfound
foundthat
thatthe
themechanical
mechanical relaxation
relaxation peak
peak
of
of the PP/SiO22/SEBS
the PP/SiO nano-composite near 120 ◦°C,
/SEBS nano-composite C, which
which corresponded
corresponded to thethe structural
structural relaxation
relaxation
generated
generated whenwhen thethe PPPP crystal
crystal region
region melts,
melts, was
was higher
higher than
than those
those of other material systems,
systems, because
because
the
the nano-SiO
nano-SiO2 was more dispersed in the PP phase. Therefore, the biggest biggest loss was
was produced
produced in in
PP/SiO /SEBS. The loss factor temperature spectra of the three nano-composites
PP/SiO22/SEBS. The loss factor temperature spectra of the three nano-composites were complicated were complicated and
involved
and involvedvarious mechanisms,
various mechanisms,such such
as theascrystal morphology
the crystal morphologychange and interface
change zone action;
and interface thus,
zone action;
the
thus,specific influence
the specific needs needs
influence furtherfurther
study.study.
3.4.
3.4. Space
Space Charge
Charge Distribution
Distribution
The
The space
space charge
charge distributions
distributions of
of all
all the
the samples
samples under
under aa polarization
polarization electric
electric field
field are
are illustrated
illustrated
in
in Figure 4. It can be seen from Figure 4a that a significant space charge distribution appeared in
Figure 4. It can be seen from Figure 4a that a significant space charge distribution appeared in the
the
XLPE after the electric field was applied. As the polarization time increased, the space charge migrated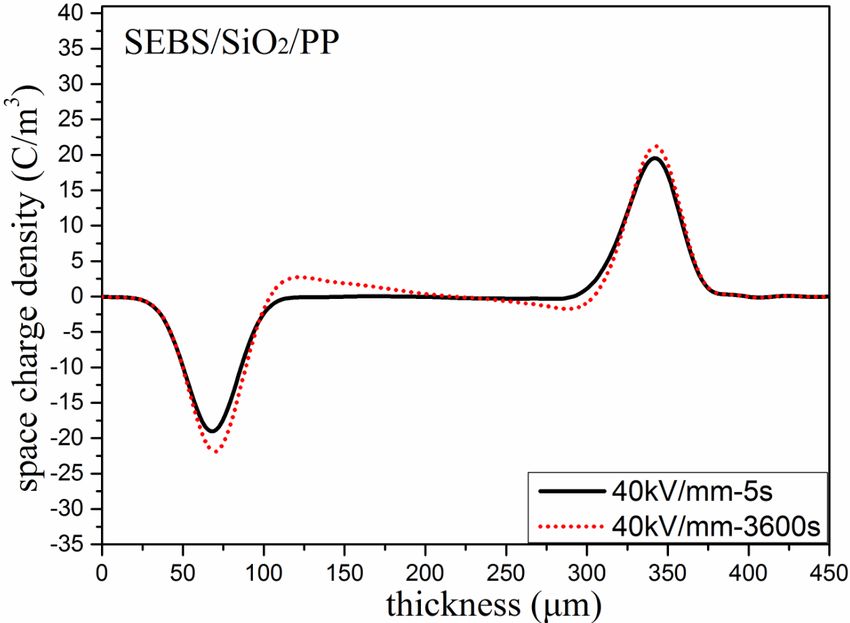
Polymers 2019, 11, 797 8 of 14
inside the
Polymers 2019,sample.
11, x FORDifferent from
PEER REVIEW XLPE, as shown in Figure 4b, when the polarization time was 8 of514
s,
there was no obvious space charge distribution in PP. When the polarization time reached 3600 s, a
3600
larges,amount
a large ofamount of heterocharge
heterocharge accumulation
accumulation appearedappeared
in the PPinsamples.
the PP samples.
With theWith the addition
addition of SEBS
of SEBS
into PP, ainto
largePP, a largeofamount
amount of heterogeneous
heterogeneous space
space charge wascharge was found
found near the twonear the twoThe
electrodes. electrodes.
amount
The amount
of charge of charge
increased theincreased
longer thethe longer the
increasing increasing
voltage voltage and
was applied, was more
applied, and more
charges moved charges
to the
moved
interiortointhe interiorWith
PP/SEBS. in PP/SEBS. With of
the addition thenano-SiO
addition2 ,ofthe
nano-SiO 2, the space
space charge charge wasand
was decreased, decreased,
a small
and a small
amount amount
of space of space
charge charge was accumulated
was accumulated in the three nano-composites
in the three nano-composites under 40 kV/mmunderfor
401kV/mm
h. This
for 1 h. This
indicated indicated
that that the
the nano-SiO nano-SiO
2 particles 2 particles
could could
suppress thesuppress
transfer ofthe transfer
space of space
charge in thecharge in the
material.
material.
(a) (b)
(c) (d)
(e) (f)
Figure 4. Space
Space charge
charge distribution
distribution under
under 40
40 kV/mm.
kV/mm. (a)
(a) XLPE;
XLPE; (b)
(b)PP;
PP;(c)
(c)PP/SEBS;
PP/SEBS; (d)
(d) PP/SiO /SEBS;
PP/SiO22/SEBS;
/PP.
(e) PP/SEBS/SiO22; and (f) SEBS/SiO22/PP.
The space
The space charge
charge distribution
distributionofofthe
thesamples
samplesunder
undershort
shortcircuit
circuitatat5 5s and
s and3600 s are
3600 presented
s are presented in
the Figure 5. In order to further study the influence of SEBS and nano-SiO
in the Figure 5. In order to further study the influence of SEBS and nano-SiO on the PP space charge,
2 2 on the PP space charge, we
calculated
we the space
calculated charge
the space density
charge of the
density ofsamples by integrating
the samples the short
by integrating circuitcircuit
the short data ofdata
5 s. of
The5 s.linear
The
average space charge density Q(t) of the samples was obtained by dividing the middle
linear average space charge density Q(t) of the samples was obtained by dividing the middle space space charge
amountamount
charge of eachofsample by the thickness
each sample of the specimen
by the thickness [25]. [25].
of the specimen
1 x2 Z
Q(t )Q=(t) = 1 ρ(x2xρ, t) dx (2)(2)
x2 − xx21 −xx1 1 x (x, t)dx
1
where x1 and x2 are the positive and negative electrode positions, respectively. ρ(x,t) is the space
where xprofile
charge 1 and xobtained
2 are the positive and negative
at the short of 5 s. positions, respectively. ρ(x,t) is the space charge
electrode
circuit data
profile
Theobtained
averageatspace
the short circuit
charge data of
densities 5 s. short circuit at 5 s and 3600 s are shown in Table 3. It
under
can be seen from the table that the average space charge density of XLPE was the highest under the
short circuit at 5 s compared with those of the other materials. The space charge density decreased
obviously after adding nano-SiO2 into PP/SEBS. After 3600 s, the space charge obviously decayed in
Polymers 2019, 11, x FOR PEER REVIEW                                                                          9 of 14

XLPE,
Polymersand
         2019,the  average space charge density in XLPE changed from the highest to the lowest, whereas
               11, 797                                                                            9 of 14
the space charge in PP and its composites showed no obvious change. This shows that the trap depth
of XLPE was shallower than that of PP.

                          (a)                                                         (b)

                          (c)                                                         (d)

                          (e)                                                          (f)
     Figure 5. Space
               Space charge
                     charge distribution
                             distribution under short circuit.
                                                      circuit. (a) XLPE; (b) PP; (c) PP/SEBS; (d) PP/SiO
                                                                                                  PP/SiO22/SEBS;
                                           /PP.
     (e) PP/SEBS/SiO22; and (f) SEBS/SiO22/PP.

      The average    space
                   Table     charge densities
                          3. Average           under
                                     Space charge    short
                                                  density   circuit
                                                          under shortatcircuit
                                                                        5 s andat 53600
                                                                                    s ands3600
                                                                                           are s.
                                                                                               shown in Table 3.
It can be seen from the table that the average space charge density of XLPE 3was the highest under the
                                         Average Space Charge Density (C/m )
short Time(s)
       circuit at 5 s compared with those of the other materials. The space charge density decreased
                    XLPE       PP     PP/SEBS PP/SiO2/SEBS PP/SEBS/SiO2 SEBS/SiO2/PP
obviously after adding nano-SiO2 into PP/SEBS. After 3600 s, the space charge obviously decayed in
           5         3.01     2.16     2.59            0.73                 0.83                  1.35
XLPE, and the average space charge density in XLPE changed from the highest to the lowest, whereas
         3600        1.34     1.52     2.43            0.72                 0.81                  1.34
the space charge in PP and its composites showed no obvious change. This shows that the trap depth
of XLPE was shallower than that of PP.
3.5. Thermally Stimulated Depolarization Current
                  Table 3. Average Space charge density under short circuit at 5 s and 3600 s.
     The TSDC curves of all the samples are shown in Figure 6. The TSDC spectrum of XLPE has only
one current release peak, and the peak position         was at
                                             Average Space     aboutDensity
                                                            Charge    55 °C.(C/m
                                                                              Ieda's
                                                                                  3 ) research showed that the
     Time (s)
carrier trap corresponding     to  this  temperature    was  mainly   due
                                                          PP/SiO2 /SEBS    to  some    structuralSEBS/SiO
                                                                                                  defects in   the
                   XLPE          PP         PP/SEBS                          PP/SEBS/SiO    2             2 /PP
polyethylene crystal region [26]. The depth of this trap was relatively shallow, and it resulted in the
        5           3.01        2.16          2.59             0.73                0.83              1.35
space 3600
       charge easily   migrating
                    1.34           into the sample
                                1.52          2.43    and decaying
                                                               0.72 at a faster rate,
                                                                                   0.81 as shown in1.34Figure 4a
and Figure 5a.
     As the TSDC
3.5. Thermally      curves Depolarization
               Stimulated   of PP and its composites
                                            Current show in Figure 6, the two peaks were corresponded
to the α relaxation process in PP [27]. The relaxation peak at low temperature, which was named peak
     The
1, was     TSDCderived
        mainly    curves of  all the
                          from   the samples
                                      movement  areofshown  in Figure
                                                       amorphous        6. The
                                                                    linked       TSDC spectrum
                                                                            molecular     chains andofloose
                                                                                                       XLPEcoils
                                                                                                               has
only  one current  release peak,  and   the peak  position  was  at about  55 ◦ C. Ieda’s research showed that
between lamellas, and part of the trap charge bound by this area was released. The molecular chain
the carrier trap corresponding to this temperature was mainly due to some structural defects in the
movement of the molecules in the crystalline region. Ions and electrons usually migrate between
molecular chains [13].
As shown in Figure 6, it can be seen from the curves that the current release peaks of PP were 26
and 49 Pa at 80 and 140 °C, respectively. After the addition of SEBS, peak 1 of PP/SEBS appeared at
78 °C, and the peak value of peak 1 increased. The peak position of peak 2 in the PP/SEBS composite
Polymers 2019, 11, 797 10 of 14
decreased to 120 °C, and the peak value increased to 54 Pa. In the TSDC measurement, the current
released at high temperature corresponded to a deeper energy level [29]. When SEBS was blended
into PP, as shown
polyethylene in region
crystal Figure [26].
1, SEBS
Thedestroyed the PP
depth of this crystal
trap structure and
was relatively introduced
shallow, a large number
and it resulted in the
of interface
space chargephases between SEBS
easily migrating into and PP. As SEM
the sample and DSC at
and decaying test
a results showed,
faster rate, compared
as shown with PP,
in Figures 4a
the T
and 5a.m of PP/SEBS decreased, and the regularity of crystallization worsened; therefore, the current
release peaks were likely to occur at low temperature.
Figure6.6.The
Figure Thethermally
thermallystimulated
stimulateddepolarization
depolarization current
current (TSDC)
(TSDC) pattern
pattern of
ofXLPE,
XLPE,PP,
PP,and
andthe
thePP
PP
composites.
composites.
AsWhen nano-SiO
the TSDC 2 was
curves of added
PP andinto the polymer,
its composites the TSDC
show value
in Figure of the
6, the twothree
peaks nano-composites
were corresponded was
toobviously reduced,process
the α relaxation which implied
in PP [27]. thatThe
there was a small
relaxation peakamount
at lowoftemperature,
charges accumulated
which was in the three
named
nano-composites
peak 1, was mainlysamples derivedcompared with PP. This
from the movement phenomenon
of amorphous was molecular
linked also illustrated
chains byand
the loose
space
charge
coils test results
between as shown
lamellas, and part in Figure
of the 5. Many
trap studies
charge boundhavebyproven
this area that nano-particles
was released. The can influence
molecular
the trap
chain density,inand
movement thethe deep trapregion
amorphous mechanismwas due may suppress
to the internalcarrier
strainmigration [30,31]. When
of the amorphous phasenano-
and
SiOspace
the 2 was hindrance
introduced,causeda lot ofby deep
thetraps around
presence of the interface
crystalline between nano-SiO
phase [27,28]. 2 and
The PP temperature
high were formed,
and the
peak, whichpositive and negative
was named peak 2, wascharges that would otherwise
the crystallization pre-melting move freely
peak, whichin PP were bound
originated from thein a
nearby nano-SiO
movement [31]. When
of the 2molecules in the crystalline
electric field was applied,
region. Ions andthe deep traps
electrons usuallynearmigrate
nano-SiO 2 could
between
prevent the
molecular transfer
chains [13].of charges and suppress the formation of charges accumulated in the samples
[31–33].
As shown in Figure 6, it can be seen from the curves that the current release peaks of PP were 26
and 49Comparing
Pa at 80 and the140
TSDC◦ C, respectively.
curves of the After three the
nano-composites,
addition of SEBS, the peak 1value of the TSDC
of PP/SEBS current
appeared at
78 ◦
in the SEBS/SiO
C, and the peak2/PP nano-composite
value near 80 °C
of peak 1 increased. Thewas significantly
peak position ofhigher
peak 2than
in thethose of thecomposite
PP/SEBS other two
decreased to 120 ◦ C,
nano-composites, indicating
and the peakthat there
valuewas more space
increased to 54charge
Pa. In accumulation between lamellas
the TSDC measurement, in the
the current
SEBS/SiO
released /PP nano-composite.
at2high temperature correspondedThe spacetocharge a deepertestenergy
resultslevel
also[29].
show thatSEBS
When therewas wasblended
more space
into
accumulated
PP, as shown ininFigure the SEBS/SiO 2/PP nano-composite.
1, SEBS destroyed the PP crystal From the results
structure of the SEM
and introduced images,
a large numberit was
of
determined
interface phasesthatbetween
nano-SiO 2 in SEBS/SiO
SEBS and PP. As 2/PPSEMwasandmoreDSC distributed
test resultsinshowed,
the SEBScompared
phase, whereas
with PP,nano-
the
TSiO
m of2 in the
PP/SEBS PP phase
decreased, was andlessthedistributed,
regularity ofwhich may be
crystallization the reason
worsened; for the
therefore,decrease
the in
currentthe space
release
charge
peaks suppression
were effect.atIt low
likely to occur alsotemperature.
can be seen from the TSDC graph that the current values of the three
nano-composites
When nano-SiO still hadadded
2 was an upward
into the trend at 160the
polymer, °C,TSDC
and value
it wasoflikely that nano-composites
the three a current peak would was
appear inreduced,
obviously higher which
temperature.
implied Because
that therethe wastemperature
a small amount wasofalready
charges higher
accumulated than inthethe
melting
three
temperature of PP,
nano-composites the current
samples comparedafterwith
this temperature was morewas
PP. This phenomenon likely
alsotoillustrated
come fromby thetherelease
space process
charge
of the
test trapped
results charge
as shown inof nano-SiO
Figure 2, suggesting
5. Many studies have that proven
nano-SiO 2 can
that form deepercan
nano-particles trap levels. the trap
influence
density, and the deep trap mechanism may suppress carrier migration [30,31]. When nano-SiO2 was
3.6. DC Breakdown
introduced, a lot ofStrength
deep traps around the interface between nano-SiO2 and PP were formed, and
the positive and negative charges that would otherwise move freely in PP were bound in a nearby
nano-SiO2 [31]. When the electric field was applied, the deep traps near nano-SiO2 could prevent the
transfer of charges and suppress the formation of charges accumulated in the samples [31–33].
Comparing the TSDC curves of the three nano-composites, the peak value of the TSDC current
in the SEBS/SiO2 /PP nano-composite near 80 ◦ C was significantly higher than those of the other
two nano-composites, indicating that there was more space charge accumulation between lamellas
in the SEBS/SiO2 /PP nano-composite. The space charge test results also show that there was more
space accumulated in the SEBS/SiO2 /PP nano-composite. From the results of the SEM images, it
was determined that nano-SiO2 in SEBS/SiO2 /PP was more distributed in the SEBS phase, whereasPolymers 2019, 11, 797 11 of 14
nano-SiO2 in the PP phase was less distributed, which may be the reason for the decrease in the
space charge suppression effect. It also can be seen from the TSDC graph that the current values of
the three nano-composites still had an upward trend at 160 ◦ C, and it was likely that a current peak
would appear in higher temperature. Because the temperature was already higher than the melting
temperature of PP, the current after this temperature was more likely to come from the release process
of the trapped charge of nano-SiO2 , suggesting that nano-SiO2 can form deeper trap levels.
3.6. DC Breakdown Strength
Polymers 2019, 11, x FOR PEER REVIEW 11 of 14
The electrical breakdown strength of XLPE, PP, and the PP composites was analyzed by Weibull
The electrical
statistics, and thebreakdown strength
data were shown in of XLPE,
Figure 7.PP,
Theand the PP
highest composites
long-term was analyzed
operating by Weibull
temperature of the
statistics,
HVDC XLPE and the data were
insulation only 70in◦ C;
wasshown Figure 7. Thethe
therefore, highest long-term
highest operating
test temperature fortemperature of◦the
XLPE was 90 C in
HVDC XLPE
this study. insulation was only 70 °C; therefore, the highest test temperature for XLPE was 90 °C
in this study.
99
99
room temperature
90 90 90°C
80 80
70
70
60 60
50 50
40 40
percent (%)
percent (%)
30 30
20 20
10 10
PP PP
5 PP/SEBS 5 PP/SEBS
PP/SiO2/SEBS PP/SiO2/SEBS
3 3
PP/SEBS/SiO2 PP/SEBS/SiO2
2 2
SEBS/SiO2/PP SEBS/SiO2/PP
XLPE XLPE
1 1
150 200 250 300 350 400 450 500 550 150 200 250 300 350 400 450 500
breakdown field (kV/mm) breakdown field (kV/mm)
(a) (b)
99
90 120℃
80
70
60
50
40
percent (%)
30
20
10
PP
5
PP/SEBS
3 PP/SiO2/SEBS
2 PP/SEBS/SiO2
SEBS/SiO2/PP
1
110 140 170 200 230 260 290 320
breakdown field (kV/mm)
(c) (d)
Figure 7. Weibull distribution of breakdown strength for PP and its composites. (a) Room temperature;
Figure 7. Weibull distribution of breakdown strength for PP and its composites. (a) Room temperature;
(b) 90 ◦ C; (c) 120 ◦ C; (d) breakdown strength of materials at different temperatures.
(b) 90 °C; (c) 120 °C; (d) breakdown strength of materials at different temperatures.
It can be seen from Figure 7 that XLPE had the highest breakdown field strength at room
It can be seen from Figure 7 that XLPE had the highest breakdown field strength at room
temperature, while the breakdown field strength decreased rapidly as the temperature increased.
temperature, while the breakdown field◦strength decreased rapidly as the temperature increased. The
The breakdown strength of XLPE at 70 C was about 290 kV/mm, and when the temperature increased
breakdown strength of XLPE at 70 °C was about 290 kV/mm, and when the temperature increased to
to 90 ◦ C, the breakdown strength of XPLE decreased to 230 kV/mm. For PP and its composites, it can
90 °C, the breakdown strength of XPLE decreased to 230 kV/mm. For PP and its composites, it can be
be seen from Figure 7d that the breakdown strength of PP/SEBS was significantly decreased compared
seen from Figure 7d that the breakdown strength of PP/SEBS was significantly decreased compared
with PP at room temperature. This is mainly because SEBS was a thermoplastic elastomer, and its
with PP at room temperature. This is mainly because SEBS was a thermoplastic elastomer, and its
breakdown strength was lower than that of PP. In addition, it can be seen from the DSC and SEM
breakdown strength was lower than that of PP. In addition, it can be seen from the DSC and SEM
results that SEBS also destroyed the crystal regularity of PP and also reduced the breakdown strength.
results that SEBS also destroyed the crystal regularity of PP and also reduced the breakdown strength.
As the temperature increased gradually, the breakdown strength of PP decreased significantly, while
As the temperature increased gradually, the breakdown strength of PP decreased significantly, while
the breakdown strength of PP/SEBS decreased less. The breakdown strength of PP and PP/SEBS were
the breakdown strength of PP/SEBS decreased less. The breakdown strength of PP and PP/SEBS were
quite close at 90 °C. The crystallization of the PP phase was gradually melted, resulting in a significant
decrease in the breakdown strength of the PP phase. In addition, an aromatic hydrocarbon structure
existed at the end of the SEBS macromolecular chain, which is likely to have a function as a voltage
stabilizer and to improve insulation properties. The breakdown strength of the three nano-
composites were obviously increased. Many scholars believe that when nano-particles are added intoPolymers 2019, 11, 797 12 of 14
quite close at 90 ◦ C. The crystallization of the PP phase was gradually melted, resulting in a significant
decrease in the breakdown strength of the PP phase. In addition, an aromatic hydrocarbon structure
existed at the end of the SEBS macromolecular chain, which is likely to have a function as a voltage
stabilizer and to improve insulation properties. The breakdown strength of the three nano-composites
were obviously increased. Many scholars believe that when nano-particles are added into a polymer,
a certain amount of deep traps appear in the interfaces, which can capture the space charge and
reduce the carrier mobility in the interior material, and this results the improvement of DC breakdown
strength [7]. It has been confirmed in the TSDC test above nano-SiO2 made the deep trap mechanism.
Nano-SiO2 increased the depth and density of the traps inside PP, which enhanced the chance that
the trap captured carriers. The breakdown field strength of PP/SiO2 /SEBS was larger than that of the
SEBS/SiO2 /PP nano-composite. A possible reason for this was that the dispersion of nano-SiO2 in the
SEBS phase was not uniform, and more nano-particles accumulated in the interface of SEBS and PP
as shown in Figure 1. Nano-particles need to be uniformly and sufficiently dispersed in the polymer
matrix material to produce significant electrical property improvement effects. When most of the
nano-SiO2 particles were dispersed at the interface between the SEBS and the PP phases, the amount of
nano-SiO2 particles in the PP phase and the SEBS phase was insufficient, and the electrical properties
of the PP and SEBS phases could not be effectively improved. On the other hand, the carriers could
obtain greater mobility and free paths in the SEBS phase, causing a decrease in electrical properties.
By comparing the breakdown strength of 500 kV XLPE materials and PP/SiO2 /SEBS nano-composites,
it was found that the breakdown strength of the self-made nano-composites at 90 ◦ C was higher than
that of 500 kV XLPE materials at 70 ◦ C. Thus, 70 ◦ C is the limitative operating temperature of 500 kV
XLPE, which implies that the self-made nano-composite has a higher operating temperature.
4. Conclusions
The dispersion characteristics of nano-particles in ternary composites composed by nano-particles,
SEBS, and PP can be effectively controlled by changing the masterbatch system. The effect of
nano-particle dispersion characteristics on the DC performance of ternary composites was more
obvious than that on the mechanical properties. For PP/SiO2 /SEBS, more nano-SiO2 was dispersed in
the PP phase, and the optimal space charge suppression effect and the highest DC breakdown strength
were obtained. The TSDC results confirmed that the traps in the composites were closely related to the
structural defects in the PP phase, and the deep traps introduced by these nano-particles can effectively
suppress the formation of space charge so that the electrical properties of PP/SiO2 /SEBS were better
than those of the other two composites. It was found that when the nano-SiO2 particles were more
dispersed in the SEBS phase, the expected electrical property improvement was not obtained. Scanning
electron microscopy showed that the nano-SiO2 particles in the SEBS phase were more dispersed at
the interface than in the SEBS matrix, indicating that nano-SiO2 was poorly dispersed, which may
be a reason why the electrical properties of the composite system were not significantly improved.
The horizontal comparison with the DC performance of 500 kV HVDC XLPE materials showed that
PP/SiO2 /SEBS nano-composites have better space charge suppression and higher DC breakdown
strength at 90 ◦ C, which means that such nano-composites have good potential for use as recyclable
HVDC insulation materials with engineering application value.
Author Contributions: Conceptualization, J.Y. and H.Z.; validation, J.Y., M.H., S.X., H.H. and H.Z.; formal
analysis, M.G. and J.Y.; investigation, M.H., S.X. and H.H.; resources, M.G. and H.H.; data curation, M.G., J.Y. and
H.Z.; writing—original draft preparation, M.G.; writing—review and editing, J.Y. and H.Z.; visualization, M.H.
and S.X.; supervision, J.Y. and H.Z.; project administration, H.Z.; funding acquisition, H.Z.
Funding: This research was funded by the National Natural Science Foundation of China, grant number 51337002
and the University Nursing Program for Young Scholars with Creative Talents in Heilongjiang Province, grant
number UNPYSCT-2016162.
Conflicts of Interest: The authors declare no conflict of interest.Polymers 2019, 11, 797 13 of 14
References
1. Montanari, G.C.; Seri, P.; Lei, X.; Ye, H.; Zhuang, Q.; Morshuis, P.; Stevens, G.; Vaughan, A. Next generation
polymeric high voltage direct current cables—A quantum leap needed? IEEE Electr. Insul. Mag. 2018, 34,
24–31. [CrossRef]
2. Hanley, T.L.; Burford, R.P.; Fleming, R.J.; Barber, K.W. A general review of polymeric insulation for use in
HVDC cables. IEEE Electr. Insul. Mag. 2003, 19, 13–24. [CrossRef]
3. Wang, S.; Chen, P.; Li, H. Improved DC performance of crosslinked polyethylene insulation depending on a
higher purity. IEEE Trans. Dielectr. Electr. Insul. 2017, 24, 1809–1817. [CrossRef]
4. Maekawa, Y.; Watanabe, K.; Maruyama, S. Research and Development of DC +/− 500 kV Eexteruded Cables.
CIGRÉ Session 2002, 2002, 21–203.
5. He, J.; Chen, G. Insulation materials for HVDC polymeric cables. IEEE Trans. Dielectr. Electr. Insul. 2017, 24,
1307. [CrossRef]
6. Huang, X.; Fan, Y.; Zhang, J. Polypropylene based thermoplastic polymers for potential recyclable HVDC
cable insulation applications. IEEE Trans. Dielectr. Electr. Insul. 2017, 24, 1446–1456. [CrossRef]
7. Du, B.X.; Xu, H.; Li, J. Effects of mechanical stretching on space charge behaviors of PP/POE blend for HVDC
cables. IEEE Trans. Dielectr. Electr. Insul. 2017, 24, 1438–1445. [CrossRef]
8. Gupta, A.K.; Purwar, S.N. Crystallization of PP in PP/SEBS blends and its correlation with tensile properties.
J. Appl. Polym. Sci. 1984, 29, 1595–1609. [CrossRef]
9. Green, C.D.; Vaughan, A.S.; Stevens, G.C.; Pye, A.; Sutton, S.J.; Geussens, T.; Fairhurst, M.J. Thermoplasticcable
insulation comprising a blend of isotactic polypropylene and a propylene-ethylene copolymer. IEEE Trans.
Dielectr. Electr. Insul. 2015, 22, 639–648. [CrossRef]
10. Guo, Q.; Li, X.; Li, W. The balanced insulating performance and mechanical property of PP by introducing
PP-g-PS graft copolymer and SEBS elastomer. Ind. Eng. Chem. Res. 2018, 57, 6696–6704. [CrossRef]
11. Zhou, Y.; He, J.; Hu, J. Evaluation of polypropylene/polyolefin elastomer blends for potential recyclable
HVDC cable insulation applications. IEEE Trans. Dielectr. Electr. Insul. 2015, 22, 673–681. [CrossRef]
12. Zha, J.W.; Wang, J.; Wang, S.J. Effect of Modified ZnO on Electrical Properties of PP/SEBS Nanocomposites
for HVDC Cables. Trans. Dielectr. Electr. Insul. 2018, 25, 2358–2365. [CrossRef]
13. Chi, X.H.; Cheng, L.; Liu, W.F. Characterization of Polypropylene Modified by Blending Elastomer and
Nano-Silica. Materials 2018, 11, 1321. [CrossRef]
14. Aboulfaraj, M.; Ulrich, B.; Dahoun, A. Spherulitic morphology of isotactic polypropylene investigated by
scanning electron microscopy. Polymer 1993, 34, 4817–4825. [CrossRef]
15. Norton, D.R. The spherulitic and lamellar morphology of melt-crystallized isotactic polypropylene. Polymer
1985, 26, 704–716. [CrossRef]
16. Van, D.W.A.; Mulder, J.J.; Gaymans, R.J. Fracture of polypropylene: The effect of crystallinity. Polymer 1998,
39, 5477–5481.
17. Holger, S.; Daniel, S.; Vancso, G.J. A nanoscopic view at the spherulitic morphology of isotactic polypropylene
by atomic force microscopy. Polym. Bull. 1993, 30, 567–574.
18. Diao, J.; Huang, X.; Jia, Q. Thermoplastic isotactic polypropylene/ethylene-octene polyolefin copolymer
nanocomposite for recyclable HVDC cable insulation. IEEE Trans. Dielectr. Electr. Insul. 2017, 24, 1416–1429.
[CrossRef]
19. Zheng, C.J.; Yang, J.M.; Zhao, H. AC performance, physical and mechanical properties of
polypropylene/polyolefin elastomers blends. In Proceedings of the 12th IEEE International Conference on
the Properties and Applications of Dielectric Materials, Xi’an, China, 20–24 May 2018; pp. 910–913.
20. Qazviniha, M.R.; Abdouss, M.; Musavi, M. Physical and mechanical properties of SEBS/polypropylene
nanocomposites reinforced by nano CaCO3 . Materialwissenschaft und Werkstofftechnik 2016, 47, 47–52. [CrossRef]
21. Parameswaranpillai, J.; Jose, S.; Siengchin, S. Phase morphology, mechanical, dynamic mechanical,
crystallization, and thermal degradation properties of PP and PP/PS blends modified with SEBS elastomer.
Int. J. Plast. Technol. 2017, 21, 79–95. [CrossRef]
22. Bikiaris, D.N.; Papageorgiou, G.Z.; Pavlidou, E. Preparation by melt mixing and characterization of isotactic
polypropylene/SiO2 nanocomposites containing untreated and surface-treated nanoparticles. J. Appl. Polym. Sci.
2006, 100, 13. [CrossRef]Polymers 2019, 11, 797 14 of 14
23. Qian, J.; He, P.; Nie, K. Nonisothermal crystallization of PP/nano-SiO2 composites. J. Appl. Polym. Sci. 2004,
91, 1013–1019. [CrossRef]
24. Grein, C.; Bernreitner, K.; Gahleitner, M. Potential and limits of dynamic mechanical analysis as a tool for
fracture resistance evaluation of isotactic polypropylenes and their polyolefin blends. J. Appl. Polym. Sci.
2004, 93, 1854–1867. [CrossRef]
25. Lan, L.; Wu, J.; Yin, Y. Effect of temperature on space charge trapping and conduction in cross-linked
polyethylene. IEEE Trans. Dielectr. Electr. Insul. 2014, 21, 1784–1791. [CrossRef]
26. Ieda, M. Electrical Conduction and Carrier Traps in Polymeric Materials. IEEE Trans. Dielectr. Electr. Insul.
1984, 19, 162–178. [CrossRef]
27. Mizutani, T.; Suzuoki, Y.; Ieda, M. Thermally stimulated currents in polyethylene and ethylene-vinyl-acetate
copolymers. J. Appl. Phys. 1977, 48, 2408–2413. [CrossRef]
28. Pillai, P.K.C.; Narula, G.K.; Tripathi, A.K.; Mendiratta, R.G. Thermally stimulated discharge current studies
in polarized polypropylene. Phys. Status Solidi A 1981, 67, 649–654. [CrossRef]
29. Iwamoto, M.; Wu, C.X. Thermally-Stimulated Current. Phys. Prop. Org. Monolayers 2001, 156–167.
30. Yin, Y. Thermally Stimulated Currents of SiO2 /Low-density Polyethylene Microand Nano-composites.
Trans. Electr. Electron. Eng. 2010, 5, 385–390. [CrossRef]
31. Rong, M.Z.; Zhang, M.Q.; Zheng, Y.X. Structure-property relationships of irradiation grafted nano-inorganic
particle filled polypropylene composites. Polymer 2001, 42, 167–183. [CrossRef]
32. Han, B.; Wang, X.; Sun, Z.; Yang, J.; Lei, Q. Space charge suppression induced by deep traps in
polyethylene/zeolite nanocomposite. Appl. Phys. Lett. 2013, 102, 012902. [CrossRef]
33. Tian, F.; Lei, Q.Q.; Wang, X.; Wang, Y. Effect of deep trapping states on space charge suppression in
polyethylene/ZnO nanocomposite. Appl. Phys. Lett. 2011, 99, 142903. [CrossRef]
© 2019 by the authors. Licensee MDPI, Basel, Switzerland. This article is an open access
article distributed under the terms and conditions of the Creative Commons Attribution
(CC BY) license (http://creativecommons.org/licenses/by/4.0/).You can also read