POTENTIAL IMPACTS OF CLIMATE CHANGE ON BC HYDRO'S WATER RESOURCES - Georg Jost: Ph.D., Senior Hydrologic Modeller, BC Hydro Frank Weber; M.Sc., P ...
←
→
Page content transcription
If your browser does not render page correctly, please read the page content below

POTENTIAL IMPACTS OF CLIMATE CHANGE
ON BC HYDRO’S WATER RESOURCES

Georg Jost: Ph.D., Senior Hydrologic Modeller, BC Hydro
Frank Weber; M.Sc., P. Geo., Lead, Runoff Forecasting, BC Hydro
                                                                  1
Executive Summary

                      Global climate change is upon us. Both natural cycles and anthropogenic
                      greenhouse gas emissions influence climate in British Columbia and the river
                      flows that supply the vast majority of power that BC Hydro generates. BC Hydro’s
                      climate action strategy addresses both the mitigation of climate change through
                      reducing our greenhouse gas emissions, and adaptation to climate change by
                      understanding the risks and magnitude of potential climatic changes to our
                      business today and in the future.

                      As part of its climate change adaptation strategy, BC Hydro has undertaken
                      internal studies and worked with some of the world’s leading scientists in
                      climatology, glaciology, and hydrology to determine how climate change affects
                      water supply and the seasonal timing of reservoir inflows, and what we can expect
                      in the future. While many questions remain unanswered, some trends are evident,
                      which we will explore in this document.

2   IMPACTS OF CLIMATE CHANGE ON BC HYDRO-MANAGED WATER RESOURCES
What we have seen so far

  »» Over the last century, all regions of British Columbia    »» Fall and winter inflows have shown an increase in
     became warmer by an average of about 1.2°C.                  almost all regions, and there is weaker evidence
  »» Annual precipitation in British Columbia increased by        for a modest decline in late-summer flows for those
     about 20 per cent over the last century (across Canada       basins driven primarily by melt of glacial ice and/or
     the increases ranged from 5 to 35 per cent).                 seasonal snowpack.
  »» For the period of inflow records (35 to 47 years,         »» The severity of year-to-year variation in annual
     depending on the reservoir), there is some evidence          reservoir inflow has not changed.
     of a modest historical increase in annual inflows
     into BC Hydro’s reservoirs but trends are small and
     statistically not significant.

Looking into the future

Projected changes in climate and hydrology are for the
2050s (unless stated otherwise) under different future
emission scenarios.

  »» Projected warming in the 21st century shows a             »» The Peace region will see an increased water supply.
     continuation of patterns similar to those observed           Inflows in late-fall and winter will increase; the
     in recent decades.                                           snowmelt will begin earlier; and summer flows
  »» All emission scenarios project increasing temperatures       will be lower.
     in all seasons in all regions of British Columbia.        »» The Campbell River area and likely most Coastal
  »» The amount of warming in the 21st century will very          watersheds will see negligible changes to annual
     likely be larger than that of the 20th century.              water supply.
  »» Precipitation in winter, spring, and fall will likely     »» On the South Coast (Vancouver Island and Lower
     increase in all of BC Hydro’s watersheds under all           Mainland watersheds), more of the precipitation will
     emission scenarios.                                          fall as rain and snow will become less important.
  »» BC Hydro will likely see a modest increase in annual         Fall and winter flows will increase; and spring and
     water supply for hydroelectric generation.                   summer flows will decrease.

  »» Most Upper Columbia watersheds will see an increase      Hydrological impact studies are the first step in
     in water supply. The snowmelt will start earlier,        BC Hydro’s climate change adaption strategy. In the
     spring and early-summer flows will be substantially      next step, BC Hydro will evaluate how the projected
     higher, and late-summer and early-fall flows will be     hydrological changes may impact hydroelectric power
     substantially lower.                                     generation.

                                                                                                                          3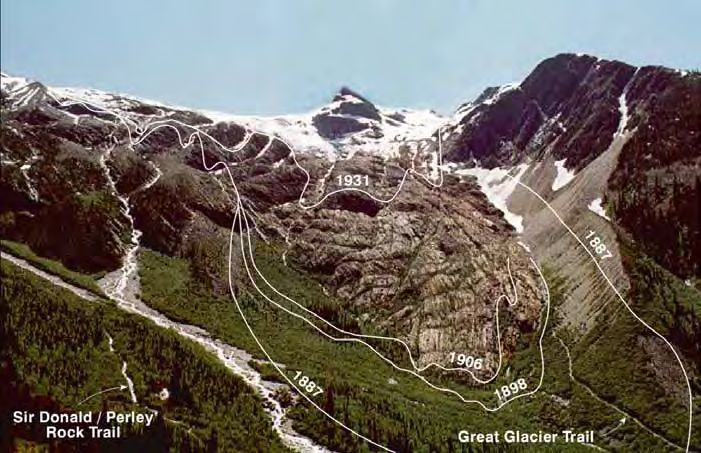
Introduction

                       More than 90 per cent of the electricity in British Columbia comes from falling
                       water. The amount of available water is directly affected by variations in climate.
                       Land use, volcanic activity, ocean circulation, solar cycles, and the composition
                       of the atmosphere all influence the global climate. An understanding of climate
                       change, and its effect on the water cycle, along with information related to future
                       economic activity and load growth, is critical to ensuring a reliable supply of
                       hydroelectric power for generations to come.

                       Climate change is natural in both the short and long term (Figure 1). Among the
                       most influential short-term events are ocean circulation patterns, such as the El
                       Niño Southern Oscillation (ENSO) and Pacific Decadal Oscillation (PDO), which
                       fluctuate on yearly and multiyear timescales as they exchange heat between the
                       oceans and the atmosphere. In the long term, changes in the Earth’s orbit around
                       the sun trigger ice ages every 100,000 years or so. Other cycles operate on the
                       scale of millions of years.

4   IMPACTS OF CLIMATE CHANGE ON BC HYDRO’S WATER RESOURCES
Figure 1: Northern Hemisphere warming based on a variety of reconstruction techniques
                                               (coloured lines) and instrumental record (black line). Source: IPCC 4AR: Climate Change 2007.
                                               http://www.ipcc.ch/publications_and_data/ar4/wg1/en/figure-6-10.html

The recent warming trend associated with rising
                                                                         Describing uncertainty
concentrations of greenhouse gases (GHG) that trap heat in
the atmosphere is, however, taking place at an unprecedented             Uncertainty in specific outcomes in
rate. The scientific evidence that this trend is at least partially
caused by the emissions produced by burning fossil fuels, and            the body of this report is assessed
is likely to continue for many decades, is compelling. In its
                                                                         using expert judgments and
2007 Fourth Assessment Report, the UN Intergovernmental
Panel on Climate Change (IPCC) concluded that “most of the               expressed with the following
observed increase in global average temperatures since the
mid-20th century is very likely due to the observed increase in          probabilities of occurrence:
anthropogenic GHG concentrations.”
                                                                         • very likely                   >90%
Since about A.D. 1860, temperature records from surface
weather stations show an increase of about 1°C over the
                                                                         • likely                        >66%
Northern Hemisphere. Although precipitation records are                  • more likely than not          >50%
less reliable, climatologists agree that precipitation over
North America has increased by about 10 per cent during                  • about as likely as not 33% to 66%
the 20th century. Understanding the impact of these
accelerated changes is crucial for planning adaptive
                                                                         • unlikely
Defining “climate change”
    This document uses the U.N. Intergovernmental Panel
    on Climate Change definition of climate change, which is
    “a change in the state of the climate that can be identified
    (e.g., using statistical tests) by changes in the mean and/or
    the variability of its properties, and that persists for an
    extended period, typically decades or longer. It refers to any
    change in climate over time, whether due to natural variability
    or as a result of human activity.”

    How climate affects water supply                                    BC Hydro’s climate action strategy

    Precipitation can fall as rain or snow. It can return to the        As part of the province’s target of cutting GHG emissions by
    atmosphere through evaporation, replenish groundwater               a third from 2007 levels by 2020, BC Hydro has prepared a
    aquifers, or run off into streams, rivers, and oceans.              climate action strategy with two key objectives:
    Higher temperatures increase evaporation, which in turn
                                                                           »» Maintain a low-carbon electricity supply for
    alters both precipitation and runoff. In humid regions,
                                                                              our customers; and
    more precipitation will likely result in more runoff. In drier
    regions, extra precipitation tends to evaporate, causing only          »» Leverage that supply to support provincial
    small changes in runoff. While the effects of a changing                  GHG reduction targets and policies for a
    climate may reduce water supply in some regions, it could                 low-carbon economy.
    also increase supply elsewhere.
                                                                        The strategy considers the potential effects of climate change
    Thanks to the size and geography of the province, BC Hydro          in B.C., including increases in temperature, new precipitation
    has a diverse portfolio of hydroelectric facilities in various      patterns, and a greater frequency of floods, droughts, and
    climate zones. This, and the large storage capacity in the          wildfires. Changes in the timing and volume of spring runoff
    Peace and Columbia River reservoirs, offers some flexibility to     have implications for hydroelectricity generation. BC Hydro
    adjust to changes in water supply and reservoir inflows. Still, a   will incorporate these potential impacts, and adapt its
    rapidly changing climate could challenge that ability to adapt.     infrastructure to accommodate the unavoidable.

6   IMPACTS OF CLIMATE CHANGE ON BC HYDRO’S WATER RESOURCES
BC Hydro collaborates with leading scientists
to assess impacts of climate change

As part of its climate change adaptation strategy, BC Hydro
has undertaken internal studies and worked with some of
the world’s leading scientists in climatology, glaciology, and
hydrology. BC Hydro teamed up with scientists from the
Pacific Climate Impacts Consortium (PCIC) at the University of
Victoria; the Western Canadian Cryospheric Network (WC2N),
which consists of six Western Canadian and two Washington
state universities; and the Climate Impacts Group (UW-CIG) at
the University of Washington.

Hydrologists at BC Hydro conducted studies to investigate
historic impacts of climate change on reservoir inflows.
PCIC assessed historical and future trends in climate across
British Columbia and projected future reservoir inflows in
three distinct regions critical to BC Hydro’s hydroelectric
capacity: the Upper Columbia region, the Peace region,
and the Campbell River region (Figure 2). The WC2N
study quantified the magnitude and timing of glacier melt
contributions to inflows into Kinbasket Reservoir (Mica basin)
under a changing climate. The UW-CIG study assessed
the hydrological impacts of climate change for the entire
                                                                 Figure 2: Regions with BC Hydro watersheds and representative
Columbia River basin in both Canada and the US (without          watersheds for each region (Columbia basin with Mica
accounting for effects of glaciers).                             highlighted=yellow, Campbell River at Strathcona=pink,
                                                                 Williston=brown, other BC Hydro basins=green).

                                                                                                                                 7
Assessing climate
    change impacts

    Climate change impact assessments are largely based
    on scenarios—stories about how the future could look.
    Scenarios do not attempt to predict the future, but aim
    to better understand the uncertainties involved in making
    decisions, to accommodate a wide range of possible
    outcomes. They also help researchers and managers
    anticipate the consequences of those decisions.

    The assessments that BC Hydro uses rely on numerical
    computer models that generate GHG emission scenarios,
    global climate models (GCMs) that resolve large-scale
    global weather patterns, statistical techniques that add
    regional detail to the GCMs, and hydrological models that
    convert climate scenarios into runoff scenarios (Figure 3).

8
Emission scenarios                                            Global climate models
Projections of GHG emissions are based on storylines          Global climate models represent physical processes in
of demographic, social, economic, technological, and          the atmosphere, in the oceans, and on land. They broadly
environmental developments. When the IPCC scenarios           reproduce historical climate at global scales, but are less
were developed in the late 1990s, all were considered         successful at regional and local scales. The resolutions
equally likely. However, the actual emissions growth rate     are such that any processes occurring on scales less than
since then is closer to or greater than the most fossil-      several hundred kilometres, such as the effects of mountain
fuel-intensive scenario.                                      ranges and coastlines on cloud formation, are only roughly
                                                              approximated. Statistical techniques bridge the gap
                                                              between global climate and regional impacts, but at the
                                                              price of higher levels of uncertainty.

 Emission Scenarios
 Global emissions and land use change based on
 future socio-economic development

                 Global Climate Models (GCMs)
                 Global climate responses to emission scenarios
                 (temperature, precipitation, etc.)

                                 Statistical Downscaling
                                 Regional climate responses (orographic and coastal
                                 effects, extremes, etc.)

                                                 Hydrological Model
                                                 Changes to the hydrological cycle (snow, glaciers,
                                                 evaporation, runoff, etc.)

                                                               Hydrological Impacts
                                                               Water supply to: reservoirs, hydropower generation,
                                                               operation of reservoirs, fish and their habitat, etc.

                                                              Figure 3: Method for quantifying hydrologic impacts
                                                              under projected future climates.

                                                                                                                            9
Observed trends in
   climate and hydrology

                      Historical trends in temperature and precipitation

                      Between 1900 and 2004, B.C. saw wetter conditions and an increase in the
                      average annual temperature of about 1.2°C. Most of the increase was a result
                      of higher minimum temperatures (Figure 4).

                      Annual precipitation increased by about 20 per cent (Figure 4). Most of the precipitation
                      increase occurred in fall, winter, and spring, with the highest increases in the northern
                      interior and no change in the southwest (Figure 5).

10 IMPACTS OF CLIMATE CHANGE ON BC HYDRO’S WATER RESOURCES
a b c
d a b
Figure 4: Annual mean temperature and c d
precipitation trends for the 1900-2004 period
(Rodenhuis et al. 2007)
Figure 5: Seasonal precipitation trends for the 1900 to 2004 period (Rodenhuis et al. 2007).
11Changes to the snowpack
Precipitation that falls as snow is temporarily stored in One-half to two-thirds of the reduction in peak SWE over the
seasonal snowpacks or glaciers. For many BC Hydro past 50 years is tied to natural ENSO and PDO cycles, with
watersheds, basin-wide snow storage is larger than the PDO shift from a cold to a warm phase in 1976 having
reservoir storage. A snowpack’s water content is reported the most significant effect. After removing the effects of this
in millimetres of snow water equivalent (SWE). SWE on natural climate variability, the province-wide SWE trends
April 1 is often used as a proxy for the maximum snow become very small, with a snowpack decline of just four
accumulation of a year, although the timing of peak per cent (Table 1). In some regions, adjusting for ENSO and
accumulation timing can vary at individual locations. PDO reverses the trend.
Records show a substantial reduction in peak winter snow An important limitation of SWE analysis is that most of
accumulation over the past 50 years. On average across the observing sites are at mid elevations. Models suggest
British Columbia, the peak SWE of 73 long term snow courses that the colder, highest elevations, which are less sensitive
dropped by about 18 per cent. The Columbia region showed a to warming, have seen an increase in peak SWE due to
20 per cent reduction, the Kootenay fell by 23 per cent, and the increases in precipitation.
South Coast and Vancouver Island dropped by 17 per cent. The
Middle Fraser region experienced a 47 per cent reduction,
while the Peace showed no notable changes and a few
northerly locations recorded increases in SWE.
On average across British Columbia, peak snow water
equivalent dropped by about 18 per cent since the 1950s.
One-half to two-thirds of this reduction in peak snow
accumulation is tied to natural climate variability.
12 IMPACTS OF CLIMATE CHANGE ON BC HYDRO’S WATER RESOURCESTable 1: Trends in April 1 Snow Water Equivalence at British Columbia long-term snow courses (1956-2005).
* Results are shown for unadjusted data and data with the effects of ENSO and PDO variability removed (Chapman, 2007).
Unadjusted data Adjusted data*
Basin / Region Mean [mm] Change [mm] Change (%) Change [mm] Change (%)
Peace 399 -8 -4 33 7
Columbia 646 -87 -20 7 -5
Kootenay 365 -91 -23 -21 -6
Middle Fraser 213 -82 -47 -31 -27
South Coast/ Vancouver Island 1202 -261 -17 -65 -4
British Columbia (overall) 474 -71 -18 0 -4
% Change Key: little or no change: -5% and 5% increase: > 5% decrease: < -5%
13Glacier change
A change in glacier cover provides visually compelling Glaciers cover approximately 25,000 km2 of British Columbia
evidence of the effects of climate change on the water cycle. which is just three per cent of the total surface area. At
Glaciers across the province lost about 11 per cent of their the scale of watersheds operated by BC Hydro, the impact
area between 1985 and 2005. Coastal glaciers lost less area of glacier melt on annual flow volumes is relatively minor.
than interior glaciers, but absolute volume loss was larger in However, even a glacier cover of five per cent, such as in
the Coast Mountains than in the Columbia region or the Rocky the Mica basin, can contribute significant flow in the late
Mountains. In the Columbia River basin, glacier cover declined summer. During the warm and dry summer of 1998, for
by about 16 per cent from 1986 to 2000. Glaciers thinned most example, glacier melt contributed 35 per cent to the Mica
at lower elevations. Figure 6 illustrates the retreat of the basin’s September streamflow. With a warming climate,
Illecillewaet Glacier at Roger’s Pass between 1887 and 2000. those contributions will very likely decrease as glaciers
retreat.
Figure 6: Extent of Illecillewaet Glacier at Roger’s Pass (Selkirk Mountains) in the Arrow watershed in 2000, with lines
indicating previous glacier extent. (Source: Dr. Dan McCarthy, Brock University & Mas Matsushita, Parks Canada.)
14 IMPACTS OF CLIMATE CHANGE ON BC HYDRO’S WATER RESOURCESObserved changes
in reservoir inflows
Researchers have reconstructed streamflows for the Peace
River at the Peace-Athabasca Delta using lake sediments,
while others have used patterns of tree rings to establish
long-term streamflow records for the Chilko River and its
glacier-fed watershed in the Coast Mountains. Findings of
these studies and of a similar study for the Columbia River
at The Dalles indicate that over the past ~250 years both
wetter and drier conditions than currently observed have
persisted for decades under natural climate variability.
There is no significant A detailed analysis of climate change signals in BC Hydro
evidence of a historical reservoir inflows found no significant trends of declining
annual total water supply between 1984 and 2007. Rather,
trend in annual water there is some evidence for a modest historical increase
in streamflow in some basins. There is, however, clear
supply in BC Hydro’s evidence for changes in the seasonality of flow. Fall
watersheds but there and winter flows have increased at most of BC Hydro’s
watersheds. There is weaker evidence for a decline in late-
is evidence of seasonal summer flows in snowmelt dominated watersheds. The
absence of detectable trends in annual water supply does
changes to inflows. not imply that there are none, however. Brief record length
and poor data quality mean a genuine but weak climate
change signal could be hidden by more dramatic year-to-
year fluctuations.
15Future projections
Climate patterns for the 21st century are derived from model simulations based
on different emission scenarios. Emissions are difficult to project because they
depend on economic growth, population increase, and technological and land-use
changes, all of which are impossible to anticipate accurately. The emissions
scenarios are designed to reflect the range of these uncertainties. Unless stated
otherwise, results for all future scenarios focus on projections for the 2050s.
Temperature and Precipitation Projections
In general, trends observed during the past century in British Columbia will
likely continue throughout the 21st century. By the 2050s, all parts of British
Columbia will very likely get warmer in all four seasons. The mean annual
temperature is projected to increase by 1.4 to 3.7ºC, which is greater than
the range of historical variability. In the southeast, warming will be greatest
in summer, while in the northeast, warming will be greatest in winter. In the
Campbell River watershed and other parts of south coastal B.C., the warming
will be more evenly distributed throughout the year.
16 IMPACTS OF CLIMATE CHANGE ON BC HYDRO’S WATER RESOURCESMuch of British Columbia will likely get modestly wetter (Figure 7) by 0 to
18 per cent. Contrary to temperature projections, however, the projected
increase in precipitation is within the range of historical variability. Precipitation
increases are projected to be greatest in fall, winter, and spring.
Precipitation increases are higher for the northern and northeastern parts of
the province, where they are also more evenly distributed across all seasons. In
summer, the southern portion of the province, and particularly the southwest,
will likely become drier.
Median Precipitation Change Projected for the 2050s
WINTER SPRING SUMMER FALL
(% Change)
−20 −10 0 10 20
Figure 7: Seasonal mean precipitation change in the 2050s (2041-2070)
relative to the 1961-1990 baseline period. (Source: Schnorbus et al. (2011)).
By 2050, the mean annual
temperature in British Columbia
is projected to increase by 1.4
to 3.7ºC, which is greater than
the range of historical variability.
17Hydrological projections for the Upper Columbia Region
Mica Dam drains 20,742 km2 of the Columbia River Glaciers
headwaters. Annual precipitation averages 1,075 millimetres
with 70 per cent falling as snow. The average annual Glaciers in the Columbia basin are shrinking and, even with
temperature is 1.9°C. In 1985, glaciers covered 1,268 km2, no further warming, would likely continue to retreat for
representing 6.1 per cent of the basin. Between 1985 and at least another decade. Future simulations project that
2005, the glacier area shrank by 181 km2, reducing glacier glacial coverage in the Mica basin will decrease by at least
cover to 5.2 per cent of the basin. 44 per cent and possibly as much as 100 per cent by 2100,
with an average decrease of 85 per cent. Figure 8 visualizes
the retreat of the Athabasca glacier in the 21st century.
Figure 8: Athabasca Glacier coverage observed in 2001 (upper left, LandSat satellite photo) and projected for 2050, 2080 and 2100.
GCM forced with the A1B emission scenario. Graphics: Glacier Modelling Group, Earth & Ocean Sciences, UBC.
18 IMPACTS OF CLIMATE CHANGE ON BC HYDRO’S WATER RESOURCESStreamflow projections
Streamflow projections for the
Mica basin are available from three
different studies (PCIC, WC2N, UW-
CIG). While streamflow projections
for the Mica basin come with high
levels of uncertainty, all three studies
agree that the mean annual flow will
increase (Figure 9). Each foresees
an earlier onset of spring melt and
lower flows in late summer and early
autumn (Figure 10), consistent with
other studies of streamflow in snow-
dominated catchments. The decrease
in icemelt contributions to August
streamflow exacerbates the low flows
in late summer produced by an earlier
snowmelt. The overlap between the
different emission scenarios (Figure Figure 9: Projected changes in mean annual flow summarized for
9b) shows that the primary source each study using (a) all studied emission scenarios and GCMs and
(b) for each individual emission scenario.
of uncertainty comes from modeling
climate and hydrology rather than
from GHG emission scenarios.
19Figure 10: (a) Observed and future 2050s monthly Mica inflow and (b) flow anomalies relative to
historical baseline for each study (bold lines) for all emission scenarios. Lines correspond to monthly
medians for individual GCM runs under A1B, A2, or B1 emission scenarios. Flow anomalies (b) are
plotted relative to the median of all historic runs for WC2N, PCIC and UW-CIG, respectively.
20 IMPACTS OF CLIMATE CHANGE ON BC HYDRO’S WATER RESOURCESHydrological projections for the Peace Region
The Williston basin in the northern
Interior forms the headwaters of the
Peace River. The region has a
continental climate with frequent
outbreaks of Arctic air. The mean
annual precipitation is 838 millimetres,
approximately 40 per cent in the form
of snow. The average annual
temperature is 0.2°C. A spring freshet
is the dominant runoff event. Most
precipitation falls as rain in the
summer months, and glacier melt is
negligible.
Streamflow projections
Climate change scenarios for the
Williston reservoir project an
increase in inflow ranging between
11 per cent and 15 per cent by the
2050s, with streamflow increasing
throughout most of the fall, winter
and spring seasons (Figure 11).
There is evidence for an earlier
freshet onset and a shift in the peak
flow from June to May. Summer
flows are projected to decline, with
the greatest decline in July.
Figure 11: (a) Observed and future 2050s monthly Williston basin (GMS)
inflow and (b) flow anomalies relative to historical baseline for each study
(bold lines). The historic baseline is the median of all historic runs. Future
streamflow is shown as the monthly median for each individual GCM/emis-
sion scenario combination. (Source: PCIC (Schnorbus et al. 2011)).
21Hydrological projections for Vancouver Island,
the Lower Mainland and the South Coast
Campbell River at Strathcona is
a small coastal watershed that
drains the central Vancouver Island
mountains to the Strait of Georgia
and impounds the Upper Campbell
Lake and Buttle Lake Reservoirs.
Annual precipitation in the study
area is 2,960 millimetres, with
78 per cent falling from October to
March. Inflows peak in the fall from
rainfall and in spring from snowmelt,
while glacier melt is negligible.
Streamflow projections
By 2050, the Campbell River at
Strathcona watershed is expected to
change from a hybrid to a rainfall-
dominated regime (Figure 12).
Snowfall will decrease, and flows
from October to April will increase,
with a substantially reduced spring
freshet. GCMs consistently predict
the highest flow increases in January
and the largest decreases in June. No
significant changes to annual inflow
volumes are projected.
Figure 12: (a) Observed and future 2050s monthly inflow into Campbell
River at Strathcona Dam and (b) flow anomalies relative to historical
baseline for each study (bold lines). The historic baseline is the median
of all historic runs. Future streamflow is shown as the monthly median
for each individual GCM/emission scenario combination. (Source: PCIC
(Schnorbus et al., 2011)).
22 IMPACTS OF CLIMATE CHANGE ON BC HYDRO’S WATER RESOURCESSummary of changes to
BC Hydro’s water supply
Annual changes
Climate change projections for several of BC Hydro’s (i.e., Whatshan, Kootenay Lake and Slocan) annual water
watersheds suggest a likely small increase in water availability supply is likely to slightly increase or remain unchanged.
caused by a modest increase in future precipitation. Model For the Williston basin, some GCMs see no change in
uncertainties outweigh the relatively minor differences in water availability, while others predict increases of up to
projections among various emission scenarios. 15 per cent. The median projection is an increase of about
11 per cent. No significant changes to annual flows are
There are regional differences in projections of future
projected for coastal watersheds.
water availability. For the Mica basin, increases in overall
water supply are likely, despite a decline in the glacier melt All models have difficulties in simulating evaporation and
contribution, because increases in future precipitation more the response of vegetation. However, potential and actual
than offset the losses from shrinking glaciers (Table 2). Some evaporation will likely increase due to higher temperatures,
models project an increase of only 10 per cent, others as partly offsetting higher precipitation input. A notable
much as 26 per cent. The Revelstoke and Arrow watersheds exception is one model projected a decrease in evaporation
can also expect modest increases in annual flows. For the for the Mica basin, which could further increase the annual
southern parts of the Columbia and Kootenay River basins water supply.
23Table 2: Seasonal and annual inflow anomalies for select BC Hydro watersheds for the 2050s relative to 1961-1990
average. Percentiles refer to the range in projections under different emission scenarios and GCMs. (Source: PCIC)
REGION Watershed Winter Spring Summer Fall Year
5 percentile 45% -10% -68% 8% -10%
South Coast Strathcona 50 percentile 52% 6% -64% 10% 1%
95 percentile 42% 13% -43% 12% 8%
5 percentile 14% 75% 5% -9% 10%
Mica 50 percentile 53% 77% 9% 2% 17%
95 percentile 104% 68% 11% 15% 24%
5 percentile 24% 84% -7% -20% 2%
Revelstoke 50 percentile 91% 79% -2% -1% 12%
95 percentile 132% 63% 4% 21% 23%
Columbia
5 percentile 60% 54% -14% -16% -1%
Arrow 50 percentile 111% 53% -7% -3% 9%
95 percentile 115% 57% 0% 18% 21%
5 percentile 34% 22% -57% -29% -14%
Whatshan 50 percentile 92% 38% -41% -6% 0%
95 percentile 134% 44% -24% 15% 15%
5 percentile 1% 66% 2% -13% 6%
Duncan 50 percentile 29% 75% 5% 1% 12%
95 percentile 104% 75% 9% 22% 22%
Kootenays
5 percentile 72% 37% -31% -27% -5%
Kootenay Lake 50 percentile 86% 38% -18% -4% 6%
95 percentile 101% 46% -12% 17% 16%
5 percentile 25% 46% -28% -5% -7%
Peace Williston 50 percentile 78% 61% -15% 5% 11%
95 percentile 64% 55% -7% 13% 19%
Key: little or no change: -5% and 5% increase: > 5% decrease: < -5%
A modest increase in future
annual water availability is
likely for BC Hydro’s integrated
hydroelectric system.
24 IMPACTS OF CLIMATE CHANGE ON BC HYDRO’S WATER RESOURCESSeasonal changes
Summer streamflow and hence water availability during that B.C. glaciers are already shrinking and studies suggest
summer will very likely decline across the province. that the glacier melt contribution to streamflow is already
Snowmelt will start earlier and flows will peak earlier. declining. In the Mica basin, approximately 60 per cent
This has already been observed over the past few decades. of glacier cover is projected to disappear by 2050 and
Snowmelt-dominated watersheds in southeastern B.C., for 85 per cent by 2100. Some scenarios show a complete loss
example Arrow and Kootenay Lakes, will experience higher of glaciers in the region by 2100.
flows during winter and lower flows during late summer,
The biggest changes to seasonal flow regimes can be
but will very likely remain snowmelt-dominated. The
expected for coastal watersheds. There, rainfall-runoff
Williston basin will remain a hybrid snowmelt- and rainfall-
processes will very likely become dominant over snowmelt.
dominated watershed.
Hybrid rainfall- and snowmelt-dominated watersheds will
Glaciers are projected to continue retreating under all turn into rainfall-dominated watersheds. With only marginal
future climate scenarios. Under a warming climate, the precipitation increases, the region will see a decline of
contribution of glacier melt to streamflow initially increases basin-wide snowpack and consequently a reduction in
but eventually declines as glaciers shrink. Evidence shows spring runoff.
Summer streamflow and hence
water availability during summer
will very likely decline while
streamflow during winter
months will very likely
increase across
the province.
25BC Hydro will evaluate how the
projected hydrological changes
will impact hydroelectric
power generation.
Next steps
Climate change impact studies give a reasonably good Water availability is but one of many climate-related factors
understanding of future trends in water availability, but affecting hydroelectric power generation. Just as important
have only been undertaken for some BC Hydro watersheds. are the effects of a changing climate on heating and cooling
BC Hydro has renewed its partnership with the Pacific demand, on infrastructure such as transmission and
Climate Impacts Consortium to expand the hydrologic distribution lines, impacts to fisheries and habitat, as well
impact studies to other BC Hydro watersheds. as changes in demographics, socio-economics, and
government policies and regulation. All these factors must
The next step for BC Hydro is to feed operational and be integrated to develop a useful and holistic vision of how
planning models with projected inflow scenarios to assess best to adapt to a changing climate. To this end, BC Hydro
how sensitive hydroelectric power generation is to climate continues to work with the Pacific Climate Impacts
change. For instance, it has not been determined how Consortium and others to expand our knowledge of climate
effectively reservoir storage will be able to buffer projected change science. An Adaptation Working Group at BC Hydro
changes in seasonal runoff timing, such as lower summer continues to assess and address the risks of climate
inflows. Changes in the year-to-year variability of water change, and to continue powering B.C. with clean, reliable
supply, and hence changes to the frequency and severity of electricity, for Generations.
hydroelectric droughts will also need further research.
26 IMPACTS OF CLIMATE CHANGE ON BC HYDRO’S WATER RESOURCESsources
Bolch, T., Menounos, B., Wheate, R., 2010. Landsat-based inventory Pederson, G.T. et al., 2011. The Unusual Nature of Recent Snowpack
of glaciers in western Canada, 1985-2005. Remote Sensing of Declines in the North American Cordillera. Science, 333(6040): 332.
Environment, 114(1): 127-137. Raupach, M.R. et al., 2007. Global and regional drivers of accelerating
Chapman, A., 2007. Trend in April 1 Snow Water Equivalent at Long- CO2 emissions. Proceedings of the National Academy of Sciences,
Term British Columbia Snow Courses, in Relation to ENSO, PDO 104(24): 10288.
and Climate Warming. Rodenhuis, D., Bennett, K., Werner, A., Murdock, T., Bronaugh, D., 2007.
Covey, C. et al., 2003. An overview of results from the Coupled Model Hydro-climatology and future climate impacts in British Columbia,
Intercomparison Project. Global and Planetary Change, 37(1-2): 103-133. Pacific Climate Impacts Consortium, Victoria, B.C..
Fleming, S.W., 2010. Climate Change Signal Detection in BC Hydro Reservoir Schiefer, E., Menounos, B., Wheate, R., 2007. Recent volume loss of British
Inflows. Unpublished BC Hydro Technical Report. Columbian glaciers, Canada. Geophysical Research Letters, 34: 1-6.
Gedalof, Z., Peterson, D.L., Mantua, N.J., 2004. Columbia River flow Schnorbus, M.A., Bennett, K.E., Werner, A.T., Berland, A.J., 2011. Hydrologic
and drought since 1750. Journal of the American Water Resources Impacts of Climate Change in the Peace, Campbell and Columbia
Association, 40(6): 1579-1592. Watersheds, British Columbia, Canada. Pacific Climate Impacts
Gobena, A., 2010. Teleconnections between Large-scale Climate Modes Consortium, Victoria, B.C, pp. 157.
and the Hydroclimate of BC Hydro Watersheds. Unpublished BC Hydro Service, R.F., 2004. As the west goes dry. Science, 303: 1124-1127.
Technical Report. Stahl, K., Moore, R.D., 2006. Influence of watershed glacier coverage on
Haigh, J.D., Winning, A.R., Toumi, R., Harder, J.W., 2010. An influence summer streamflow in British Columbia, Canada. The University of
of solar spectral variations on radiative forcing of climate. Nature, British Columbia, pp. 21.
467(7316): 696-699. Stahl, K., Moore, R.D., Shea, J.M., Hutchinson, D., Cannon, A.J., 2008.
Hamlet, A.F., Lettenmaier, D.P., 1999. Effects of Climate Change on Coupled modelling of glacier and streamflow response to future
Hydrology and Water Resources in the Columbia River Basin. JAWRA climate scenarios. Water Resour. Res., 44.
Journal of the American Water Resources Association, 35(6): 1597-1623. UW-CIG, 2010. Hydrologic Climate Change Scenarios for the
Hart, S.J., Smith, D.J., Clague, J.J., 2010. A multi-species dendroclimatic Pacific Northwest Columbia River Basin and Coastal drainages,
reconstruction of Chilko River streamflow, British Columbia, Canada. http://www.hydro.washington.edu/2860/. University of Washington
Hydrological Processes, 24(19): 2752-2761. Climate Impacts Group.
Jost, G., Moore, R. D., Menounos, B., Wheate, R., 2012. Quantifying the Wolfe, B.B. et al., 2005. Impacts of climate and river flooding on the
contribution of glacier runoff to streamflow in the upper Columbia River hydro-ecology of a floodplain basin, Peace-Athabasca Delta, Canada
Basin, Canada. Hydrol. Earth Syst. Sci., 16, 849-860. since AD 1700. Quaternary Research, 64(2): 147-162.
Meehl, G.A., Boer, G.J., Covey, C., Latif, M., Stouffer, R.J., 2000. The Coupled Wood, A.W., Leung, L.R., Sridhar, V., Lettenmaier, D.P., 2004. Hydrologic
Model Intercomparison Project (CMIP). Bulletin of the American implications of dynamical and statistical approaches to downscaling
Meteorological Society, 81: 313-318. climate model outputs. Climatic Change, 62(1): 189-216.
Moore, R.D. et al., 2011. Glacier and Streamflow Response to Future Climate Zhang, X., Vincent, L.A., Hogg, W., Niitsoo, A., 2000. Temperature and
Scenarios, Mica Basin, British Columbia. Unpublished BC Hydro precipitation trends in Canada during the 20th century. Atmosphere-
Technical Report. Ocean, 38(3): 395-429.
Nakicenovic, N. et al., 2000. Special report on emissions scenarios: a
special report of Working Group III of the Intergovernmental Panel on
Climate Change, Pacific Northwest National Laboratory, Richland, WA
(US), Environmental Molecular Sciences Laboratory (US).
Report edited by James Hrynyshyn
27GDS12-324 28 IMPACTS OF CLIMATE CHANGE ON BC HYDRO’S WATER RESOURCES
You can also read