OTT Advertising in the U.S - The State of - An Analysis of OTT Ad Spending Trends and Top Advertisers - Sensor Tower

Page created by Darrell Avila
 
CONTINUE READING
OTT Advertising in the U.S - The State of - An Analysis of OTT Ad Spending Trends and Top Advertisers - Sensor Tower
The State of
OTT Advertising
in the U.S.
—
An Analysis of OTT Ad Spending
Trends and Top Advertisers
OTT Advertising in the U.S - The State of - An Analysis of OTT Ad Spending Trends and Top Advertisers - Sensor Tower
Introduction
The State of OTT Advertising in the United States

                                                        Pathmatics OTT Data                             The Analysis includes:
     What is Over-The-Top (OTT)?
                                                        • Pathmatics OTT data is powered by a panel     • OTT advertising spending trends from
     Over-The-Top refers to the delivery of film and
                                                          of real OTT & CTV viewers and includes data     October 2021 through November 2022
     television content via the internet without
                                                          representative of all Smart TV brands.        • Duration of ad content an advertiser, brand,
     requiring that consumers subscribe to a
                                                        • Our OTT data begins in October 2021 and         or category is investing in for their OTT
     traditional cable or satellite pay-TV service
                                                          encompasses the U.S. only.                      campaigns
     such as Charter, Comcast, Cox, or DirecTV.
                                                        • The data breaks out five of the top OTT       • OTT share of voice across competitors
                                                          streaming services:                           • OTT creative strategies comparison
     OTT content delivery takes place on any
                                                        ○ Hulu
     device that can receive video over the internet
                                                        ○ Pluto TV
     such as mobile devices, personal computers,
                                                        ○ Tubi
     streaming devices (e.g., Apple TV, Amazon Fire
                                                        ○ Peacock
     Stick, Roku) and smart TVs. A television device
                                                        ○ Paramount+
     that is connected to the internet is also
     known as a connected TV (CTV). Some in the
                                                        Spend outside of these five services is
     industry use CTV as a catch-all term to include
                                                        grouped into Other OTT Streaming Services.
     smart TVs, connected TVs, streaming boxes/
                                                        Pathmatics OTT data does not include
     sticks, and gaming consoles.
                                                        YouTube outside of the YouTube TV product.

 2   | © 2022 Sensor Tower Inc. - All Rights Reserved
OTT Advertising in the U.S - The State of - An Analysis of OTT Ad Spending Trends and Top Advertisers - Sensor Tower
Table of Contents
    04 - OTT Ad Overview
    12 - Travel Booking Services & Travel Agencies
    16 - Transportation
    22 - Food Delivery Services
    27 - Conclusion

3   | © 2022 Sensor Tower Inc. - All Rights Reserved
OTT Advertising in the U.S - The State of - An Analysis of OTT Ad Spending Trends and Top Advertisers - Sensor Tower
OTT Ad Overview:
United
—
       States
An Overview of OTT Ads in the U.S.
OTT Advertising in the U.S - The State of - An Analysis of OTT Ad Spending Trends and Top Advertisers - Sensor Tower
OTT Advertising Overview
United States

               $3.5B                                                                        150B
                                                                     Average                                                                                                           14.8%
               $3.0B
                                                                                            120B                                              Average

               $2.5B
               $2.0B                                                                            90B

               $1.5B                                                                            60B
               $1.0B
                                                                                                30B                                                                 85.2%
              $500M
                                                                                                                                                                                   F
                    0                                                                             0
                          Q4 2021    Q1 2022     Q2 2022   Q3 2022                                    Q4 2021   Q1 2022   Q2 2022   Q3 2022

                                                                                                                                                            14.8%
                           $3.26B                                                                          121B                                         of Total Digital Ad Spending
                                                                                                                                                              was through OTT
                                Average Quarterly                                                          Average Quarterly
                                OTT Ad Spending                                                           OTT Ad Impressions                               (Devices included: Facebook, Instagram, Twitter,
                                                                                                                                                        Desktop & Mobile Video, Desktop & Mobile Display, OTT)

                                                             Note:
 5   | © 2022 Sensor Tower Inc. - All Rights Reserved        Data from Oct. 2021 to Sep. 2022
OTT Advertising in the U.S - The State of - An Analysis of OTT Ad Spending Trends and Top Advertisers - Sensor Tower
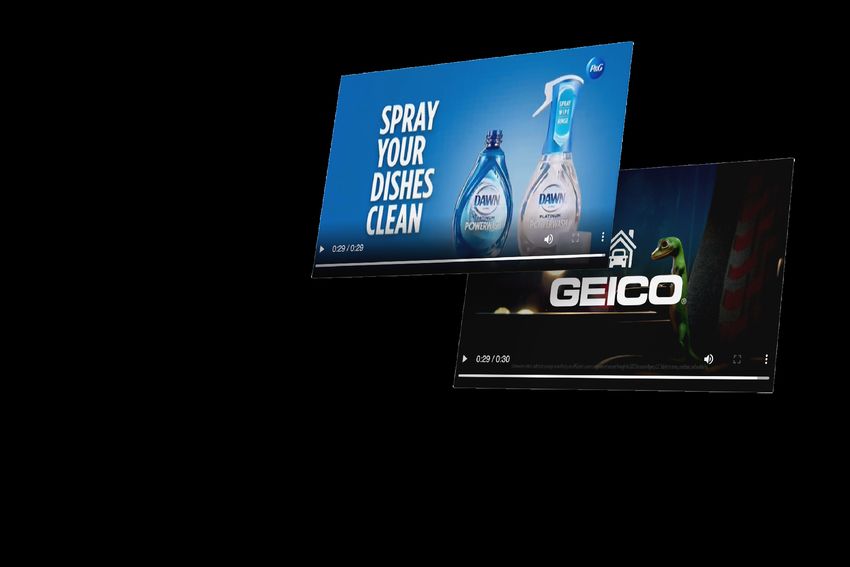
Financial Services Lead across All Streaming Services Publishers
Top Categories by U.S. OTT Ad Spending by Streaming Service Publishers

               Hulu                                                                                Pluto TV                                                Tubi

     1 Consumer Packaged Goods                                 12.3%                      1       Financial Services            14.11%              1   Financial Services        16.6%
     2 Financial Services                                      12.0%                      2       Health & Wellness                11.9%            2   Consumer Packaged Goods   15.5%
                                    V
     3 Auto                                                    10.7%                      3       Media                            11.2%            3   Food & Drink Services     11.1%
     4 Food & Drink Services                                   8.8%                       4       Auto                             10.9%            4   Health & Wellness         9.0%
     5 Health & Wellness                                       8.7%                       5       Consumer Packaged Goods          7.9%             5   Auto                      8.6%

                                                    Peacock                                                                 Paramount+

                                               1        Financial Services                               15.8%         1    Health & Wellness              14.9%
                                               2        Consumer Packaged Goods                          11.6%         2    Financial Services             12.1%
                                               3        Health & Wellness                                 9.6%         3    Consumer Packaged Goods        11.3%
                                               4        Auto                                              9.5%         4    Auto                               9.8%
                                               5        Travel & Tourism                                  8.5%         5    Food & Drink Services              8.1%

                                                               Note:
 6   | © 2022 Sensor Tower Inc. - All Rights Reserved          Data from Oct. 2021 to Nov. 2022
OTT Advertising in the U.S - The State of - An Analysis of OTT Ad Spending Trends and Top Advertisers - Sensor Tower
Media Advertisers, CBS and Paramount Network, Break into the Top 5 OTT Advertisers
Top Advertisers by OTT Ad Spending in the U.S.

              Q4 2021                                          Q1 2022                      Q2 2022                        Q3 2022                  Oct. & Nov. 2022

     1     P&G                                          1 Geico               +9    1 P&G                    +1    1 P&G                     -    1 P&G                    -

     2     Amazon                                       2 P&G                  -1   2 Geico                  -1    2 Geico                   -    2 Geico                  -

     3     Walmart                                      3 Progressive Casualty +4   3 Meta Platforms         New   3 NBC Universal Parks    +2    3 CBS                   +12

     4     Meta Platforms                               4 Yum! Brands        New    4 AbbVie                 +11   4 Amazon                 +10   4 AbbVie                +2

     5     Capital One                                  5 NBC Universal      New    5 NBC Universal Parks    New   5 Yum! Brands            +6    5 Paramount Network     +7

     6     Macy's                                       6 Weight Watchers    New    6 Carvana                +8    6 AbbVie                 -2    6 NBC Universal Parks   -3

     7     Progressive Casualty                         7 FOX Broadcasting   New    7 Progressive Casualty   -4    7 Disney                 +9    7 Inspire Brands        New

     8     Liberty Mutual                               8 Disney             New    8 L'Oreal                New   8 Progressive Casualty   -1    8 Amazon                -4

     9     T-Mobile                                     9 Liberty Mutual       -1   9 FOX Broadcasting       -2    9 PepsiCo                New   9 Lexus                 New

     10    Geico                                        10 Allstate           +6    10 Capital One           New   10 Verizon               +7    10 L'Oreal              New

 7   | © 2022 Sensor Tower Inc. - All Rights Reserved
OTT Advertising in the U.S - The State of - An Analysis of OTT Ad Spending Trends and Top Advertisers - Sensor Tower
CPG Emerged as the Top category in OTT Ad Spending since Q2 2022                                                                                                                          Advertisers in Consumer Packaged Goods (CPG)
                                                                                                                                                                                          and Health & Wellness have shown a relatively
Monthly OTT Ad Spend for the Top 5 Categories
                                                                                                                                                                                          stable upward trend in OTT ad spending this
                                                                                                                                                                                          year. In contrast, advertisers in Financial
                                                                                                                                                                                          Services has seen a decline. Between October
$180M
                                                                                                                                                                                          and November, their OTT ad spend dropped 10
                                                                                                                                                                                          percent year-over-year, from $305 million in
                                                                                                                                              Consumer Packaged Goods
                                                                                                                                                                                          2021 to $273 million in 2022.
$150M
                                                                                                                                                                     Health & Wellness    Along with the decline, Financial Services has
                                                                                                                                                                                          lost the No. 1 category spot in terms of OTT ad
                                                                                                                                                                     Financial Services
$120M                                                                                                                                                                                     spending. And, CPG has emerged as the top
                                                                                                                                                                     Auto                 category as of the top category since Q2 2022.

$90M                                                                                                                                                                                      As microchip supply improved this year, Auto
                                                                                                                                                                                          brands saw particularly strong growth year-
                                                                                                                                                        Food & Drink Services
                                                                                                                                                                                          over-year among top categories.
$60M                                                                                                                                                                                      Compared with same period in 2021, their
                                                                                                                                                                                          expenditure on OTT increased by 74 percent in
                                                                                                                                                                                          October and November 2022.
$30M

                                                                                                                                                                                          Note:
    $0                                                                                                                                                                                    Estimated OTT ad spending in the U.S.
         Oct. 2021

                     Nov. 2021

                                 Dec. 2021

                                             Jan. 2022

                                                         Feb. 2022

                                                                     Mar. 2022

                                                                                 Apr. 2022

                                                                                             May 2022

                                                                                                        Jun. 2022

                                                                                                                    Jul. 2022

                                                                                                                                Aug. 2022

                                                                                                                                            Sep. 2022

                                                                                                                                                         Oct. 2022

                                                                                                                                                                      Nov. 2022
8   | © 2022 Sensor Tower Inc. - All Rights Reserved
Tubi is the Fastest Growing Streaming Service Publisher by Ad Spend                                  Ad spend on Hulu, Pluto TV, Paramount+, and
                                                                                                     Peacock showed a similar trend in the past 12
Growth in Quarterly Ad Spend by Selected Streaming Services
                                                                                                     months. Unlike Tubi where advertisers in the U.S.
                                                                                                     had relatively steady growth in the past 3 quarters,
                                                                                                     ad investment on these four streaming service
                        Hulu                 Paramount+     Peacock      Pluto TV   Tubi             platforms slightly declined between 3 and 15
40%
                                                                                                     percent immediately following holiday season.
            Note: Data is indexed to Q4 2021
            Q4 2021 = 0%
35%                                                                                                  Comparing to Q4 2021, Tubi had the highest
30%                                                                                                  growth with ad spend up 37 percent to $236
                                                                                                     million in Q3 2022. Advertisers in the top five
25%                                                                                                  categories (Financial, Health & Wellness, Media,
20%                                                                                                  Auto, and CPG) increased their ad spend on Tubi.
                                                                                                     CPG brands drove particularly strong growth,
15%                                                                                                  increasing their expenditure by 143 percent in the
10%                                                                                                  past three quarters.

 5%

 0%

 -5%

-10%

-15%

-20%
   Q4 2021                                        Q1 2022             Q2 2022              Q3 2022

9   | © 2022 Sensor Tower Inc. - All Rights Reserved
Hulu is the Most Popular Streaming Service for Younger Audiences                                              Hulu and Peacock are more popular among
                                                                                                              younger viewers, with 58 percent and 51 percent
Percentage of Mobile App Downloads in Each Age Range
                                                                                                              of mobile downloaders under 35 years old,
                                                                                                              respectively. Pluto TV’s adopters skew older, with
                                                                                                              nearly a quarter at 55 and older, while only 7
                                                                                                              percent of those who have installed the mobile
                              Age under 35              Age 35-54                 Age over 55                 Hulu app fall into the over 55 age range.

                                                                                                              This suggests that Hulu & Peacock stand to be
                                                 58%                        35%                   7%          ideal publishers for advertising that targets
                                                                                                              younger audiences, while Pluto TV would be
                                                                                                              recommended for those targeting older
                                            51%                       38%                        11%
                                                                                                              audiences.

                                          48%                       38%                         15%
                                                                                                              Note:
                                                                                                              The U.S. App Store Data in Q3 2022

                                        46%                         40%                         14%

                                 36%                          39%                       24%

         0%                                25%          50%                 75%                        100%

10   | © 2022 Sensor Tower Inc. - All Rights Reserved
Pluto TV was a Popular Streaming Service for Sports Advertising                                                                                  Dating and Arts & Entertainment advertisers tend
                                                                                                                                                 to target younger audiences. They primarily spend
OTT Ad spending by Streaming Service by Category
                                                                                                                                                 on Hulu across the five streaming service
                                                                                                                                                 publishers (Hulu, Pluto TV, Tubi, Peacock, and
                                                                                                                                                 Paramount+). Advertisers in these two categories
                                      Dating                                                  Arts & Entertainment
      $50M                                                                 $300M
                                                                                                                                                 allocated more than 60 percent of their total OTT
                                                                                                                                                 ad spending to Hulu in the last eleven months.
      $40M                                                                 $240M

      $30M                                                                 $180M                                                                 In contrast, Sports, and Religion & Spirituality
                                                                                                                                                 advertisers have a different OTT advertising
      $20M                                                                 $120M
                                                                                                                                                 strategy, spending the most on Pluto TV. Pluto TV
      $10M                                                                 $60M                                                                  was a particularly popular streaming service
                                                                                                                                                 publisher among Sports advertisers, with around
         $0                                                                   $0
                                                                                                                                                 3 times as much spending on that platform as on
                     Hulu      Tubi      Pluto TV   Paramount+   Peacock            Hulu          Pluto TV      Tubi      Peacock   Paramount+

                                                                                                                                                 Hulu.
                                      Sports                                                  Religion & Spirituality                            Note:
       $4M                                                                  $2M                                                                  Data from Jan. 2022 to Nov. 2022

       $3M                                                                 $1.5M

       $2M                                                                  $1M

       $1M                                                                 $500K

         $0         Pluto TV   Hulu      Peacock    Paramount+    Tubi

                                                                              $0   Pluto TV        Hulu      Paramount+   Peacock      Tubi

11   | © 2022 Sensor Tower Inc. - All Rights Reserved
Travel Booking Services
& Travel Agencies:
United States
—
An Overview of the OTT Ad spending Trends
for the Top Travel Advertisers in the U.S.
Priceline Took the Lead with Nearly 50 Percent SOV                                                                                          Priceline and Expedia dominated the top OTT
                                                                                                                                            brands ranking, led by Priceline’s brands,
Top Travel Booking Services & Travel Agencies (TBSTA) Brands by OTT Ad Spending
                                                                                                                                            Booking.com and Priceline.com. Priceline was
                                                                                                                                            the top TBSTA advertiser for OTT ad spend in our
                                                  Top 5 TBSTA Brands by OTT Ad Spending                                                     study period. It invested $24.5 million on OTT,
                                                                                                                                            with its share of voice (SOV) at 48.7 percent.
$14M
$12M                                                                                                                                        Both Priceline and Expedia had a high share of
$10M                                                                                                                                        their digital ad budget allocated to OTT,
$8M                                                                                                                                         accounting for at least 25 percent of their
$6M                                                                                                                                         spending, while their competitor, TripAdvisor,
                                                                                                                                            only allocated 6 percent of its ad budget to OTT.
$4M
$2M                                                                                                                             Expedia
  $0                                                                                                                            Priceline   Note:
             Booking.com               Priceline.com           Expedia                Hotels.com                      Trivago               Estimated OTT ad spending in the U.S. between January
                                                                                                                                            and November 2022
                                                          Device Breakdown

                                                                                                                       6%
                                        30%                                 25%

                           Priceline                             Expedia                                      TripAdvisor

                                                         OTT             Other Devices
                                                                         (Facebook, Instagram, Twitter, TikTok, Snapchat
                                                                         Desktop & Mobile Video, Desktop & Mobile Display)

13   | © 2022 Sensor Tower Inc. - All Rights Reserved
Expedia Turned to OTT Advertising in Q3 2022                                                                    Expedia (Expedia, Hotel.com, Trivago brands)
                                                                                                                shifted their Display & Video ad budgets toward
Top Travel Advertisers’ Quarterly Ad Spend Breakdown by Platform
                                                                                                                OTT in Q3 2022. Their share of ad spending on
                                                                                                                OTT increased from 24 percent in Q1 2022 to
                                                                                                                38 percent in Q3 2022.

                                                                                                                Expedia’s video ad investment has shifted to OTT
                                                   OTT               Display and Video          Social          from YouTube in the past two quarters. Their
                                                                                                                video ad spending on Youtube declined 43
                    Q1 2022                  24%                           51%                   26%            percent from $11.9 million to in Q1 2022 to $6.7
                                                                                                                million in Q3 2022. Meanwhile, their expenditure
                    Q2 2022            14%                                65%                      20%          on streaming services platforms has increased
                    Q3 2022                             38%                      35%            27%             from $2.8 million in Q1 2022 to $7.8 million, up
                                                                                                                170 percent.
                                0%                            25%          50%           75%             100%
                                                                                                                In contrast, its competitor, Priceline Group
                                                                                                                (Book.com, Price.com, KAYAK), shifted their ad
                    Q1 2022                        33%                          40%              27%            investment toward social channels, its share
                                                                                                                of ad spending on OTT declined from a peak of
                    Q2 2022                             37%                       40%             22%
                                                                                                                37 percent in Q2 2022 to 28 percent in Q3 2022.
                    Q3 2022                     28%                 25%                   46%

                                0%                            25%          50%           75%             100%

14   | © 2022 Sensor Tower Inc. - All Rights Reserved
Booking.com Ad spend Peaked during Vacation Season                                                                                                                                         Booking.com, the top travel aggregator app, has
                                                                                                                                                                                           seen more than 10 million downloads in the first
Booking.com Ad Spend & App Downloads in the U.S.
                                                                                                                                                                                           eleven months of 2022.

                                                                          Booking.com OTT Ad Spend in the U.S.
                                                                                                                                                                                           Booking.com saw its OTT ad spend peak during
                                                                                                                                                                                           vacation season. It ramped up its ad spend on
                                Hulu                               Paramount+                          Peacock               Pluto TV                   Tubi
                                                                                                                                                                                           Hulu to $1.5 million in March (spring break), and
     $3M
                                                                                                                                                                                           to $2.6 million in July (summer break). This
  $2.3M                                                                                                                                                                                    helped boost app installs in these two months
                                                                                                                                                                                           by 45 percent and 22 percent compared to the
  $1.5M
                                                                                                                                                                                           previous month, respectively.
  $750K

       $0
            2022-01

                                  2022-02

                                                      2022-03

                                                                           2022-04

                                                                                          2022-05

                                                                                                        2022-06

                                                                                                                   2022-07

                                                                                                                               2022-08

                                                                                                                                             2022-09

                                                                                                                                                             2022-10

                                                                                                                                                                                 2022-11
                                            Booking.com App Downloads in the U.S. (App Store and Google Play)

  $1.5M

     $1M

  $0.5M

       $0
                      2022-01

                                            2022-02

                                                                2022-03

                                                                                2022-04

                                                                                             2022-05

                                                                                                         2022-06

                                                                                                                   2022-07

                                                                                                                             2022-08

                                                                                                                                         2022-09

                                                                                                                                                       2022-10

                                                                                                                                                                       2022-11
15   | © 2022 Sensor Tower Inc. - All Rights Reserved
Transportation:
United States
—
An Overview of the Ad Spending Trends for
the Top Transportation Advertisers in the Europe
Turo Devoted 58 Percent of Ad Spend to OTT                                                                                 Air Travel advertisers dominated the top
                                                                                                                                Transportation Advertisers chart. There were
     Top Transportation Advertisers by OTT Ad Spending
                                                                                                                                four Air Travel advertisers ranked in the top 5,
                                                                                                                                led by United Airlines and Southwest Airlines. In
                                                                                                                                addition, Air Travel ads accounted for more than
                                                   Car & RV Rental Services   Air Travel      Carpooling & Ridesharing          half the share of voice (SOV) for Transportation
                                                                                                                                ads on OTT.
                     Turo

                                                                                                                                Turo, a car rental services brand, was the largest
       United Airlines
                                                                                                                                Transportation advertiser on OTT, with $14.6
    Southwest Airlines                                                                                                          million in ad spending between October 2021
                                                                                                                                and November 2022. Its spending on OTT was
        Delta Air Lines                                                                                                         nearly 6 times as much as its competitor,
                                                                                                                                Enterprise. In addition, among top car rental
      LowCostAirlines                                                                                                           services brands, Turo spent a relatively high
                                                                                                                                share on OTT, apportioning 58 percent of its
              Enterprise
                                                                                                                                total digital ad spending on OTT.
                     Uber

                      Ly                                                                                                        Note:
                                                                                                                                Estimated OTT ad spending in the U.S. between October
     Hawaiian Airlines                                                                                                          2021 and November 2022

             Outdoorsy

                            $0                       $3M                $6M                $10M             $13M         $16M

      17   | © 2022 Sensor Tower Inc. - All Rights Reserved
f
United Airlines Increased Investment on OTT Beginning in May 2022                                                                                                                              Delta, an official airline of Team USA, saw its
                                                                                                                                                                                               advertising investment spike during Winter
Monthly Ad Spending for the Top 3 Air Travel Advertisers
                                                                                                                                                                                               Olympics. In particular, its ad spend on OTT
                                                                                                                                                                                               reached $1.1 million in February 2022; nearly 6
                                                                                                                                                                                               times as much as its OTT ad investment
                                               Delta                                 Southwest                                    United Airlines
                                                                                                                                                                                               in the previous month. Building on its Team USA
     $3M                                                                                                                                                                                       partnership, Delta’s OTT advertising campaigns
                                                                                                                                                                                               featured inspiring stories that highlighted the
                                                                                                                                                                                               power of perseverance and resilience in ways that
 $2.5M
                                                                                                                                                                                               audiences could relate to.

                                                                                                                                                                                               As travel demand surged after travel restrictions
     $2M
                                                                                                                                                                                               lifted this year, United Airlines increased their
                                                                                                                                                                                               OTT ad investment beginning in May 2022,
                                                                                                                                                                             United Airlines
 $1.5M                                                                                                                                                                                         spending an average of $1.3 million per month
                                                                                                                                                                                               between May through November 2022. They
                                                                                                                                                                                               consequently rose by 14 positions to become the
     $1M                                                                                                                                                                                       No.1 Air travel advertiser since Q2 2022.
                                                                                                                                                                           Southwest

 $500K

                                                                                                                                                                             Delta
      $0
           Oct. 2021

                       Nov. 2021

                                   Dec. 2021

                                                 Jan. 2022

                                                             Feb. 2022

                                                                         Mar. 2022

                                                                                       Apr. 2022

                                                                                                   May 2022

                                                                                                              Jun. 2022

                                                                                                                          Jul. 2022

                                                                                                                                       Aug. 2022

                                                                                                                                                   Sep. 2022

                                                                                                                                                               Oct. 2022

                                                                                                                                                                              Nov. 2022
18   | © 2022 Sensor Tower Inc. - All Rights Reserved
Air Travel OTT Ad Spend Spotlight                                                                                                            The top three Air Travel advertisers (United Airlines,
                                                                                                                                             SouthWest, and Delta) accounted for 75 percent of
United Airlines vs. Competitors
                                                                                                                                             SOV for Air Travel advertising on OTT in the U.S.
                                                                                                                                             United Airlines led the way at 38 percent, followed
                                                                                                                                             by its competitors, SouthWest (26 percent) and
                                                    Air Travel Ad Spend on OTT Share
                                                        Between October 2021 and November 2022
                                                                                                                                             Delta (12 percent).

                 Delta                          SouthWest                             United Airlines                        Other           Air Travel ad videos were most frequently
                                                                                                                                             30 seconds long. United Airlines particularly spent
                                                                                                                                             more than 90 percent of their OTT ad spend on 30-
       12%                        26%                                           38%                                        25%               second-long videos. Meanwhile, their competitors,
                                                                                                                                             SouthWest and Delta, also allocated more than half
0%                                 25%                                  50%                             75%                          100%    of their OTT ad spend on those (30-second) videos.

                                                                                                                                             Note:
                                                                                                                                             Data from Oct. 2021 to Nov. 2022
                                                           Video Duration Breakdown

                      5%                                                                                      6%

                                                                                                    17%
                                                           41%
                  United Airline                                    SouthWest                                      Delta
                                                                                   59%
                                                                                                                                       30s
                                                                                                                            74%        15s
                           93%                                                                                                         60s
                                                                                                                                       6s

19   | © 2022 Sensor Tower Inc. - All Rights Reserved
Turo’s OTT Ad Spending Steadily Increased Year-over-Year                                                                                                      As the travel industry has gradually recovered from
                                                                                                                                                              the hit taken at the start of the pandemic,
Top Car & RV Rental Services Advertisers Monthly OTT Ad Spending
                                                                                                                                                              advertisers in Car & RV Rental Services have
                                                                                                                                                              increased their OTT ad investment year-over-year.
                 $3M                                                                                                                                          Between October and November, Turo has taken
                                                                                                                                                     Turo     the lead, up 685 percent in OTT ad spending in
                 $2M                                                                                                                                          2022, compared to the same period in 2021.
                                                                                                                                                              Meanwhile, their competitor, Enterprise, also
                 $1M                                                                                                                                          increased their OTT ad spending to $534K in the
                                                                                                                                                              past two months, up 275 percent year-over-year.
                   $0

                                                                                                                                                              Outdoorsy saw its OTT ad spending peak in the
              $400K                                                                                                                                           beginning of 2022. In March, they mainly targeted
              $300K                                                                                                                                           RV owners, with their OTT ads featuring positive
                                                                                                                                                 Enterprise
                                                                                                                                                              feedback from actual users in this group. As
              $200K
                                                                                                                                                              camping season (June through September)
              $100K                                                                                                                                           approached, Outdoorsy shifted focus towards RV
                   $0                                                                                                                                         renters, with nine of the top ten creatives between
                                                                                                                                                              April and May 2022 aimed at this group.
              $400K

              $300K                                                                                                                                           Note:
                                                                                                                                                              Estimated OTT ad spending in the U.S.
              $200K

              $100K
                                                                                                                                                 Outdoorsy
                   $0
                        10/1/21

                                  11/1/21

                                            12/1/21

                                                      1/1/22

                                                               2/1/22

                                                                        3/1/22

                                                                                 4/1/22

                                                                                          5/1/22

                                                                                                   6/1/22

                                                                                                            7/1/22

                                                                                                                     8/1/22

                                                                                                                              9/1/22

                                                                                                                                       10/1/22

                                                                                                                                                 11/1/22
20   | © 2022 Sensor Tower Inc. - All Rights Reserved
Car & RV Rental Services OTT Ad Spend Spotlight                                                       Turo and Enterprise employed very different
                                                                                                      OTT ad strategies in the U.S. While Turo allocated
OTT Ad Strategy Turo vs. Enterprise
                                                                                                      71 percent of its OTT ad budget to Tubi, Enterprise
                                                                                                      spent the most on Pluto TV and Hulu, with nearly
                                                                                                      half of its OTT ad spending across those two
     OTT Ad Spend Breakdown by Streaming Services                    Video Duration Breakdown         platforms. Enterprise only allocated 1 percent of
                                                                                                      its OTT ad spending on Tubi.
     100%
                      11%                                                                             Turo and Enterprise used similar proportions
                                                                              4%
                                                                                                      of their ad spend on the different lengths of ad
                                                                                                      videos. Both leaned heavily on 30-second-long
      75%                                   48%                                                 30s   videos, with more than 90 percent of their OTT
                                                                               Turo
                                                                                                15s   ad spending on those videos.

                                                                                 96%                  Note:
      50%             71%                   1%                                                        Estimated OTT ad spending in the U.S. between January
                                                                                                      though November 2022

                                                                           10%
                                            27%

      25%                                               OTT
                                                                            Enterprise          30s
                                                        Peacock
                                                                                                15s
                       3%                               Paramount+
                                            21%         Tubi
                      12%                               Pluto TV
                                                                                   90%
                                                        Hulu
       0%
                      Turo              Enterprise

21   | © 2022 Sensor Tower Inc. - All Rights Reserved
Food Delivery Services:
United States
—
An Overview of the Ad Spending Trends for
the Top Food Delivery Advertisers in the United States
Instacart is Once Again the Top Food Delivery Advertiser in Q3 2022
Top Food Delivery Advertisers by OTT Ad Spending in the U.S.

               Q4 2021                                          Q1 2022                Q2 2022                 Q3 2022               Oct. & Nov. 2022

      1 Instacart                                        1 DoorDash        +1    1 UberEATS        +6    1 Instacart          +1   1 Instacart          -

      2 DoorDash                                         2 Basketful       New   2 Instacart       +2    2 DoorDash           +1   2 DoorDash           -

      3 GrubHub                                          3 GrubHub          -    3 DoorDash        -2    3 HelloFresh         +1   3 UberEATS           +3

      4 UberEATS                                         4 Instacart       -3    4 HelloFresh      +1    4 GrubHub            +1   4 GrubHub            -

      5 Hungryroot                                       5 HelloFresh      +1    5 GrubHub         -2    5 Tovala             +4   5 HelloFresh         -2

      6 HelloFresh                                       6 Daily Harvest   +2    6 Daily Harvest    -    6 UberEATS           -5   6 Blue Apron         +8

      7 OmahaSteaks                                      7 UberEATS        -3    7 Hungryroot      +1    7 Hungryroot         -    7 Tovala             -2

      8 Daily Harvest                                    8 Hungryroot      -3    8 Drizly          +7    8 Drizly             -    8 Home Chef          +5

      9 Drizly                                           9 Home Chef       +3    9 Tovala          +2    9 ButcherBox         +3   9 Drizly             -1

      10 Tovala                                          10 ezCater        New   10 Blue Apron     New   10 OmahaSteaks.com   +4   10 Fresh Direct   New

 23   | © 2022 Sensor Tower Inc. - All Rights Reserved
Grocery Delivery Ad Spend on OTT increased 14% Year-over-Year                                                     Advertisers in Delivered Meal-Kits & Specialty
                                                                                                                  Foods saw a year-over-year reduction in OTT ad
OTT Ad Spend for the Subcategories
                                                                                                                  investment. Ad spending between October and
                                                                                                                  November in 2022 was down 11 percent when
                                                                                                                  compared to the $9.2 million spent during the same
                                                              OTT Ad Spending                                     period in 2021.
                                                          in October and November

      $18M                              +11%
                                                                                                                  Among top Delivered Meal-Kits advertisers in 2021,
                                                                                                                  HelloFresh and Home Chef increased their OTT ad
                                                                                                                  investment year-over-year by 44 percent and
      $15M
                                                                                                                  26 percent, respectively, while their competitors,
                                                                      +14%
                                                                                                                  Hungryroot, Daily Harvest, and Imperfect, shifted
      $12M                                                                                                        their ad budget away from OTT. In particular,
                                                                                                                  Imperfect halted spending on OTT beginning in May
                                                                                                                  2022.
       $9M
                                                                                                      -11%

       $6M                                                                                                        Note:
                                                                                                                  Estimated OTT ad spending in the U.S.

       $3M

          $0
                      Restaurant Ordering &                  Grocery Delivery             Delivered Meal-Kits &
                             Delivery                                                       Specialty Foods

                                       Oct. & Nov. 2021                         Oct. & Nov. 2022

24   | © 2022 Sensor Tower Inc. - All Rights Reserved
DoorDash and GrubHub demonstrate a similar
UberEats’ OTT Ad Spend Peaked after Partnering with Grocery Outlet                                                                                      trend in OTT ad spending, with a sharp reduction
Monthly OTT ad spending by Top Food Delivery Brands                                                                                                     occurring between late Q1 2022 and mid Q2 2022.
                                                                                                                                                        In anticipation of an increase in food deliveries
                                                                                                                                                        during the holiday season, DoorDash and
                                 DoorDash                                 UberEATS                              GrubHub                                 GrubHub consolidated their OTT advertising
                                                                                                                                                        budget across the holiday season, increasing it
     $6M                                                                                                                                                month over month during the final months of the
                                                                                                                                                        year.

                                                                                                                                                        In contrast to DoorDash and GrubHub, UberEats
  $4.5M                                                                                                                                                 showed an upward trend in OTT ad spending
                                                                                                                                                        beginning in February 2022 and peaking in June
                                                                                                                                                        2022. As UberEats aimed to extend grocery
                                                                                                                                                        delivery this year, it invested heavily on OTT for its
     $3M                                                                                                                                                “Uber Don’t Eats” campaigns. In addition to this, it
                                                                                                                                                        ramped up its OTT ad spending to $5.6 million in
                                                                                                                                                        June 2022, a month after it partnered with Grocery
                                                                                                                                                        Outlet. Throughout the OTT campaigns, UberEats
  $1.5M                                                                                                                                                 emphasized that “You can now get anything
                                                                                                                                                        deliver from UberEats”.

        $0
             10/1/21

                       11/1/21

                                  12/1/21

                                            1/1/22

                                                        2/1/22

                                                                 3/1/22

                                                                           4/1/22

                                                                                     5/1/22

                                                                                              6/1/22

                                                                                                       7/1/22

                                                                                                                  8/1/22

                                                                                                                           9/1/22

                                                                                                                                    10/1/22

                                                                                                                                              11/1/22
25   | © 2022 Sensor Tower Inc. - All Rights Reserved
Delivered Meal-Kits: Creatives Highlight                    The meal kit industry has grown rapidly in these
                                                            last few years, with many competitors crowding
Top Delivered Meal-Kits Brands' Creative Strategy in 2022
                                                            the market in the U.S. To gain a foothold in the
                                                            market, well-known meal-kit companies, such
                                                            as HelloFresh, Home chef, and Blue Apron,
                                                            continually focus on promoting deals in their OTT
                                                            creatives, with highlighted keywords “16 free
                                                            meals”, “$90 off”, and “Save $110”.

                                                            With over $13.5 million invested on OTT
                                                            advertising in the first eleven months of 2022,
                                                            HelloFresh dominates the OTT advertising space
                                                            in the U.S. (with a 28 percent SOV on OTT).

                                                            In 2022, HelloFresh collaborated closely with
                                                            celebrities such as Antoni Porowski (Queer Eye
                                                            star), and David Burtka (professional chef). OTT ad
                                                            spending peaked at $1.9 million in May and $1.9
                                                            million in August soon after they began their
                                                            partnership with Antoni Porowski at the end of
                                                            April, and David Burtka in August.

26   | © 2022 Sensor Tower Inc. - All Rights Reserved
Conclusion
—
Key Takeaways from the Report
Conclusion: OTT Advertising in United States

● OTT ad spending accounted for nearly 15 percent of total digital ad spending in
  the U.S. Between October 2021 and September 2022, with US advertisers
  spending a combined average of $3.26 billion per quarter on OTT.

● Advertisers in Consumer Packaged Goods (CPG) have shown a stable upward
  trend in OTT ad spending this year. Between October and November, their
  investment on OTT increased 58 percent year-over-year. The CPG category has
  become the No. 1 category since Q2 2022.

● Expedia (Expedia, Hotel.com, Trivago brands) shifted their Display & Video ad
  budgets toward OTT in the past two quarters. Their expenditure on OTT increased
  from $2.8 million in Q1 2022 to $7.8 million in Q3 2022, up 170 percent. And, its
  share of ad spending on OTT increased 14 percentage points.

● As travel demand surged after restrictions were lifted , United Airlines boosted
  their OTT ad investment beginning in May 2022, spending an average of $1.3
  million per month between May through November 2022, resulting in their rise by
  14 positions to become the No.1 Air travel advertiser since Q2 2022.

● As UberEats aimed to extend grocery delivery this year, they invested heavily on
  OTT for their “Uber Don’t Eats” campaigns, and saw their OTT ad spending peak in
  June 2022, a month after they partnered with Grocery Outlet.

28   | © 2022 Sensor Tower Inc. - All Rights Reserved
© 2022 Sensor Tower Inc. - All Rights Reserved

About Sensor Tower

Sensor Tower is the leading provider of
actionable intelligence for the global digital
economy, while Pathmatics turns the world's
marketing data into actionable insights.
Sensor Tower provides enterprise-level data
on mobile apps and publishers through
proprietary Store Intelligence, Ad Intelligence,
Usage Intelligence, Consumer Intelligence,
and App Intelligence platforms, which offer                             LONDON

download, revenue, share of voice, and                                                       SEOUL
engagement metrics at unparalleled accuracy             SAN FRANCISCO
                                                                                          SHANGHAI
for the world’s most important markets.
Acquired in 2021 by Sensor Tower, Pathmatics
brings visibility into display, social, video, OTT,
and mobile advertising data.

Contact Info:
sensortower.com
sales@sensortower.com
@sensortower

29   | © 2022 Sensor Tower Inc. - All Rights Reserved
Sensor Tower & Pathmatics
Terms of Use

This report and all original content contained within are wholly owned   If you would like to republish any of the data
by Sensor Tower, Inc. © 2022.                                            contained in this report, please email
                                                                         info@sensortower.com for further
Modification, republication, distribution, or other unauthorized usage   information on how to do so.
violate this copyright, unless express permission has been granted.
                                                                         We’re always happy to work with news
App icons, images, and other branding assets are property of their       organizations to provide custom data,
respective publishers and are used expressly for the purpose of          insights and commentary.
editorial commentary.
                                                                         Contact press@sensortower.com for help.

30   | © 2022 Sensor Tower Inc. - All Rights Reserved
You can also read