Optimizing Whole-Page Presentation for Web Search - umich ...
←
→
Page content transcription
If your browser does not render page correctly, please read the page content below

Optimizing Whole-Page Presentation for Web Search

YUE WANG, University of Michigan, USA
DAWEI YIN, Data Science Lab, JD.com, China
LUO JIE, Snap Inc., USA
PENGYUAN WANG, University of Georgia, USA
MAKOTO YAMADA, RIKEN AIP Center, Japan
YI CHANG, Huawei Research America, USA
QIAOZHU MEI, University of Michigan, USA
Modern search engines aggregate results from different verticals: webpages, news, images, video, shopping,
knowledge cards, local maps, etc. Unlike “ten blue links”, these search results are heterogeneous in nature
and not even arranged in a list on the page. This revolution directly challenges the conventional “ranked list”
formulation in ad hoc search. Therefore, finding proper presentation for a gallery of heterogeneous results is
critical for modern search engines.
   We propose a novel framework that learns the optimal page presentation to render heterogeneous results
onto search result page (SERP). Page presentation is broadly defined as the strategy to present a set of items
on SERP, much more expressive than a ranked list. It can specify item positions, image sizes, text fonts, and
any other styles as long as variations are within business and design constraints. The learned presentation is
content-aware, i.e. tailored to specific queries and returned results. Simulation experiments show that the
framework automatically learns eye-catchy presentations for relevant results. Experiments on real data show
that simple instantiations of the framework already outperform leading algorithm in federated search result
presentation. It means the framework can learn its own result presentation strategy purely from data, without
even knowing the “probability ranking principle”.

CCS Concepts: • Information systems → Combination, fusion and federated search; Presentation of
retrieval results; • Computing methodologies → Learning to rank; Reinforcement learning;

Additional Key Words and Phrases: Whole-page optimization, page presentation, user satisfaction

ACM Reference Format:
Yue Wang, Dawei Yin, Luo Jie, Pengyuan Wang, Makoto Yamada, Yi Chang, and Qiaozhu Mei. 2017. Optimizing
Whole-Page Presentation for Web Search. ACM Trans. Web 9, 4, Article 39 (October 2017), 25 pages. https:
//doi.org/0000001.0000001

Authors’ addresses: Yue Wang, University of Michigan, Department of Electrical Engineering and Computer Science, 105
South State St. Ann Arbor, MI, 48109, USA, raywang@umich.edu; Dawei Yin, Data Science Lab, JD.com, 8 Beichen West Rd.
Beijing, 100105, China, yindawei@acm.org; Luo Jie, Snap Inc. 64 Market St. Venice, CA, 90291, USA, luoj.roger@gmail.com;
Pengyuan Wang, University of Georgia, Department of Marketing, 630 South Lumpkin St. Athens, GA, 30602, USA,
pengyuan@uga.edu; Makoto Yamada, RIKEN AIP Center, Mitsui Building, 15th floor, 1-4-1 Nihonbashi, Tokyo, 103-0027,
Japan, makoto.yamada@riken.jp; Yi Chang, Huawei Research America, Santa Clara, CA, USA, yichang@acm.org; Qiaozhu
Mei, University of Michigan, School of Information, 105 South State St. Ann Arbor, MI, 48109, USA.

Permission to make digital or hard copies of all or part of this work for personal or classroom use is granted without fee
provided that copies are not made or distributed for profit or commercial advantage and that copies bear this notice and the      39
full citation on the first page. Copyrights for components of this work owned by others than the author(s) must be honored.
Abstracting with credit is permitted. To copy otherwise, or republish, to post on servers or to redistribute to lists, requires
prior specific permission and/or a fee. Request permissions from permissions@acm.org.
© 2017 Copyright held by the owner/author(s). Publication rights licensed to Association for Computing Machinery.
1559-1131/2017/10-ART39 $15.00
https://doi.org/0000001.0000001

                                   ACM Transactions on the Web, Vol. 9, No. 4, Article 39. Publication date: October 2017.
39:2                                                                                         Y. Wang et al.

1   INTRODUCTION
A decade ago, search engines returned “ten blue links”. Result presentation was straightforward:
ranking webpages by estimated relevance. It naturally saves user effort as she scans down the list,
hopefully hitting the desired information at top ranks. This “probability ranking principle” was
long envisioned in the 1970s [54], and later confirmed by eye-tracking studies [27, 28] and search
log analysis [18, 34].
  Today’s search engines return far richer results than “ten blue links”. Aside from webpages,
results can also include news, images, video, shopping, structured knowledge, and local business
maps. Each specific corpus is indexed by a vertical search engine; they are federated to serve
the user’s information need. Unlike “ten blue links”, vertical search results have different visual
appearance, layouts and sizes. They span across multiple columns on the page, not restricted in the
mainline list (Figure 1).
        Ads

                                                                                                   Knowledge card
        News
        Image
        Web

                                                                                                   Ads
        Video

           Fig. 1. Yahoo search engine result page for the query “obama”. Accessed on July 12, 2015.

   Federated search results have been transforming user interaction patterns on search result pages
(SERPs). Human eyeballs are spontaneously attracted by graphical results, causing a significant
attention bias known as the vertical bias [13, 38, 44]. More interestingly, blue links surrounding a
vertical result are also examined with increased probability [13]. In the presence of vertical results,
user satisfaction towards an entire SERP cannot be reliably inferred from preference judgments for
pairs of results [5].

ACM Transactions on the Web, Vol. 9, No. 4, Article 39. Publication date: October 2017.
Optimizing Whole-Page Presentation for Web Search                                                                     39:3

   These observations indicate that users do not sequentially scan results returned by federated
search. Although the conventional “ranked list” formulation can still be used for federated search
result presentation [3, 4], it is essentially a first-order approximation of the problem.
   In this paper, we propose a novel framework that learns the optimal presentation for heteroge-
neous search results on SERP. Page presentation is broadly defined as the strategy to present a set of
heterogeneous items on SERP, much more expressive than a ranked list. It can specify item positions,
image sizes, text fonts, or any other styles as long as changes of these elements are allowed by
business constraints 1 and page design templates. The goodness of a presentation is measured by
user satisfaction metric: better presentation will make the user happier. The framework first learns
a scoring function that maps search results and their presentation on SERP to user satisfaction
metric. Then, given search results of a new query, the framework computes a presentation that
maximizes user satisfaction.
   The framework is quite general. First, practitioners can flexibly define the scope of page presen-
tation. It can encode item positions (both horizontal and vertical) as well as element styles, such as
image sizes and text fonts. It naturally encompasses ranked list as a special case. Second, different
application scenarios can adopt different user satisfaction metric. It is not limited to click-based
metric, but can also take other interactive behaviors into account, such as dwelling time and
time-to-first-click. Lastly, the framework can potentially be instantiated in other interactive search
scenarios, such as presenting search results on mobile and tablet devices, displaying multimedia
feeds in online social networks, and arranging items on retailing websites.
   We conduct experiments on both synthetic and real data to demonstrate the potential power of
the proposed framework. Simulation experiments show that the framework can adapt to different
types of attention bias and learn to present relevant results to catch user’s eyeballs. This means
our approach directly targets the new challenge brought by federated search, where users may not
scan the results sequentially, and results are not in a ranked list. In real data experiments, simple
instantiations of the framework outperform the leading algorithm in federated search result ranking.
This is encouraging, because ranking algorithms use the probability ranking principle in its result
presentation, while our framework does not even know the existence of it. Nevertheless, it learns
its own result presentation principle purely from data and is able to deliver the state-of-the-art
performance.
   Our main contribution is summarized as follows:
        • We formulate a new problem, whole-page presentation optimization, which extends the homo-
          geneous document ranking in ad hoc search (Section 2).
        • We propose a solution framework that computes the optimal presentation for federated
          search results (Section 3 and 4).
        • Experiments on synthetic and real data demonstrate that the proposed framework is promising
          in solving the new problem (Section 5 and 6).
        • We reformulate the problem in reinforcement learning, which provides a unified perspective.
          It not only explains the original approach as a special reinforcement learning algorithm, but
          also inspires new policy-based approaches that are efficient at runtime (Section 7).
   Part of the results were reported in our recent work at WSDM 2016 [64]. For those who have
read the conference version, this extension includes a case study following the real data experiment
(Section 6) and a comprehensive literature review of related topics (Section 8). The reinforcement
learning reformulation and policy learning approach (Section 7) are completely new.

1 For   example, sponsored results must be placed on the top.

                                    ACM Transactions on the Web, Vol. 9, No. 4, Article 39. Publication date: October 2017.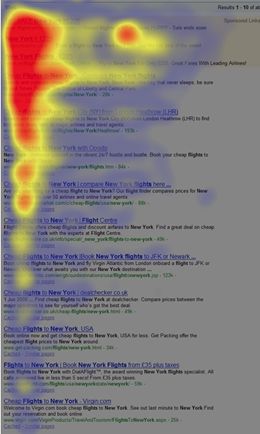
39:4                                                                                          Y. Wang et al.

2   PROBLEM FORMULATION
The problem statement of page presentation optimization is as follows: “given search results to be
displayed on a page, to find the optimal presentation that maximizes user satisfaction”. We assume
the following setting: search engine returns a set of results upon receiving a query, and renders
the items on SERP according to some presentation strategy. As the SERP is shown to the user, she
interacts with it and get certain degree of satisfaction. Now let us define some important concepts
in our setting:
   Definition 2.1 (Page Content). Page content is the set of search results to be displayed on a page.
Each search result is an item. Upon receiving user’s query, search engine backend returns a set of
k items. Each item is represented as a vector xi 2 . Note that different users and different queries
will produce different sets of items, so xi also encodes information from actual users and queries.
Page content is represented as concatenation of k item vectors: x⊤ = (x⊤     1 , · · · , xi , · · · , xk ). The
                                                                                          ⊤            ⊤

domain of x is defined by all possible page content returned by the backend, denoted as X.
   Definition 2.2 (Page Presentation). Page presentation defines the way in which page content x is
displayed, such as position, vertical type, size, and color. It is encoded as a vector p. The domain
of p is defined by all possible page presentations permitted by business and design constraints,
denoted as P.
  Definition 2.3 (Search Result Page (SERP)). When page content x is put on page according to
presentation strategy p, a search result page (SERP) is generated. In other words, content x and
presentation p uniquely determine a SERP. It is represented as a tuple (x, p) ∈ X × P.
   Definition 2.4 (User Response). User response includes her actions on SERP, such as number of
clicks, positions of clicks, dwell time of clicks, and time to first click. This information is encoded
in a vector y. The domain of y is defined by all possible user responses, denoted as Y.
   Definition 2.5 (User Satisfaction). The user experiences certain degree of satisfaction as she
interacts with the SERP. We assume that user satisfaction can be calibrated as a real value v ∈ R:
larger value of v means higher satisfaction.
   The user response is a strong indicator for satisfaction. Intuitively, if a user opened the SERP,
clicked on the top result right away, then spent long time dwelling on that result, she was highly
likely to be happy with the result. With definitions above, we formulate our problem:
  Page Presentation Optimization is to find the presentation p ∈ P for a given page content
x ∈ X, such that when the SERP (x, p) is presented to the user, her satisfaction score v is maximized.
  If we define a scoring function F : X × P → R that maps a SERP (x, p) to a user satisfaction
score v, then page presentation optimization problem can be formally written as ∀x ∈ X,
                                                     max F (x, p) .                                        (1)
                                                      p∈ P

   The problem of page presentation optimization is both new and challenging. It is new because
page presentation can be flexibly defined, which opens up possibility to learn brand-new ways to
display information. Retrieval and recommender systems typically use a ranked list for displaying
homogeneous content. As heterogeneous results are weaved onto webpages, it is critical to present
them in a proper manner to maximize user’s utility. The problem is challenging because it is rather
unclear how to find the scoring function that maps the entire SERP (content and presentation) to
user satisfaction. We propose our solution framework in the next section.
2 Throughout   the paper we use bold lowercase letters for column vectors.

ACM Transactions on the Web, Vol. 9, No. 4, Article 39. Publication date: October 2017.
Optimizing Whole-Page Presentation for Web Search 39:5
3 PRESENTATION OPTIMIZATION FRAMEWORK
In this section, we propose to solve page presentation optimization using a supervised learning
approach. We set up a general framework, including data collection methodology, design of scoring
function F (·, ·), the learning and optimization stages. In the next section, we describe actual
instantiations of the framework.
3.1 Data Collection Through Exploration
Supervised machine learning needs labelled training data. The caveat in data collection here is that
normal search traffic cannot be used as the training data to learn the scoring function F (x, p). This
is because in normal search traffic, search engine has a deterministic policy to present page content
x, which is controlled by existing model/rules within the system. In other words, page presentation
p is uniquely determined given page content x. However, we expect the model F to tell us user
satisfaction as we search through different page presentations. Confounding between x and p will
bias the learned model, which will be a serious problem.
To eliminate confounding, we allocate “presentation exploration bucket” to do randomized
experiments. For each request in the bucket, we organize page content with random page presenta-
tion. Here “random” means to uniformly draw presentation strategies within business and design
constraints, such that user experience is not hurt too much. Further, the presentation exploration
traffic is controlled within a very small amount so as not to affect overall quality of the search
service. Data collected in this way allow unbiased estimation of the scoring function.
In cases that showing random exploration results to the users is not desired, it would also be
possible to either hire human annotators to label the page, or collect data from multiple buckets
with different fixed presentation strategy as every Internet company is doing for testing their UI
changes. Since we have already developed a good data collection through exploration framework
in our production system, we choose to take this approach for data collection.
3.2 Learning Stage
The core of page presentation optimization is to estimate the scoring function v = F (x, p). We
might consider two approaches:
(I) Direct approach: Collect page-wise user satisfaction ratings and directly model the depen-
dency between SERP and user satisfaction. The dependency path is “(x, p) − v”.
(II) Factorized approach: First predict user response y on SERP, then find a function that
measure user satisfaction from these responses. The dependency path is “(x, p) − y − v”.
Approach (I) is straightforward. However it is very difficult, particularly at a large scale, to obtain
explicit user rating s towards the entire SERP. To construct such data set, we would have needed
substantial amount of observations and human annotation to overcome training data sparseness.
Approach (II) takes two steps. The first step is to predict user responses on a given page; the second
step is to measure user satisfaction based on her page-wise response. Introducing user response
variable y permits a separation of concerns. On the one hand, user response on a page is a direct
consequence of interacting with the page. On the other hand, user satisfaction is typically estimated
from user responses only, e.g. using total number of clicks, or long dwell time. In Approach (II), the
complex dependency in F (·, ·) is decomposed into two relatively independent factors. Furthermore,
on a practical note, Approach (II) is more realistic for current Web technology because user response
on SERP can be easily collected via Javascript, whereas explicitly asking the users to evaluate the
whole page is very uncommon. Therefore, we adopt the factorized approach.
In factorized approach, the first step is to learn a user response model
y = f (x, p), ∀ x ∈ X, p ∈ P.
ACM Transactions on the Web, Vol. 9, No. 4, Article 39. Publication date: October 2017.39:6 Y. Wang et al.
This is a supervised learning task; the actual form of f (x, p) can be chosen flexibly. We can simply
build one model for each component yi in y, or we can jointly predict all components of y using
structured output prediction [9]. In any case, user’s responses on the page depends on both the
content (whether it is relevant, diverse, or attractive) and the presentation (whether it is close to
the top, around a graphical block, or shown in big size).
The second step is a utility funciton which defines a user satisfaction metric
v = д(y), ∀ y ∈ Y.
Finding the right user satisfaction metric based on page-wise user responses is not the focus
of this paper, and can itself be a substantial research topic in interactive information systems
[30, 43, 56]. Indeed, practitioners often heuristically define the metric as aggregation of fine-grained
user responses, such as click-through rates, long-dwell-time clicks, time-to-first-click.
Finally, our scoring function for the entire SERP is
v = F (x, p) = (д ◦ f )(x, p) = д( f (x, p)).
3.3 Optimization Stage
We compute the optimal presentation p∗ given content x by solving the following optimization
problem:
max д( f (x, p)) .
p∈ P
Computational cost of this optimization problem depends on actual form of the objective function
F = д ◦ f and the constraints on presentation p. In the next section we show that for certain instan-
tiations of f and д, p∗ can be computed quite efficiently. In Section 7, we present a reinforcement
learning solution where the optimization stage is replaced by a policy.
4 INSTANTIATIONS OF PRESENTATION OPTIMIZATION FRAMEWORK
This section describes instantiations of the framework, including feature representation, user
satisfaction metric, two user response models and their learning and optimization stages. We
conclude this section by showing that the framework encompasses learning to rank.
4.1 Features
Both content and presentation on a SERP are represented in a feature vector, which will be the
input to user response models.
4.1.1 Content Features. Content features contain information of the query and corresponding
search results, similar to those used in learning to rank. We adopt the same content features as
used in [32] to facilitate direct comparison in experiments (Section 6):
• Global result set features: features derived from all returned results. They indicate the
content availability of each vertical.
• Query features: lexical features such as the query unigrams, bigrams and co-occurrence
statistics. We also use outputs of query classifiers, and historical session based query features,
etc.
• Corpus level features: query-independent features derived for each vertical and web docu-
ment such as historical click-through rates, user preferences, etc.
• Search result features: extracted from each search result. A list of statistical summary
features such as relevance scores and ranking features of individual results. For some verticals,
we also extract some domain specific meta features, such as if the movie is on-screen and
ACM Transactions on the Web, Vol. 9, No. 4, Article 39. Publication date: October 2017.Optimizing Whole-Page Presentation for Web Search 39:7
if the movie poster is available in the movie vertical, and the number of hits for the news
articles from the news vertical in the last few hours.
4.1.2 Presentation Features. Presentation features encode the way in which search results are
displayed on SERP, which are novel features in our framework. Concrete examples include:
• Binary indicators: whether to show an item on a position. The scheme can encode positions
in a wire-frame, such as a list or multi-column panels. Let there be k positions in the frame,
and k items to be displayed. Let i be the index of items, j be the index of positions, 1 ≤ i, j ≤ k.
The presentation of item i, pi , is a 1-of-k binary encoding vector. If document i is placed
at position j, then the j-th component of pi is 1 and all others are 0. In this case we denote
the value of pi as pi j = 1. The page presentation p⊤ = (p⊤ 1 , · · · , pk ) consists of k × k binary
⊤
indicator variables, essentially encoding the permutation of k objects.
• Categorical features: discrete properties of page items, e.g., multimedia type of an item
(shown as text or image), typeface of a textual item;
• Numerical features: continuous properties of page items, e.g. brightness and contrast of a
graphical item.
• Other features: e.g. certain interactions between page content and presentation may affect
user response, such as “a textual item immediately above a graphical item”.
We use two types of presentation features in real data experiments. We encode positions of items
with binary indicators. For the local search results, we encode presentation size as a categorical
feature (“single” vs. “multiple” entries).
4.2 User Satisfaction Metric
We assume that user satisfaction metric д(y) is in the form of weighted sum of components in y:
д(y) = c⊤ y.
In experiments, we use the click-skip metric for k items [32]:
k
X
д(y) = yi ,
i=1
where yi = 1 if item i is clicked, and yi = −1 if item i is skipped and some item below is clicked.
A skip often indicates wasted inspection, so we set it to be a unit of negative utility. This metric
strongly prefers adjacent clicks at top positions.
4.3 User Response Models
We use two models for predicting page-wise user response. The first model takes as features qua-
dratic interaction between content and presentation. It permits an efficient optimization stage. The
second model uses gradient boosted decision trees to capture more complex, nonlinear interaction
between content and presentation. We expect it to generate improved performance.
4.3.1 Quadratic Feature Model. First, let us consider a simple instantiation of user response
model that has efficient solution in the optimization stage. Since it uses quadratic interaction
features between x and p, we call it Quadratic Feature Model.
Assume there are k positions for k items. Page content x is the concatenation of k item vectors;
page presentation is encoded using binary indicators, p ∈ {0, 1}k×k , as defined in Section 4.1. The
model also contains fully interaction between x and p as features. Let vec(A) denote the row vector
containing all elements in matrix A, taken column by column, left to right. The augmented feature
ACM Transactions on the Web, Vol. 9, No. 4, Article 39. Publication date: October 2017.39:8 Y. Wang et al.
vector ϕ for Quadratic Feature Model is:
ϕ ⊤ = (x⊤ , p⊤ , vec(xp⊤ )).
Let y ∈ Rk be the user response vector; each component yi is a user response (e.g. click or skip)
on item i. A linear model fi is used to predict each yi in y:
yi = fi (ϕ) = wi⊤ϕ = ui⊤ x + vi⊤ p + x⊤ Qi p. (2)
ui , vi , and Qi are coefficients for content-only, presentation-only, and content-presentation qua-
dratic interaction features, respectively. The coefficients wi = {ui , vi , Qi } can be estimated using
regularized linear regression. To avoid overfitting, we regularize the L 2 norm of ui and vi , and
further impose low-rank regularization on Qi to handle the sparsity issue of quadratic features.
In total, we will have k such models, each predicting one yi in y. To group the k models in
notation, let us write coefficients as U = (u1 , · · · , uk ) ⊤ , V = (v1 , · · · , vk ) ⊤ , Q = diag(Q1 , · · · , Qk ),
and “copy” x and p k times to get the matrix X = diag(x⊤ , · · · , x⊤ ) and the vector t⊤ = (p⊤ , · · · , p⊤ ).
To clarify dimensionality, if x ∈ Rn , p ∈ Rm , then U ∈ Rk ×n , V ∈ Rk×m , X ∈ Rk ×nk , Q ∈ Rnk×mk ,
and t ∈ Rmk . The user response model can be written as
y = f (x, p) = Ux + Vp + XQt.
Denote user satisfaction metric as д(y) = c⊤ y. Then the scoring function F = д ◦ f is
F (x, p) = д( f (x, p))
= c⊤ Ux + c⊤ Vp + c⊤ XQt
= c⊤ Ux + a⊤ p (3)
Pk
where a = V⊤ c + i=1 c i Qi⊤ x is a known vector.
To this end, the optimization stage is to find the p that maximizes (3) subject to the constraints
on p. Since page content x is given, the first term in (3) is a constant and can be dropped. The
second term a⊤ p is a linear term of p. Since p ∈ {0, 1}k ×k encodes a k-permutation, Each component
in a ∈ Rk ×k represents the gain of user satisfaction if item i is placed in position j, 1 ≤ i, j ≤ k.
Therefore, the optimization problem reduces to maximum bipartite matching, a special case of linear
assignment problem. It can be efficiently solved by Hungarian algorithm [37] with time complexity
O (|p| 3 ) = O (k 6 ). On a single-core computer with 2GHz CPU, the problem can be solved within 10
milliseconds for k = 50 items.
4.3.2 Gradient Boosted Decision Tree Model. In order to capture more complex, nonlinear
interaction between content x and presentation p, we replace the quadratic feature model fi in
previous section with a gradient boosted decision trees model hiGBDT . Gradient boosted decision
trees (GBDT) is a very effective method for learning nonlinear functions [26].
Our feature vector is
ϕ ⊤ = (x⊤ , p⊤ ),
and each user response yi in y is predicted by a GBDT model:
yi = hiGBDT (x, p).
The user satisfaction metric is д(y) = c⊤ y = ki=1 c i yi .
P
In optimization stage, since each hi is now a nonparametric model, we cannot get the analytical
form of F (x, p) = ki=1 c i hiGBDT (x, p) in terms of p. That is, the optimization over p is intractable.
P
Nevertheless, in realistic settings, the search space of p is usually pruned down to tens of possible
values by business and design constraints. We implement parallel enumeration to quickly find the
optimal presentation that maximizes user satisfaction.
ACM Transactions on the Web, Vol. 9, No. 4, Article 39. Publication date: October 2017.Optimizing Whole-Page Presentation for Web Search 39:9
4.4 Special Case: Learning to Rank
When we restrict page presentation to be a ranked list, and assume that users are more satisfied
if more relevant results are placed at top ranks, then presentation optimization reduces to the
traditional ranking problem. We point out this connection to demonstrate the generality of the
proposed framework.
The instantiation is as follows. We use binary indicators in Section 4.1.2 to represent the ranked
list. Let user response y decompose into k components, each representing the user’s utility of
seeing result i at rank ji . Let user response model f (x, p) decompose into k real-valued component,
each only taking as input xi and its rank ji . So we have
f (x, p) = f (x1 , · · · , xk , p1 , · · · , pk )
= ( f 1 (x1 , p1 ), · · · , fk (xk , pk )) ⊤
⊤
= f 1 (x1 , p1j1 = 1), · · · , fk (xk , pk jk = 1) . (4)
Typically, the ranking function h(xi ) of result i is position-independent. It can also be interpreted
as the score of result i seen on the top rank (ji = 1). That means
h(xi ) = fi (xi , pi1 = 1).
Furthermore, traditional ranking problem assumes that the utility of a result is discounted by
a factor w j if it is ranked at position j. w j > 0 is a decreasing function of j. E.g. in discounted
cumulative gain (DCG),
1
wj = .
log2 (1 + j)
The discounting assumption implies:
fi (xi , pi j = 1) = w j fi (xi , pi1 = 1)
= w j h(xi ). (5)
Combining (4) and (5), user response model is realized as
⊤
f (x, p) = w j1 h(x1 ), · · · , w jk h(xk ) ,
where h(·) is the ranking function. User satisfaction is measured by the quality of ranked list, which
accumulate the gain at each position:
k
X k
X
д(y) = yi = w ji h(xi ).
i=1 i=1
Clearly, maximum user satisfaction д(y) is always achieved by sorting the results by descending
relevance scores. This is the default presentation strategy of learning to rank.
5 SIMULATION STUDY
We demonstrate potential capability of presentation optimization framework by simulation. We
use synthetic dataset so that we know the “ground truth” mechanism to maximize user satisfaction,
and we can easily check whether the algorithm can indeed learn the optimal page presentation to
maximize user satisfaction. We have two goals in this study:
(1) We show that the framework enables general definition of page presentation.
(2) We use both position bias and item-specific bias to show that the framework can automatically
adapt to user interaction habits.
ACM Transactions on the Web, Vol. 9, No. 4, Article 39. Publication date: October 2017.39:10 Y. Wang et al.
5.1 Overview
We first give a brief overview of simulation workflow. The simulated “presentation exploration
bucket” will generate a page containing a set items with random presentation. Every time a new
page is generated, each item is assigned some amount of reward (e.g. relevant information) drawn
from an underlying distribution. The simulated “user” will have a certain type of attention bias: (1)
position bias, in which more attention is paid to certain region of the page than elsewhere (Figure
2a); (2) vertical bias, or item-specific bias, in which more attention is attracted by a specific type of
item and its surrounding area (Figure 2b).
(a) Position bias [50] (b) Vertical bias [63]
Fig. 2. Different types of user attention bias.
An “interaction” happens when the “presentation exploration bucket” generates a page and
the “user” examines it with attention bias. When the user examines an item, she receives the
corresponding reward. User satisfaction towards the page is the sum of rewards. The page content,
presentation, as well as the examined items and positions (user responses), become data that the
framework learns from. Finally, we test if the framework successfully learned user’s attention bias.
Given a new set of items, we expect to see that the framework will place items with higher rewards
to positions with more concentrated attention to achieve maximum user satisfaction. Therefore,
to visualize the model’s current belief in user attention bias, we can plot the distribution of item
rewards on the page.
5.2 Data Generating Process
On the “search engine” side, a page (either 1-D list or 2-D grid) contains k positions. The page
content x = (x 1 , · · · , x k ) ⊤ , x i ∼ N (µ i , σ ) represents intrinsic rewards of k items. We set k = 10 for
1-D list and k = 7 × 7 for 2-D grid. µ i ’s are random numbers drawn from in [0, 1], σ = 0.1. The
page presentation p is drawn from length-k permutations uniformly at random. The whole page is
represented as (x, p).
On the “user” side, attention bias is simulated as follows:
Position bias: whether to examine position j is a Bernoulli random variable with parameter p j .
A real-life example is the top-down position bias, commonly observed when the user interacts with
a ranked list.
Item-specific bias: whether to examine item i is a Bernoulli random variable with parameter
pi . A real-life example is the vertical bias, commonly observed when the user interacts with a page
that contains vertical search results (images, videos, maps, etc).
Then, the “user” will “interact” with the page (x, p): k binary values are drawn from k Bernoulli
distributions, and recorded as a user response vector y ∈ {0, 1}k . if item i is examined, yi = 1, the
user receives a reward x i . The user satisfaction equals the sum of reward of examined items. We
generate 100,000 pages to train the Quadratic Feature Model described in Section 4.3.
ACM Transactions on the Web, Vol. 9, No. 4, Article 39. Publication date: October 2017.Optimizing Whole-Page Presentation for Web Search 39:11
5.3 Results and Discussion
To visualize the learned optimal presentation, we pick a random x and compute the corresponding
optimal presentation p∗ , then arrange the x i ’s according to p∗ . A page is visualized as a heat map
of x i ’s rewards. Ideally, the items with higher reward (“better content”) should be placed onto the
position with higher probability of user attention.
Figure 3, 4, and 5 visualize the presentation results under various position biases. We can see
that the algorithm indeed learns to put “better content” to positions with more user attention.
Because the definition of page presentation is general, it is able to handle both 1-D list and 2-D
1
2
3
grid. Furthermore, it can capture complicated distribution of position bias on a 2-D canvas: the
4
5
6
top-left position bias in Figure 4, and the top-bottom position bias in Figure 5.
7
8
9
1.0
0.5
0.0
(a) Position bias (b) Ideal (c) Learned
presentation presentation
Fig. 3. Top position bias and presentation on 1-D list.
1.0
0.5
0.0
(a) Position bias (b) Ideal (c) Learned
presentation presentation
Fig. 4. Top-left position bias and presentation on 2-D canvas.
1.0
0.5
0.0
(a) Position bias (b) Ideal (c) Learned
presentation presentation
Fig. 5. Two-end position bias and presentation on 2-D canvas.
Figure 6 visualizes the result under item-specific bias. This is an interesting case where an item
on the page is very eye-catchy, and it also attracts user’s attention to its surrounding items (e.g., an
image attracts user’s eyeballs on itself as well as its caption and description text). Also, suppose
that for items farther away from that eye-catchy item, the user’s attention drops further down.
Then the optimal presentation strategy is to place the item on the center of the page, so that the
whole page delivers the most reward. In Figure 6, we see that user satisfaction value r is highest
when the item (the dark red region) is centered on the page.
ACM Transactions on the Web, Vol. 9, No. 4, Article 39. Publication date: October 2017.39:12 Y. Wang et al.
0.9
0.5
0.1
(a) v̂ = 4.07 (b) v̂ = 4.92 (c) v̂ = 5.41
Fig. 6. Item-specific bias. v̂: estimated user satisfaction by the quadratic feature model. When a specific
item (e.g. image) attracts user attention to not only itself but also its surrounding results, then the page-wise
reward is highest when the vertical is placed at the center of the page.
6 REAL DATA EXPERIMENTS
We demonstrate the effectiveness of page presentation optimization framework by conducting
experiments on the real-world data set collected via a commercial search engine.
6.1 Data Collection
We use a very small fraction of search traffic as the presentation exploration buckets. The data was
collected through the year 2013. Vertical search results whose presentation are explored include
news, shopping, and local listings. In the exploration buckets, the order of Web results are kept
untouched and verticals are randomly slotted into allowed positions with uniform probability.
Randomly generated SERPs are not influenced by any ranking algorithm in the system. As pointed
out in Section 3.1, this is required to eliminate page content confounding when training models.
The exploration SERP is then presented to the user who interacts with it in a normal fashion. Users
response on the SERP, along with page-wise content information like the query, document features
from backends, are logged.
6.2 Methods
We use two pointwise ranking models as baseline method. They are trained using the content
features as described in Section 4.1. The first baseline method has been adopted in production
(Logit-Rank) [32]. It estimates a logistic regression model for each vertical result (including web
result):
yi = σ (wi⊤ xi ),
where yi is a binary target variable that indicates whether the result is clicked (yi = +1) or skipped
(yi = −1) as described in Section 4.2, and σ (·) is the sigmoid link function rescaled to [−1, 1].
The second baseline method uses gradient boosted decision trees to learn a pointwise ranking
function (Gbdt-Rank). This is essentially replacing the logistic regressor in Logit-Rank with a
GBDT regressor:
yi = hiGBDT (xi ).
We evaluate the two instantiations of presentation optimization framework described in Section
4.3: the Quadratic Feature Model (Quad-Pres) and the GBDT Model (Gbdt-Pres). They use page-
wise information (x, p) to predict the user response vector, i.e. the vector of clicks and skips.
In implementation, we use Vowpal Wabbit [39] to learn logistic regression models, and XGBoost
[14] to learn the gradient boosted decision tree models. The hyperparameters of the models are
tuned on a small holdout data set.
ACM Transactions on the Web, Vol. 9, No. 4, Article 39. Publication date: October 2017.Optimizing Whole-Page Presentation for Web Search 39:13
Table 1. Match rate between random exploration presentation p and predicted optimal presentation p∗ .
“Until Web1 ” means that p and p∗ encode the same presentation above the 1st webpage result.
Until Web1 Until Web2 Until Web3
Logit-Rank 68.68% 46.76% 30.85%
Quad-Pres 71.63% 50.68% 33.42%
6.3 Evaluation
We use half of the exploration SERP as training set (January – June), the rest as test set. It contains
hundreds of millions of pageviews and was collected from real search traffic. Compared to standard
supervised learning setup, it is difficult to do an unbiased offline performance evaluation because
of the interactive nature of the task (see Section 4.3 in [32]). This is because the offline data
(x (n) , p (n) , y (n) ) is collected using a particular logging policy, so we only observe user response
y (n) for a specific page presentation p (n) . In offline evaluation, when the algorithm is given page
content x (n) , it may output a presentation p∗(n) , p (n) , for which we do not observe user response,
hence cannot evaluate its goodness. To address this problem, we use an offline policy evaluation
method proposed by Li et al. [40] for evaluating online recommendation systems. It is simple
to implement and provides an unbiased performance estimate, thanks to data collected through
random exploration. Given a stream of events (x (n) , p (n) , Pr(p (n) ), y (n) ) collected through random
exploration, where Pr(p (n) ) is the probability for the SERP (x (n) , p (n) ) to be generated from uniform
random exploration, the average user satisfaction for N offline events can be computed as
N (n)
1 X д(y )1 {p∗(n) ==p(n) }
s̄ = ,
N n=1 Pr(p (n) )
where 1 {·} is the indicator function, and д(y (n) ) is user satisfaction towards SERP n. This means
the algorithm is evaluated on those exploration SERPs whose presentation matches what is chosen
by the algorithm; otherwise the SERP is discarded in offline evaluation.
As the match goes deeper down the page, the match rate decreases (Table 1). If we require exact
match between predicted p∗(n) and actual p (n) , a large fraction of test set will be discarded and the
performance estimates tend to have large variance hence unreliable. Our evaluation only focuses on
vertical results shown above the first, second, and third webpage result. Note that the first webpage
result is not always on top rank; the top rank is frequently occupied by the vertical results.
6.4 Results and Discussion
Table 2 shows the average page-wise user satisfaction. It is encouraging to see that whole-page
optimization methods outperform ranking methods, because ranking methods utilize probability
ranking principle to rank results by relevance, which assumes a top-down position bias. Quad-Pres
and Gbdt-Pres do not make this assumption, but learns its own result presentation principle purely
from data. The reason that GBDT models work better than logistic regression models, mainly
because logistic regression assumes linear decision boundary, while GBDT is capable of modeling
nonlinear decision boundary.
Note that in our definition of user satisfaction metric д(y), a skip causes negative utility (yi = −1).
The fact that Quad-Pres and Gbdt-Pres generally work better than the baseline methods is because
they take into consideration the retrieved items, the page presentation, and their interaction on the
entire SERP, not just a single result. The presentation-blind models Logit-Rank and Gbdt-Rank
always want to put on top the results that will most probably gets clicked. However, for certain
queries people might intentionally skip the graphical results (e.g., when shopping ads are shown
ACM Transactions on the Web, Vol. 9, No. 4, Article 39. Publication date: October 2017.39:14 Y. Wang et al.
Table 2. Average user satisfaction (×10−3 ).
Until Web1 Until Web2 Until Web3
Logit-Rank -0.25 1.79 1.89
Gbdt-Rank 2.18 3.68 2.22
Quad-Pres 0.62 6.39 5.37
Gbdt-Pres 2.68 6.72 8.24
but the search intent is in fact informational). In such cases, a click tends to happen below the top
rank. In contrast, presentation optimization methods will consider both the result and its position
on the page. That leads to more sensible arrangement of results. We see that Gbdt-Pres attracts
more clicks and has less skips when we evaluate deeper down the SERP.
Table 3. CTR, match until Web1
News Shopping S. Local M. Local
Coverage 0.46% 0.02% 0.02% 0.71%
Logit-Rank 21.05% 40.79% 11.58% 30.02%
Gbdt-Rank 23.28% 53.32% 38.26% 52.27%
Quad-Pres 21.97% 49.85% 47.16% 39.93%
Gbdt-Pres 22.34% 46.15% 48.12% 49.18%
Table 4. CTR, match until Web2
News Shopping S. Local M. Local
Coverage 2.0% 0.11% 0.03% 2.3%
Logit-Rank 16.44% 23.71% 18.51% 8.92%
Gbdt-Rank 16.31% 30.39% 36.73% 23.11%
Quad-Pres 14.78% 13.57% 23.39% 27.53%
Gbdt-Pres 16.21% 40.83% 33.18% 35.23%
Table 5. CTR, match until Web3
News Shopping S. Local M. Local
Coverage 3.8% 0.18% 0.11% 3.4%
Logit-Rank 14.52% 21.48% 13.80% 9.65%
Gbdt-Rank 12.51% 42.96% 24.93% 22.42%
Quad-Pres 11.45% 12.88% 15.47% 24.38%
Gbdt-Pres 14.11% 36.00% 24.72% 30.66%
Table 3, 4, and 5 shows the click-through rate (CTR) above Web1 , Web2 , and Web3 , respectively.
“S. Local” means a single entry of local business result (such as restaurants); “M. Local” means
multiple entries of local business results. They are the same vertical/genre results presented in
different sizes. In terms of CTR, ranking methods have very strong performance because they
are directly optimized for high CTR. However, whole-page optimization methods still achieve
competitive or sometimes better CTR by taking into account page-wise information.
ACM Transactions on the Web, Vol. 9, No. 4, Article 39. Publication date: October 2017.Optimizing Whole-Page Presentation for Web Search 39:15
It is interesting to see that for News vertical, there is not much help to know about other results
on the SERP, neither their presentation. In contrast, knowing page-wise results helps improve the
CTR of top-ranked local listings by a large margin. A possible explanation is that news, more like
general webpages, contain rich text information and their content relevance can be readily modeled
by standard ranking functions. On the other hand, local listings are in drastically different nature
compared to webpages and news, therefore knowing the complementary information from other
webpage results helps predicting the click/skip patterns. We can also observe small improvements
in CTR of the shopping results. Since the shopping results shown on the top are most likely to be
skipped, the algorithm learns to become extremely conservative in showing shopping verticals on
top. This leads to a much smaller coverage of shopping results in the entire traffic.
As the match goes deeper down the page, the local ranking algorithms show decreased per-
formance in terms of CTR. This is because the local ranking methods tend to greedily put the
high CTR items on top of the page, but ignores the content on the entire page. In contrast, the
page presentation algorithms, especially Gbdt-Pres, still get good CTR on News and Multi-local
verticals, which takes larger coverage. This is attributed to the fact that they model user response
over the entire page.
Figure 7 shows a real case where Gbdt-Pres disagreed with Gbdt-Rank (the algorithm then used
in production) in serving a local search query. In this case, the user was searching for “drinks near
Columbus circle”. At the time of this study, the Yahoo search engine ranked local vertical results
on the top, as shown in the screenshot. Columbus circle is a place in Manhattan, New York. The
two vertical results, however, were not in Manhattan: one is in Brooklyn, New York, and the other
is in the State of Connecticut. Our algorithm Gbdt-Pres recommended to put the webpage result
on top, which was indeed more relevant than the local listings. The page presentation algorithm
made a better decision here because it was able to consider all candidate results on the SERP and
weigh the benefits and risks of putting one on top of others.
recommended by GBDT-PRES
Fig. 7. Screenshot of the Yahoo search result page for the query “drinks near Columbus circle”. Accessed
early February, 2016. The two local listings did not satisfy the information need. Our algorithm Gbdt-Pres
recommended that the webpage result should be ranked on top of local listings.
ACM Transactions on the Web, Vol. 9, No. 4, Article 39. Publication date: October 2017.39:16 Y. Wang et al.
7 RUNTIME-EFFICIENT PAGE PRESENTATION POLICY
In this section, we provide a new perspective on the problem of page presentation optimization
through the lens of reinforcement learning. We show that the proposed approach in Section 3
is actually one of several possibilities for solving a reinforcement learning problem. Based on
the new formulation, we provide a policy learning approach that solves the same problem and
enjoys runtime efficiency. Finally, we demonstrate the effectiveness of the new approach through
simulation experiments.
7.1 Reinforcement Learning Formulation
We briefly introduce the general reinforcement learning setup, and then recast page presentation
optimization as a reinforcement learning problem.
In a general reinforcement learning setup, an agent acts in a stochastic environment by
sequentially choosing actions over a sequence of time steps, in order to maximize a cumulative
reward. It is formulated as a Markov decision process (MDP) with the following concepts.
(1) A state space S.
(2) An action space A.
(3) An initial state distribution p(s 0 ), and a state transition dynamics distribution p(st +1 |st , at )
satisfying the Markov property p(st +1 |s 0 , a 0 , · · · , st , at ) = p(st +1 |st , at ).
(4) A reward function r : S × A → R.
(5) A policy selects actions in a given state: πθ : S → P (A), where P (A) is the set of probability
measures on A and θ ∈ Rm is a vector of m parameters. πθ (a|s) is the probability of taking
action a in state s. A deterministic policy is a special case where an action a satisfies πθ (a|s) = 1
in any state s.
(6) The agent uses its policy to interact with the MDP to give a trajectory of states, actions, and
rewards, h 0:T = s 0 , a 0 , r 0 , · · · , sT , aT , rT over S × A × R. The cumulative discounted reward,
or the return, is Rγ = t∞=0 γ t r (st , at ), where the discount factor γ ∈ [0, 1] determines the
P
present value of future rewards.
(7) The action-value function Q π (s, a) = E Rγ |s 0 = s, a 0 = a; π is the expected return of taking
f g
f g
action a in state s and then following policy π . Q ∗ (s, a) = maxπ E Rγ |s 0 = s, a 0 = a; π is
the optimal action-value function.
(8) The agent’sf goal g is to obtain a policy π which maximizes the expected return, denoted as
J (π ) = E Rγ |π .
In page presentation optimization, the agent is the algorithm that determines the presentation
of page content on a SERP for each incoming search query. Referring to the concepts and notations
in Section 2:
(1) The page content x of a query is the state, and the state space is X.
(2) The page presentation p is an action, and the action space is P.
(3) The initial state distribution p(x) is determined by the query distribution. As we do not model
sequential interactions between the search engine and the user, there is no state transition
dynamics.
(4) The reward function is the user satisfaction v on a given SERP, which we estimate by the
scoring function v = F (x, p). Each point in the state-action space X × P is a SERP.
(5) A policy selects a presentation strategy p given page content x. This is the page presentation
optimization problem we formulated in (1).
(6) Since there is no state transition, the return Rγ = v, the discount factor γ = 0, and the
effective time horizon T = 0.
ACM Transactions on the Web, Vol. 9, No. 4, Article 39. Publication date: October 2017.Optimizing Whole-Page Presentation for Web Search 39:17
(7) Since the policy does not take effect after the initial time step, the action-value function is
equal to the reward function, Q π (s, a) = F (x, p),
f ∀π . Hence F (x, p) g = Q (s, a).
∗
(8) The expected return J (π ) = E [v |π ] = Ex∼p (x) Ep∼π (p |x) [F (x, p)] is the average user satis-
faction that the agent aims to maximize (the measurements in Table 2).
Therefore, the problem of page presentation optimization can be viewed as a reinforcement
learning problem. The approach in Section 3 is in fact a Q-learning method. It first learns the
optimal action-value function (in our case it coincides with the reward function/scoring function)
F (x, p) through supervised learning on exploration data. Then it derives a deterministic policy
by choosing the action that maximizes the optimal action-value function: π (p|x) = 1 if p solves
maxp∈ P F (x, p), and π (p|x) = 0 otherwise.
A major drawback of this approach, as we have seen, is that it has to solve a combinatorial
optimization problem for each query at runtime, which could become intractable for complex
functional forms of F (·, ·). Fortunately, recasting the problem in reinforcement learning sheds new
lights on runtime-efficient solutions. Below we describe policy learning as one such solution.
7.2 Policy Learning for Page Presentation
We seek for a new page presentation algorithm that is (1) efficient at runtime, (2) sufficiently
expressive, i.e. capable of capturing sophisticated interactions between items on a page, and (3)
trained offline using data collected through the exploration buckets. These requirements are critical
for Web-scale online applications, because (1) runtime efficiency directly affects user experience,
(2) different items may have dependencies when they are laid out on a SERP, and (3) updating the
search algorithm offline reduces the risk of undesirable exploration behaviors.
A policy-based agent meets all the above requirements. The agent learns a policy πθ (a|s) rather
than a value function through experience. At runtime, it samples an action a from πθ (a|s) given
state s, without performing optimization in the action space. In reinforcement learning scenarios
where the action space is high-dimensional or continuous, policy-based agent is often employed.
In our problem setting, the agent learns a policy πθ (p|x) from the exploration data. For a search
presentation policy, it is more desirable to be deterministic than stochastic, because search engine
users would prefer the search service to be predictable and reliable. We can write a deterministic
policy as p = πθ (x). At runtime, given page content x, the policy outputs a page presentation p
that renders the content onto the page. To capture complex interactions between page contents,
πθ (·) can take nonlinear functional forms.
Now we describe the design and training of the presentation policy.
7.2.1 Policy function design. The policy πθ takes page content vector as the input and gives a
presentation vector as the output. The output vector should encode a permutation of k items in
x⊤ = (x⊤ 1 , · · · , xk ), along with other categorical and numerical properties (e.g. image sizes, font
⊤
types). Instead of asking πθ to directly output a k-permutation as a vector of k × k binary indicators
(as in Section 4.1.2), we consider functions that implicitly outputs a k-permutation. At least two
approaches can be considered:
(1) Generalized ranking approach: πθ outputs a sorting score for each item, which defines an
order to arrange k items into k positions.
(2) Generalized sequence-to-sequence approach: πθ outputs a matching score for each item-
position pair, which entails a bipartite matching between k items and k positions.
Note that in both approaches, the k positions can take arbitrary layout, not restricted to a one-
dimensional list. Both approaches are viable if πθ jointly considers all items and their dependencies.
ACM Transactions on the Web, Vol. 9, No. 4, Article 39. Publication date: October 2017.39:18 Y. Wang et al.
In this paper, we consider the generalized ranking approach. We will explore the generalized
sequence-to-sequence approach in our future work.
In the generalized ranking approach, each item i will have a sorting score fθ (H xi ). The sorting
scores are produced by the same function fθ . The feature vector H xi is different for each item i and
contains the entire page content feature x. This can be achieved by prepending the dimensions
of item i to the front of x and then setting the original dimensions of item i to zero. That is,
xi⊤ = (xi⊤ , x⊤
H 1 , · · · , xi−1 , 0 , xi+1 , · · · , xk ), for i = 1, · · · , k. This allows the function f θ to consider
⊤ ⊤ ⊤ ⊤ ⊤
the entire page content but output a different score for each item. To capture complex interactions
between items, each fθ is a LambdaMART model (i.e. GBDT model) [11].
7.2.2 Policy training. There are multiple ways to train a policy in an offline fashion, including
model-based methods [59] and off-policy actor-critic methods [20, 58]. Here we use a model-based
method, which requires the reward function and the state transition dynamics to be learned first.
In our setting, the reward function is the scoring function F (x, p), and there is no state transition.
So we take two steps to train the policy πθ :
(1) Learn the scoring function F (x, p) from exploration data, as in Section 3.2;
(2) Train the policy πθ by maximizing the expected return J (πθ ) = Ex∼p (x) [F (x, πθ (x))].
Note that neither Step (1) or (2) involves the optimization step maxp∈ P F (x, p). This is important as
it allows us to choose complex functional forms for both F and π to capture intricate dependencies
among page items3 .
In reinforcement learning literature, the policy is usually trained by following the policy gradient
[60]. That is, πθ can be gradually improved by moving θ along ∇θ J . It is non-trivial to compute ∇θ J
for deterministic policies [58], as is the case in our setting. Below we employ the idea of λ-gradients
in LambdaMART to optimize the policy.
Since our policy πθ generates a permutation by sorting, we can view F (x, πθ (x)) as a type of
“listwise objective”. Indeed, x contains k items and p = πθ (x) defines a permutation of them, though
the layout may not be a “list”. The difference between F (x, πθ (x)) and conventional listwise IR
measures, such as NDCG and MAP, is that NDCG and MAP are based on per-item relevance
judgments assigned by humans, while F (x, πθ (x)) is automatically learned from data. Optimizing
J (πθ ) translates to optimizing the listwise objective F (x, πθ (x)). The listwise learning-to-rank
method LambdaMART is well-suited in this scenario as it is empirically proven to optimize a wide
range of IR measures [11, 24].
LambdaMART uses a succession of regression trees, each estimating the λ’s. For a query q, λi ∈ R
is a number assigned to a document di which indicates how much its current sorting score ui
needs to be changed to improve the NDCG of the ranked list retrieved by q. Therefore the λ’s are
the gradients of NDCG with respect to the sorting scores. They are computed by swapping two
documents di and d j in the predicted ranking, and then observing the change in NDCG [11]:
−σ
λi j = ∆NDCGi j ,
1 + exp σ (ui − u j )
X X
λi = λi j − λi j ,
j:r el (i ) ≻r el (j ) j:r el (i ) ≺r el (j )
where ∆NDCGi j is the change in NDCG after swapping di and d j in the predicted ranking, and
rel (i) is the relevance grade of document di for query q. σ > 0 is a scaling hyperparameter.
3 Unlike the Q -learning approach, now we do not need to decode p as a page presentation strategy from F (x, p). So F (x, p)
can take any feature derived from x and p as input.
ACM Transactions on the Web, Vol. 9, No. 4, Article 39. Publication date: October 2017.You can also read