One Size Does Not Fit All: Detecting Attention in Children with Autism Using Machine Learning
←
→
Page content transcription
If your browser does not render page correctly, please read the page content below
One Size Does Not Fit All: Detecting Attention in
Children with Autism Using Machine Learning
Bilikis Banire ( banire.bilikis.o@gmail.com )
Hamad Bin Khalifa University
Dena Al Thani
Hamad Bin Khalifa University
Marwa Qaraqe
Hamad Bin Khalifa University
Research Article
Keywords: Attention, Autism, Face-tracking, Eye-tracking, Machine learning
Posted Date: May 9th, 2022
DOI: https://doi.org/10.21203/rs.3.rs-1604663/v1
License: This work is licensed under a Creative Commons Attribution 4.0 International License.
Read Full License
Page 1/32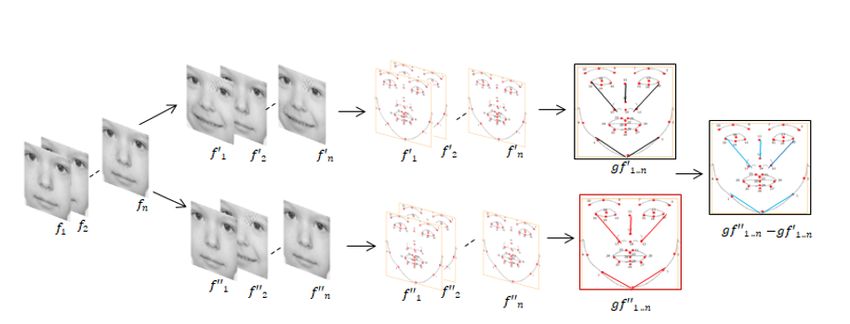
Abstract
Detecting the attention of children with autism spectrum disorder (ASD) is of paramount importance for
desired learning outcome. Teachers often use subjective methods to assess the attention of children with
ASD, and this approach is tedious and inefficient due to disparate attentional behavior in ASD. This study
explores the attentional behavior of children with ASD and the control group: typically developing (TD)
children, by leveraging machine learning and unobtrusive technologies such as webcams and eye-
tracking devices to detect attention objectively. Person-specific and generalized machine models for face-
based, gaze-based, and hybrid-based (face and gaze) are proposed in this paper. The performances of
these three models were compared, and the gaze-based model outperformed the others. Also, the person-
specific model achieves higher predictive power than the generalized model for the ASD group. These
findings stress the direction of model design from traditional one-size-fits-all models to personalized
models.

1. Introduction
Autism spectrum disorder (ASD) is a neurodevelopmental disorder characterized by a deficit in social
communication and repetitive behavior (American Psychiatric Association, 2013). Attentional deficit is
one of the conspicuous deficits of ASD, hence, children with ASD require extra attentional support during
learning. Teachers commonly use subjective attentional assessment to monitor the learning progress of
their students. The subjective approach is tedious, time-consuming, and requires a long year of
experience as a child with ASD exhibits unique attentional behavior [1]. For example, a child with ASD
may prefer to look at stimuli and listens simultaneously while another child may choose to look at the
stimuli and not listen. It is, therefore, challenging for teachers to manage both the learning content and
the diverse attentional behavior of their students concurrently. Research has shown that there is a lack of
resources and experienced teachers for children with ASD due to the increased rate of ASD prevalence in
the United States of America, as reported by the Center for Disease Control and Prevention (CDC) [2], The
increase in ASD population is not limited to the USA alone but globally including Qatar, the country y of
the current study [3]. The experience and feelings of families and friends who have children with ASD
show that the children require a great deal of educational and social support from teachers, parents,
siblings, relatives, and friends [4]. Sometimes, the support needed by children with ASD spans from
childhood to adulthood, which is usually overwhelming and psychologically challenging [5]. Hence,
understanding how stakeholders can benefit from objective attention assessment of children with ASD
can support them in managing their learning experience effectively.

Parents do agree that attention impairment is the root cause of the core deficits in children with ASD [6].
Thus, attention assessment becomes a primary and essential step in designing any form of learning
intervention for children with ASD. Existing technological interventions for children with ASD often focus
on using technology to gain the attention of children with ASD to improve core ASD impairments, such as
social and communication skills [7]. While some studies have assessed the attention of children with
ASD using these interventions, very few studies, have explored how technology can be utilized in
                                                  Page 2/32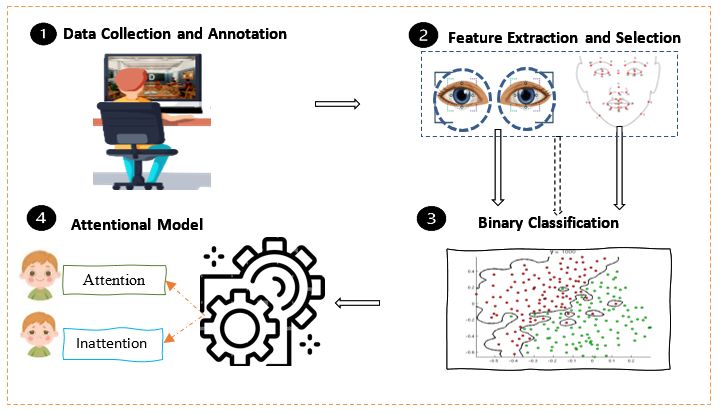
assessing attention objectively. The advent of sensing technologies and machine learning has enhanced
intelligent systems that monitor and respond to human behaviour. An intelligent system using a machine
learning algorithm is being applied by experts in different domains like education [8], transportation [9],
and healthcare [10]. The development of a machine learning model for detecting the attention of children
with ASD is still in infancy because of the difficulty in their generalizing attentional behaviors [11].

Machine learning methods have revolutionized many research fields such that they are capable of
automatically detecting human behavior based on extracted features describing their reaction [12]. It is
evident from previous research that attentional behaviour of typically developing (TD) population can be
measured using multiple behavioral data such as physiological behaviours including brain signals and
heart rate [13], brain signals, body movement and heart rate [14], facial expression and eye gaze [15] to
train a machine learning model. The objective of combining different attentional behaviour is to compare
the performance of a hybrid method to individual methods of measuring attention. However, the
assessment of attention in children with ASD is often done subjectively using video data analysis where
researchers code frames of recorded activity sessions as attention or inattention [6, 16–18], while very
few studies used automated attention detection using a computer vision algorithm to capture facial
movement [19] and machine learning model built with eye-tracking data as a biomaker of detecting
autism rather than detecting their attention [20]. These studies show the potential of facial and eye-
tracking features for behavioral assessment. However, to the best of our knowledge, no study has
investigated the performance of facial and eye-tracking features for developing a machine learning
model capable of detecting the attention of children with ASD.

In this paper, a novel machine learning model for detecting the attention of children with ASD using facial
and eye-tracking features is proposed. Also, the performance of individual channels and hybrid channels
are compared to identify the prominent features for detecting attention in children with ASD. Lastly, the
machine learning models using these two channels are compared in children with ASD and TD children.
The main contributions of this paper are as follows:

    Identification of prominent gaze and facial features for attention recognition.
    Comparison of three attentional models: face-based, gazed-based and hybrid-based for detecting
    attention of children with ASD.
    The performance of attentional model types in children with ASD and TD, where the heterogeneity in
    ASD plays a major role in developing machine learning models.

The structure of this paper is as follows: Section 2 describes the works that have been done to detect
attention in children with ASD. Section 3 describes the methodology that has been used in this paper. The
experimental results are discussed in Section 4, and Section 5 presents the discussion and the direction
of future work. Lastly, section 6 summarizes the findings of the paper and Section 6 presents the
limitation of this study. Lastly, section 7 summarizes the findings of the paper.

2. Related Works
                                                   Page 3/32
This section describes machine learning and its application in attention detection also referred to
attentional model in this paper. The attentional model leverages machine learning to predict attentional
behavior of students. Researchers support that attentional model can be developed using different
physiological behaviors (multimodal methods) such as brain signals and heart rate [13] brain signals,
body movement, and heart rate [14]; and facial expression and eye gaze [15] while other studies use only
one physiological behavior (unimodal) such as brain signals [21, 22]. The objective of combining
different physiological behavior is to compare the performance of a using unimodal and multimodal-
based models for purpose of identifying a better approach for attention detection tasks.
2.1 Machine Learning Algorithms
Machine learning is a technique of building a system that learns from a set of data to gain experience,
enhancing its performance in predicting and classifying a new collection of similar data [23]. Machine
learning is also defined as artificial intelligence that mimics human reasoning in solving cognitive tasks
[24]. One of the commonly used open-source software for building a machine learning model is Scikit-
Learn [25]. This software provides machine learning libraries for Python programming language. It
features various classification, regression, and clustering algorithms. Machine learning can be
categorized into three main methods: supervised, unsupervised, and reinforcement learning [23]. The
supervised learning method builds a model from labeled data to enhance the performance of model
prediction of new data. In contrast with supervised learning, the output label of each record in a dataset is
not known. Reinforcement learning applies a computational method to learn from interactions that
include reward feedback to predict new outputs (Sutton & Barto, 2018). This study applies supervised
learning method using classifier algorithms that learn attentional behavior as variables input (x) and
attention classification as an output (y) variable to predict an unknown behavior during learning.
Classifying problems can either be binary or multinomial. The binary classification has one or two
classes, and multinomial classification has a classifying instance of more than two classes. Some of the
classifying algorithms are Support Vector Machines (SVM) which maximize the margin between training
data of two different classes separated by a hyperplane (decision boundary) [26]. Random Forest (RF) is
another form of classifier algorithm that applies decision trees where each tree node predicts the output
of the testing variables based on the labeled training data. [27]. Also, K Nearest Neighbor (KNN) is a type
of classifier algorithm that utilizes instance-based learning, where the features of the training data are
assigned a k-sample and the testing data is predicted based on the k-nearest neighbor rule [28]. Similarly,
Logistic Regression (LR) algorithm uses the probability method to classify categorical data in binary or
multinomial classification. In addition, the Classification and Regression Tree (CART) algorithm combines
classification and regression trees. to predict certain categorical variables [29] using specific rules to best
split samples based on the dependent variable. Lastly, Gradient Boosting Classifier (GBC) algorithm was
used for regression and classification problems using a similar approach in other decision tree
approaches [30]. It predicts samples using an ensemble of weak prediction values to form a strong
learner iteratively. It builds the model with a loss function approach in a stepwise manner.
Page 4/32The performance of machine learning models is critical before adoption into a real intelligent system and
there are different types of metrics depending on the output variables. The metrics that are relevant to the
classification problem are Receiver Operating Characteristic (ROC) Curve and the Confusion Matrix, which
can also be used for estimating other metrics such as accuracy, precision, recall, and F1-score. Accuracy
is a metric that evaluates how often the model classifies samples correctly by estimating the number of
correct predictions and the total number of predictions. Precision measures the rate at which the
predicted positives are correctly classified. Recall estimates the fraction of the total amount of positive
samples that were correctly classified for the number of misclassified samples, and F1-Score combines
precision and recall using their harmonic mean. Accuracy is a commonly used metric for evaluating
model performance; however, it can be misleading for imbalanced data sets. A better choice is the F1-
score which uses the interpretation of a weighted average of the precision and recall values [31], or AUC
(area under the receiver operating characteristic curve), which describes the sensitivity of a classifier
using a graph plot of true-positive rate to false-positive rate.
2.2 Unimodal Attentional Model
The unimodal attentional model applies a single channel of physiological behaviour to annotate
attention. Bosch, et al. [32] apply facial features using appearance-based methods and body posture to
detect learners’ engagement. The authors gave 137 students in 8th and 9th grade an educational game
about physics and coded the actions of the participants for on-task and off-task behaviors. The findings
from their study show that the model performance using the AUC for off-task detection was above
chance i.e., greater than 0.5 for a generalized model (AUC = 0.816). Additionally, the authors found that
the face-based model could generalize across temporal, ethnicity and gender.
Similarly, [33] used the appearance-based method on facial features to recognize students’ engagement.
The students played a cognitive skills training software, and a Logitech web camera was used to record
the entire session. The authors used a team of labelers consisting of undergraduate and graduate
students from computer science, cognitive science, and psychology. These labelers viewed the recorded
videos and labeled the learner's facial appearance from 34 participants into four levels of engagement:
not engaged, nominally engaged, engaged, and very engaged. The findings in this study revealed that the
SVM classifier had the highest performance score among the classifiers for the generalized model (AUC =
0.729). The authors evaluated how a face-based model generalizes across demographic factors, such as
ethnicity. The model was trained with Caucasian and Asian-American populations and tested on an
African American dataset. They found that the model generalized across ethnicity, and the prediction
were above chance (AUC = 0.691).
Aside from facial features, other studies have used eye-tracking features to predict attentional-related
behaviors. Bixler and D’Mello [34] used a classification approach to predict mind wandering in a reading
task among college students. This study used fixation, saccade, and pupil diameter features with four
different algorithm classifiers. The best classifier algorithm was SVM with 74% accuracy. Lallé, et al. [35]
developed a gaze-based classification model to predict confusion during interactions with a visualization
task. The study used gaze patterns, pupil size, and head distance as measurements. The authors
Page 5/32achieved an accuracy of 61% using the RF classifier algorithm. They identified variations in user pupil
size and head distance as good predictors of attentional state. Chen, et al. [36] examined the states of
attention and inattention of 15 participants during mathematics, continuous performance tasks (CPT),
and reading tasks using SVM classifier algorithms. The gaze-based attentional model used achieved
93.1% accuracy. Finally, Shojaeizadeh, et al. [37] predicted task demand in a visualization task using the
RF classifier algorithm using the eye-tracking features such as fixations, saccades, blinks, and pupillary
responses. This study achieved an accuracy of 79%, with pupillary responses being the best task
predicting feature.
2.3 Multimodal Attentional Model
In multimodal attentional models, two or more sensors are used to record behavioral measures during
attention tasks. Asteriadis, et al. [38] investigated facial and head poses using a webcam to predict the
attentive and frustrated state of learners. This study applied the fuzzy rule classification method and
achieved an accuracy of 80–88%. In 2010, D’mello & Graesser utilized a multimodal method of
engagement recognition and applied it to facial features, body posture, and communication clues. [39].
Through the model evaluations using kappa scores, it was determined that a two-model combination
performs similarly to a three-model method.
Another study on multimodal methods exploited facial features and interaction data to predict
engagement and frustration. The authors used a multilayer perceptron (MLP) and achieved an accuracy
of 78% [40]. A similar study by [41] utilized facial features and heart rate to detect engagement. This
study applied RF and achieved a prediction power above the chance level (AUC = 0.758). The study by
[36] used SVM to train head pose and eye movement from 10 participants to develop an attention
recognition model. The accuracy achieved in this study was 93.1%. Another multimodal model study
used SVM to develop an engagement recognition system and achieved 85% accuracy [15]. The hybrid-
based model in our research is based on multimodal methods used in the reviewed studies.
2.4 Our Approach
Related work on the single and multiple attentional models indicates that both methods have the
potential to differentiate attention and inattention. However, the multimodal attentional model has a
better advantage over the unimodal methods as it relies on multiple attentional behaviors. It is also
important to mention that the related work relied on the subjective labelling of students’ attentional
behaviors who do not have the neurocognitive disorder. One of the drawbacks of the subjective method
of labelling attention is inconsistency due to differences in the background experiences of the experts [42]
and ambiguity [43], especially in children with ASD who exhibit unique attentional behavior. However,
combining observable attentional behavior with cognitive processing assessments such as performance
scores can reduce the ambiguity of annotating attentional behavior in children with ASD. Additionally, the
generalizability of the model across demographic information was also explored to evaluate the
robustness of the attentional model. The generalizability of the behavioral-based attentional model
across groups of children with ASD, TD, and attention task types is worth investigating.
Page 6/32Thus, this current study proposes a behavioral-based attentional model using a bimodal approach: face
and gaze-based models for children with ASD. The performance of each model type will be evaluated and
compared. The model comparison can inform the direction of future studies on prominent attentional
behavior in children with ASD. Towards the goal of this study, three major research questions are
proposed: 1) Is the attentional unimodal sufficient for detecting attention in children with ASD? 2) what
are the prominent facial and eye-gaze features for detecting attention? 3) What differentiates the
attention model of children with ASD from TD?
3. Methodology
The framework of the hybrid-based model for attention recognition used in this study is shown in Fig. 1. It
consists of the face and eye-tracking data extracted from the video frames captured during the
experiment. We utilized the geometric distance between 34 facial landmarks and exploited the eye-
tracking data of children with ASD for feature extraction. The features were fed into the SVM algorithm to
predict attention and inattention. Using four significant steps depicted in Fig. 1, three attentional models:
face-based, gaze-based, and hybrid-based (face and gaze), were developed to classify attention and
inattention in both children with ASD and TD. In the first step, a series of attention task experiments was
conducted to collect and annotate facial and eye-tracking data that describes attention. In the second
step, feature extraction and selections were carried out to identify prominent features for training the
attentional models. In the third step, the selected facial and gaze features were fed separately and
combined into a binary classifier to train three types of attentional models: face-based, gaze-based, and
hybrid-based. The six binary classifiers considered in this study are: SVM, RF, KNN, LR, CART and GBC.
Lastly, the three attentional models developed: face-based, gaze-based, and hybrid-based, were evaluated
and compared to identify the best attentional model for children with ASD as well as its robustness for
generalizing it across the autism spectrum. Also, the model for ASD and TD were compared.
3.1 Data Collection and Annotation
To collect facial and eye-tracking data describing attentional behavior, an experiment was conducted with
children with both ASD and TD where they took a series of attention tasks. Prior to the experiment,
approval was obtained from the institutional review board committee of the Qatar Biomedical Research
Institute-Institutional Review Board approval. A total of forty-six children between the age of seven and
eleven years participated in the study. Twenty children with ASD (ASD n = 20, M = 8.57, SD = 1.40) and
twenty-six TD children from the same age range (TD n = 26, M = 8.58, SD = 1.36). The ASD group had
sixteen boys and four girls with mild to moderate ASD, while the TD group had eighteen boys and eight
girls, as shown in Table 1. The ASD participants were recruited through a local autism school in Doha and
from known families residing in Qatar. All the ASD participants were clinically diagnosed by medical
practitioners using the DSM IV-TR criteria [51]. The TD participants were recruited from mainstream
schools. All the parents of the participants read and signed an informed consent form to allow their
children to participate in the study. Further experimental validation steps we took to achieve high data
quality were to prevent the participants from eating or drinking during the experiment. The experiment
Page 7/32was conducted in a quiet and dimly lit room to avoid distraction and reduce illumination, which may
affect the eye-tracking sensor.
The attention tasks adopted in this study were based on the context of CPT [44]. The CPT test is a
computer-based assessment that presents stimuli to test users in a repetitive and boring pattern to
measure how long they can maintain their attention. The CPT attention tasks were simulated in a virtual
classroom with distractions to represent a naturalistic learning environment [45, 46]. The target stimuli for
the tasks are represented with random alphabets displayed on the board. The tasks had four levels of
distractions: level 1 - baseline (no distractions), level 2 - minimal, level 3 - medium, and level 4 - extensive.
The higher the level, the more the distractions. The distractions used include students raising hands,
coughing, chatting, and dropping books. The essence of introducing distractions is to capture robust
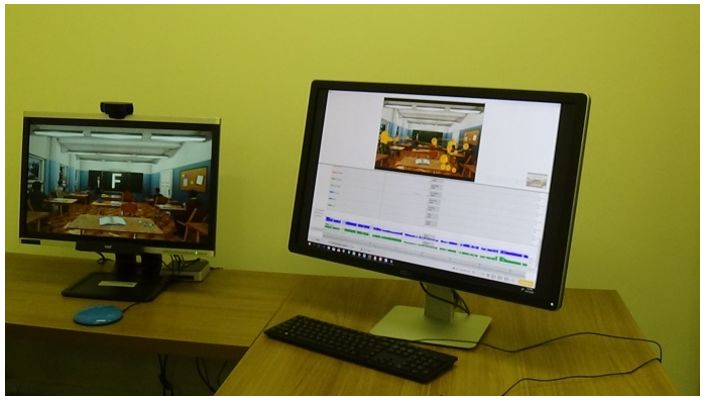
attentional behavior in different learning scenarios. The participants were instructed to press a clicker on
the table when the target letter appears, and their facial and eye movements were captured in real-time
with a Logitech C920 webcam attached to the top of the smaller screen in Fig. 2, and an eye-tracking
device was placed at the base of the same screen. The real-time data capturing was monitored and
recorded by the researcher on the bigger monitor.
After each participant completed all the attention tasks (levels 1 to 4), the recorded session for each level
was divided into separate time slots for annotation. Each time slot consists of a random letter displayed
for the duration of 1400ms. To annotate the video, each slot was labeled as attention for valid response
(letter X) or inattention for invalid response (missed letter X). In the ASD group, 18 out of 20 took all the
attention tasks except for three who did not attempt level 4 as they wanted to end the experiment and 26
TD children completed level 1 of the attention task. Overall, 95 videos of the attention task sessions for
all the participants were annotated and each video length was 5 minutes long.
3.2 Feature Extraction and Selection
This section discusses first, the feature extraction and selection methods for face tracking. Second, the
feature extraction of the eye tracking data is also reported.
3.2.1 Facial Features
In the facial feature extraction, 34 facial landmarks were extracted frame-by-frame from the recorded
session for each participant through the webcam. These facial landmarks cover five regions of the face:
eyes, eyebrows, nose, lips, and jaw, represented as a pool of feature vectors consisting of x and y
i
coordinates represented in Eq. (1). Suppose f n denotes each landmark in the nth video frame, starting
with the ith frame.
Page 8/32(1)
[ ]
i i i i i i
x 0 , y 0x 1 , y 1 ⋯ x 33y 33
i
fn = ⋮ ⋮ ⋯ ⋮
n n n n n n
x 0 , y 0x 1 , y 1 ⋯ x 33y 33
To explore the temporal variation of muscular activity across landmarks, we estimated the lengths of
distances from all pair distances using the Euclidean distance formula in Eq. (2). This method is
common in the literature for exploring differences in posed emotion and neutral face [47–50].
\left[\left({\text{x}}_{1} , {\text{y}}_{1}\right),\left( {\text{x}}_{2} , (2)
{\text{y}}_{2}\right)\right]=\sqrt{{\left( {\text{x}}_{2} – {\text{x}}_{1}\right)}^{2}+ {\left(
{\text{y}}_{2} – {\text{y}}_{1}\right)}^{2} }
where {\text{x}}_{1} , {\text{y}}_{1}and {\text{x}}_{2} , {\text{y}}_{2} are representing two different facial
landmarks. The estimated geometrical information generated was between one landmark to other
landmarks and these sum up to 561 geometric-based features distances. These geometric features were
reduced from 561 to 20 features by applying the feature selection method [51]. Feature selection reduces
training samples to those with the best features while maintaining the efficiency of the model. The
objective of feature selection is to reduce computational costs. In this model, we selected the best
features from the 561 pair distances. Data samples were standardized to ensure comparable data
sample range. This standandarization is achieved as follows (Eq. 2).
\text{Z}= \frac{{x}_{i}-\text{mean}\left(x\right)}{\text{stdev}\left(\text{x}\right)} (2)
Where Z is the standardized score, and stdev is the standard deviation of the data samples. In particular,
the standardization subtracts the mean value of the samples and divides their value by the standard
deviation.
0-Right Top Jaw, 1-Right Jaw Angle, 2-Gnathion, 3-Left Jaw Angle, 4-Left Top Jaw, 5-Outer Right Brow, 6-
Right Brow Corner, 7-Inner Right Brow Corner, 8-Inner Left Brow Corner, 9-Left Brow Center, 10-Outer Left
Brow Corner, 11-Nose Root, 12-Nose Tip, 13-Nose Lower Right Boundary, 14-Nose Bottom Boundary, 15-
Nose Lower Left Boundary, 16-Outer Right Eye, 17-Inner Right Eye, 18-Inner Left Eye, 19-Outer Left Eye, 20-
Right Lip Corner, 21-Right Apex Upper Lip, 22-Upper Lip Center, 23-Left Apex Upper Lip, 24-Left Lip Corner,
25-Left Edge Lower Lip, 26-Lower Lip Center, 27-Right Edge Lower Lip, 28-Bottom Lower Lip, 29-Top
Lower Lip, 30-Upper Corner Right Eye, 31-Lower Corner Right Eye, 32-Upper Corner Left Eye, 33-Lower
Corner Left Eye
To explore the prominent facial features for differentiating attention and inattention, the geometrical
information was estimated from all points pairwise using the Euclidean distance formula (Eq. 3) as
follows
Page 9/32Euclidean distance =√ ((x2 – x1 )^2+ ( y2 – y1 )^2 ) (3)
where x1, y1, and x2, y2 are representing two different facial landmarks.
To select the best feature from the facial features, threshold distance was used. The threshold distance is
an estimation measurement that describes the changes between facial expression at a neutral frame and
expression frame [52]. The threshold distance value is an established method for revealing the
information embedded in a dataset. This approach has been successfully applied in differentiating posed
emotions from neutral emotions [38, 53]. In this current study, the threshold distance between attention
and inattention with higher values represented in Fig. 4 were selected to train several binary classifier
algorithms. The parameters describing the feature selection process are described in Table 1.
Table 1
Description of parameters used in the feature selection (Fig. 4)
Parameters Description
{\text{f}}_{1..\text{n}} Frame by frame detection
{\text{f}{\prime }}_{1..\text{n}} Frames annotated as attention
{\text{f}{\prime }{\prime }}_{1..\text{n}} Frames annotated as inattention
\text{g}{\text{f}{\prime }}_{1..\text{n}} Geometrical information of attention
\text{g}\text{f}= Geometrical information represented the mean
value of landmark coordinates
\text{g}{\text{f}{\prime }{\prime }}_{1..\text{n}}- The difference between the mean value of
\text{g}{\text{f}{\prime }}_{1..\text{n}} attention and inattention frames.
3.2.2 Eye-Tracking Features
The gaze-based attentional model consists of six primary eye-tracking features described in Table 1: gaze
position, fixation position (FixationY, FixationX), FixationDuration, Ocular distance i.e., head distance to
the screen (DistanceLeft, DistanceRight), pupil size (PupilLeft, PupilRight), and interocular distance were
collected. The description of these features is provided in Table 2.
Page 10/32Table 2
Description of Gaze-Based Features
Gaze Features Gaze Sub Description
Features
1. Pupil Size PupilLeft The pupil size of the left eye
PupilRight The pupil size of the right eye
3. Ocular DistanceLeft The distance of the participant’s left eye to screen
Distance
DistanceRight The distance of the participant’s right eye to screen
5. Fixation - The duration of time participant spent looking at the stimuli
Duration
6. Fixation FixationX The x-coordinate value of the position of the eye to the stimuli
Position on the screen
FixationY The y-coordinate value of position of the eye to the stimuli on
the screen
8. Gaze Position GazeLeftx The x-coordinate value of the participant's gaze on the screen
through the left eye
GazeLefty The y-coordinate value of the participant's gaze on the screen
through the left eye
GazeRightx The x-coordinate value of the participant's gaze on the screen
through the right eye
GazeRighty The y-coordinate value of the participant's gaze on the screen
through the right eye
12. InterOcular - The distance between the left pupil and the right pupil
Distance
Next, we identified the annotated samples labelled as attention, inattention, and unknown. The samples
with unknown labels were deleted, leaving us with only samples labelled as attention and inattention. The
annotation column with string values: attention and inattention were converted to integers 1 and 0,
respectively. Lastly, we normalized each feature to be on the same scale using the StandardScaler library
in sci-kit-learn (Eq. 4) using the following equation to achieve a relatively normalized sample distribution.
\text{Z}= \frac{{x}_{i}-\text{mean}\left(x\right)}{\text{stdev}\left(\text{x}\right)}
4
The best features were selected using an embedded method that uses the inherent characteristics of
decision tree algorithms such as random forest, and CART [54] and it is especially encouraged for
imbalanced datasets [55]. Feature permutations of randomly selected samples and estimated percentage
increase in the misclassification rate were used in the embedded method to select the best individual eye-
tracking features (Fig. 5).
Page 11/323.3 Binary Classification
Three different attentional models were developed using six different classifier algorithms: SVM, CART,
LOR, RF, GBC, and KNN. These algorithms were implemented in Scikit-Learn. The performances of these
models were compared using 10-fold cross-validation to select the best classifier. The performances of
these algorithms were compared using 10-fold cross-validation, and SVM outperformed the other
classifiers with the highest AUC value. Next, we applied hyper-parameter tuning to optimize the SVM
parameters; cost (C) and gamma (γ). A large value for C indicates the model will be stricter on
classification errors. γ influences the sophistication of the decision boundary. Small values of γ will lead
to an increasingly sophisticated boundary that correctly classifies a higher percentage of training data.
Thus, inappropriate value selection for these parameters, also known as hyper-parameter tuning, may
lead to the poor performance of a model on a new dataset (i.e., overfitting). The parameter values
selected for C and γ are from the following sets of values C’s = [1–26] and γ = [0.001, 0.01, 0.1, 1, 10].
3.4 Attentional Model
Three attentional models were developed using facial, gaze and hybrid (facial and gaze) features. Each
model was trained as participant-specific and generalized. The participant-specific model was based on
individual data while the generalized model was developed with the data from all the participants. In
total, six attentional models were evaluated using AUC scores to determine their performance in detecting
attention. The performance of the participant-dependent model shows a higher performance value than
the participant-independent.
4. Results
This section presents the results of the face-based, gazed-based and hybrid-based attentional models
using six different classifier algorithms, followed by the features selection, participant-specific and
generalized models. Among the six binary classifiers, SVM has the highest performance value of other
classifiers.
4.1 Face-Based Attentional Model
Both participant-specific and generalized models were evaluated using ROC-AUC scores. The
performance of the participant-specific model shows a higher performance value than the generalized.
4.1.1 Evaluation of Face-Based
In the evaluation phase, we compared the performances of models developed with different sets of
distance-based features (i.e.,1–10, 1–20, and 1–30 features). The model with 10 features and 30
features had an accuracy score of 0.873 and that of 20 features had an accuracy of 0.889 as shown in
Fig. 6. Thus, this study used a model with the best 20 distance-based features due to higher performance
and fewer features. Similarly, the SVM model had the best AUC score across other models depicted in Fig.
Page 12/327. Also, Table 3 describes the 20 distance-based features. Five face regions emerged as prominent facial
features in recognizing attention— left jaw, right brow, right eyes, nose, and gnathion (chin).
Page 13/32Table 3
Best 20 Distance-Based Features for Face-Based Attentional Model
Features Feature Description Inattention Attention Distance
Threshold Values
(mean values) (mean (mm)
values)
D: 3–15 Left Jaw Angle-Outer Right 171.45 146.9 24.55
Brow Corner
D: 4–5 Left Top Jaw- Outer Right Brow 168.45 144.06 24.38
Corner
D: 4–6 Left Top Jaw- Right Brow 149.17 125.72 23.45
Center
D: 3–6 Left Jaw Angle- Right Brow 158.32 135.01 23.30
Center
D: 4–16 Left Top Jaw-Outer Right Eye 148.79 126.22 22.56
D: 4–7 Left Top Jaw- Inner Right Brow 122.89 100.99 21.89
Corner
D: 4–31 Left Top Jaw - Lower Corner 132.7 110.85 21.85
Right Eye
D: 4–30 Left Top Jaw- Upper Corner 134.16 112.37 21.79
Right Eye
D: 0–4 Gnathion-Outer Right Brow 167.05 145.36 21.69
Corner
D: 3–16 Left Jaw Angle-Outer Right Eye 147.11 125.43 21.67
D: 2_5 Gnathion-Outer Right Brow 159.94 138.36 21.58
Corner
D: 3_7 Left Jaw Angle- Inner Right 136.43 114.93 21.49
Brow Corner
D: 3_31 Left Jaw Angle- Lower Corner 131.48 110.45 21.02
Right Eye
D: 3_30 Left Jaw Angle- Upper Corner 136.74 115.77 20.96
Right Eye
D: 4_13 Left Top Jaw-Nose Lower Right 111.63 90.99 20.63
Boundary
D: 4_12 Left Top Jaw- Nose Tip 95.09 74.58 20.51
D: 4_17 Left Top Jaw- Inner Right Eye 117.02 96.6 20.42
D: 4_11 Left Top Jaw-Nose Root 98.58 78.51 20.06
D: 2_6 Gnathion- Right Brow Center 154.53 134.66 19.87
Page 14/32Features Feature Description Inattention Attention Distance
Threshold Values
(mean values) (mean (mm)
values)
D: 3_17 Left Jaw Angle- Inner Right Eye 121.38 101.61 19.77
4.1.2 Participant-Specific Model
In this model evaluation, the attentional model used data from 17 participants for training. Consequently,
the model was tested on one participant who was not part of the training data. The average of the model
performance for all participants was slightly above chance (ROC-AUC = 0.541), as shown in Fig. 8. This
result implies that generalized performance is weak for a generalized attentional model among children
with ASD.
4.1.3 Generalized Model
The attentional model was trained and tested only on the data samples from each participant in the
model. The training and testing data were in the ratio of 80% and 20%. The average model performance
for all participants was above chance (ROC-AUC = 0.957), as shown in Fig. 9. This result illustrates that
the performance of the participant-specific model was better than that of the generalized model. This
finding is supported by the heterogeneity in children with ASD, where each child responds differently to a
stimulus [56].
4.2 Gaze-Based Attentional Model
This section presents the results of gazed-based attentional model using six different classifier
algorithms, followed by the features selection, participant-specific and generalized models
4.2.1 Evaluation of Gaze-Based Model
The evaluation metrics (ROC-AUC) of 10-fold cross-validation for six different classifiers: KNN, CART, GBC,
SVM, LOR, and RF, are shown in Fig. 10. These classifiers were trained on the 12 eye-tracking features
described in Table 1. The best model classifier was SVM (AUC = 0.990), followed by RF (AUC = 0.989).
Lastly, in the feature selection process, the PupilLeft emerged as the best feature among the twelve
features, as shown in Fig. 11. It was determined that PupilLeft is the most significant feature, and
GazeRightx is the least relevant feature. The combination of these eye-tracking features was evaluated
for both the specific and generalized models in their order of importance. For example, the first feature,
PupilLeft, was evaluated, then PupilLeft and DistanceLeft were evaluated, and so on until we completed
all 12 features. The result shows that the specific model (AUC = 0.998) had better performance than the
generalized model (AUC = 0.626). The result also shows that the combination of the first four features
(PupilLeft, DistanceLeft, FixationDuration, and FixationX) achieves the best performance, as shown from
Fig. 60.
Page 15/32The model performance of generalized and participant-specific models of the gaze-based attentional
model was compared among ASD and TD groups. The participant-specific had higher performance than
the generalized model in ASD for all feature combinations. In contrast, the models for the TD group had
an equal performance with the first features, but the participant-specific model had higher performance
when the features were less than four.
4.2.2 Generalized Model
This section presents the result of the SVM that was conducted using the best four features: PupilLeft,
DistanceLeft, FixationDuration, and FixationX. We trained the SVM classifier with samples from all
participants except one, which was used for testing. This training and testing approach was repeated for
all participants and averaged. Five participants with only one class label i.e., only attention or inattention
were exempted from testing. Using the average score from all participants, the model performance was
slightly above chance (ROC-AUC = 0.626), as shown in Fig. 12.
4.2.3 Participant-Specific Model
Unlike the generalized model, the participant-specific model was only trained and tested on samples from
each participant using the splitting ratio of 80–20%, respectively. The model performance from each
participant was averaged for all participants. The average model performance was above chance (AUC =
0.998), as shown in Fig. 13. This result is far higher than the chance level, which implies that attention
recognition among children with ASD can be achieved using personalized eye-tracking features.
4.4.3 Comparison of Gaze-Based Attentional Model in ASD
and TD Groups
The performance of the generalized and specific gaze-based attentional model was compared between
the ASD and TD groups. We evaluated the incremental combination of all the features starting with
combining the most relevant feature, PupilLeft, with the other 11 features. In the ASD group, the
performances of the specific models are all higher than the generalized models. In comparison, in the TD
group, the performance of the specific models was only higher for the first three feature combinations
and was equal for the other feature combinations, as shown in Fig. 14 and Fig. 15.
4.3 Hybrid-Based Attentional Model
This section presents the results of a hybrid-based model for participant-specific and generalized models.
Also, we compared the hybrid-based, gazed-based, and face-based models across the participant groups.
The results show that the hybrid-based participant-specific model performed better than the generalized
model. The comparison across the three models (hybrid-based, gazed-based, and face-based) showed
that the gazed-based model performed better than the face-based model in the ASD group. In contrast,
the face-based model performed better with the TD group.
4.3.1 Generalized Model Performance
Page 16/32This section presents the results of the hybrid-based model using the best four eye-tracking features and
20 best twenty face-tracking features. Using the leave-one-out evaluation model, the average score from
ASD participants gave a performance value close to chance level (ROC-AUC = 0.538), as shown in Fig. 16.
The k-fold metric used a higher percentage as a testing sample, where the training and testing data were
in the ratios of 78% and 22%. This evaluation was iterated 50 times to ensure performance reliability, and
the average result was a little above chance as well (ROC-AUC = 0.561). This result implies that the
attentional behavior is diverse and does not have a regular pattern.
4.3.2 Participant-specific Model Performance
The participant-specific model was trained on 80% of the data samples and tested with the remaining
20% from each participant. The model performance averaged across all participants was above chance
(AUC = 0.996), as shown in Fig. 17. This result is far higher than the chance level, which implies that
attention recognition among children with ASD can be achieved with personalized eye-tracking features.
8.4.3 Comparison of Attentional Model Types in ASD and
TD Groups
The comparison of attentional model types between ASD and TD groups was evaluated across the face-
based, gaze-based, and hybrid-based models. Figure 18 shows that the generalized model in all model
types, face-based, gaze-based, and hybrid-based, works for the TD group more than the ASD group. In the
ASD group, the gaze-based model had the highest performance score (AUC = 0.677) when compared to
the face-based (AUC = 0.535) and hybrid-based models (AUC = 0.641). In contrast, the hybrid-based model
performed better (AUC = 0.963) than the gaze-based (AUC = 0.961) and face-based (AUC = 0.958) models
in TD groups. When using participant-specific models for ASD, the model performance was higher than
that of the TD group. In the ASD group, the gaze-based model had the highest performance score (AUC =
0.998) when compared to face-based (AUC = 0.957) and hybrid-based models (AUC = 0.996). Conversely,
the gaze-based (AUC = 0.950) performed better the hybrid-based model (AUC = 0.943) and face-based
models (AUC = 0.934) for TD group.
Aside from the differences in the attentional model types for ASD and TD groups, the selected face-based
(Table 31) and gaze-based (Table 32) features show that they are significant for differentiating ASD and
TD. In face-based features, the distance between the left jaw and tip of the nose (Cohen's d = 0.59) has
the largest effect size in detecting attention in children with ASD during an attention task. Similarly, the
distance of the left eye to the screen (Cohen's d = 0.672) has the largest effect size in differentiating ASD
from TD. This statistical inference shows that each of the features in our attentional model may serve as
biomarker for characterizing children with ASD.
5. Discussion
Page 17/325.1 Gaze-Based Attentional Model
This study conducted an attention task experiment with children with ASD to generate eye-tracking
features. The feature extraction was based on content and physiological-based data that describes
attentional behavior during an attention task. The extracted features were trained with the classifier
algorithm to recognize attention and inattention behaviors. Two main types of models, participant-
specific and generalized were evaluated between the ASD and TD groups. Results show that the
participant-specific model performed better than the generalized model for the ASD group while both
models had a similar performance for the TD group with the best four features. This finding aligns with
the concept of heterogeneity among children with ASD [56].
The best features identified for the gaze-based attentional model using embedded feature selection
include a combination of PupilLeft, DistanceLeft, Fixation Duration, and FixationX. These features
showed that the two eye works differently during attention tasks. This finding supports the evidence of
side glancing in children with ASD, a characteristic where they tend to look off to the side of a stimulus
[57, 58]. Furthermore, the results of this study show that pupil size is the most significant feature for
detecting attention.
Our approach to developing a gaze-based attentional model for children with ASD has added to the body
of knowledge with two main contributions. First, this study showed that the personalized gaze-based
attentional model is more suitable for children with ASD than the generalized model. Second, we
identified that the pupil size of the left eye is the most significant feature for developing gaze-based
attentional model for children with ASD.
5.2 Face-Based Attentional Model
The face-based attentional model discussed in this study utilizes 34 facial landmarks with x and y
coordinates generated in real-time during the attention task. Consequently, the features were transformed
to distance between facial landmarks. Twenty distance-based features were identified as distinctive
features for differentiating attention and inattention. Also, the best facial features for recognizing
attention were identified based on the distance-based features—jaw, eyebrows, eyes, nose, and gnathion.
Lastly, we evaluated model generalization for ASD and TD groups and different attention tasks.
According to the results of this study, the performance of the participant-specific and the generalized was
above chance. However, the performance of the participant-specific model had a better performance
score than the generalized model.
This shows that the participant-specific model works better for children with ASD. Similarly, previous
studies also concluded that children with ASD exhibit different face-based attentional behaviors [59,
60].Findings from this study show that the face-based attentional model is relatively more generalized
among the TD group than in the ASD group. Overall, the participant-specific model outperformed the
generalized model. Therefore, a generalized face-based model for children with ASD and different
attention tasks needs to be applied cautiously.
Page 18/32The implication of the face-based attentional model for children with ASD showed that the personalized
model supports the evidence of heterogeneity in individuals with ASD. This confirms variations in facial
features describing attentional behavior in children with ASD. Thus, our result suggests a personalized
face-based attentional model instead of the traditional one-size-fits-all machine learning approach. A
similar finding was reported by Rudovic, et al. [61] where the authors evaluated personalized and
generalized deep learning models to detect affective states and engagement during human-robot
interaction with children with ASD. Their finding showed that the personalized model outperformed the
generalized model due to the cultural and individual differences among the participants. Furthermore, the
direction of recent research, especially in the ASD field, is heading down the path of personalization such
as a personalized autism diagnosis system [62] personalized and precise intervention for children with
ASD [63], and personalized medicine in ASD. The trend of the personalized model is not limited to
education and medicine but also to commerce and many other fields.
The application of a personalized face-based attentional model can enhance adaptive learning support or
human intervention support. The findings from this study support the evidence that facial features have
the potential of assessing attention [64, 65]. The three contributions of this study include 1) a distance-
based feature selection method that differentiates attentional behaviors, 2) five face regions that best
describe attentional behaviors among children with ASD, and 3) how the face-based attentional model
supports the evidence of personalized attentional model than the generalized model.
5.3 Hybrid-Based Attentional Model
The objective of this study is to evaluate the performance of a hybrid-based attentional model that
consists of both face-tracking and eye-tracking data. The attentional model trained face-based and gaze-
based features with the SVM classifier algorithm to predict attentional behaviors. The two main types of
models, participant-specific, and generalized models were evaluated between the ASD and TD groups.
The results show that all attentional model types, hybrid-based, face-based, and gaze-based models,
cannot be generalized in children with ASD. This finding aligns with the concept of heterogeneity among
children with ASD [56]. Also, eye-tracking measures aid in the detection of more attentional behaviors
than face-tracking measures or the combination of eye-tracking and face-tracking measures. However, it
is worth mentioning that our study has showed that face-tracking measure can also be sufficient for
attention recognition.
There is a widespread assumption that models with multiple-sensor or multimodal methods give better
accuracy than models with a few sensors or single-sensor methods [15, 38, 40]. A previous study on this
assumption shows that the multimodal approach is not always the best. According to D’mello and
Graesser [39], a multimodal approach shows that integrating facial features, body posture, and
interaction dialogue, had similar performance when compared with combining facial features, body
posture and interactive dialogue. Similarly, our results show that combining many methods does not
guarantee better accuracy. For example, we expected the performance of the hybrid-based attentional
model to be higher than the gaze-based or face-based models. The hybrid-based model performed better
Page 19/32than other models in the TD group but not in the ASD groups. Instead, the best model type for the ASD
group was the gaze-based model.
Limitation
Despite the strength of this study, it still has several limitations. First, attentional behavior of children with
severe ASD was not considered as they were not included in the data collection process because it is
challenging to get sit for the attention task. Therefore, the application of this attentional model may not
be generalized to children with severe ASD or attention deficit hyperactive disorder (ADHD) since neither
of these variables was incorporated in the experiment. Second, the experiments were tailored to the
experience of children with ASD and not adults, so our findings may not apply to techniques of
measuring attention in adults with ASD. Third, not all possible eye-tracking measures were covered in this
study. For example, saccades, smooth pursuit, and blink rate. There is a need for further studies on how
other eye-tracking metrics can influence the development of an attention recognition system for children
with ASD. Lastly, the facial feature extraction was primarily done on data from children with ASD and
those features were applied on facial data from TD children. Therefore, the attentional model may not
give optimal performance with TD children.
Conclusion
This study has shown the potential of unobtrusive and non-invasive sensing technology such as webcam
and eye-tracking devices for extracting facial and gaze features that best describe the attentional
behavior of children with ASD. Thus, designers or researchers can either use a webcam or eye-tracking
device as a tool to track the attention of children with ASD. This objective approach is a step towards
solving problems of attention assessment in children with ASD. The significant advantage of the
objective attention detection system over subjective assessment is the provision for individualized
attention assessment which supports the heterogeneity in ASD. Further improvement in the study can
include the investigation of behavioral features that describes auditory attention as facial and eye-
tracking features that might be limited to visual attention. Also, this work can be extended to other
populations with learning disabilities such as dyslexia, down syndrome, and others to achieve desired
learning outcomes.
References
1. Roh, T.; Song, K.; Cho, H.; Shin, D.; Ha, U.; Lee, K.; Yoo, H.J. 18.5 A 2.14mW EEG neuro-feedback
processor with transcranial electrical stimulation for mental-health management. In Proceedings of
2014 IEEE International Solid-State Circuits Conference Digest of Technical Papers (ISSCC), 9-13 Feb.
2014; pp. 318-319.
2. Lee, J.D.; Meadan, H. Parent-mediated interventions for children with ASD in low-resource settings: A
scoping review. Review Journal of Autism and Developmental Disorders 2021, 8, 285-298.
Page 20/323. Alshaban, F.; Aldosari, M.; Al‐Shammari, H.; El‐Hag, S.; Ghazal, I.; Tolefat, M.; Ali, M.; Kamal, M.; Abdel
Aati, N.; Abeidah, M. Prevalence and correlates of autism spectrum disorder in Qatar: a national
study. Journal of Child Psychology and Psychiatry 2019, 60, 1254-1268.
4. Mugianti, S. Measurement Instruments for the Stimulation of Children with Autism Spectrum
Disorder based on Family Care. Medico-Legal Update 2022, 22.
5. Das, T.R.; Hasan, S.; Sarwar, S.; Das, J.K.; Rahman, M.A. Facial Spoof Detection Using Support Vector
Machine. In Proceedings of Proceedings of International Conference on Trends in Computational and
Cognitive Engineering; pp. 615-625.
6. Kinnealey, M.; Pfeiffer, B.; Miller, J.; Roan, C.; Shoener, R.; Ellner, M.L. Effect of Classroom Modification
on Attention and Engagement of Students With Autism or Dyspraxia. American Journal of
Occupational Therapy 2012, 66, 511-519, doi:10.5014/ajot.2012.004010.
7. Almumen, H.; Almuhareb, K. Technology-enriched social story intervention: Engaging children with
autism spectrum disorders in social communication. International Journal of Early Childhood Special
Education 2020, 12, 96-119.
8. Hutt, S.; Krasich, K.; R. Brockmole, J.; K. D'Mello, S. Breaking out of the lab: Mitigating mind
wandering with gaze-based attention-aware technology in classrooms. In Proceedings of
Proceedings of the 2021 CHI Conference on Human Factors in Computing Systems; pp. 1-14.
9. Palazzi, A.; Abati, D.; Solera, F.; Cucchiara, R. Predicting the Driver's Focus of Attention: the DR (eye)
VE Project. IEEE transactions on pattern analysis and machine intelligence 2018, 41, 1720-1733.
10. Chen, I.Y.; Joshi, S.; Ghassemi, M.; Ranganath, R. Probabilistic machine learning for healthcare.
Annual Review of Biomedical Data Science 2021, 4, 393-415.
11. Patten, E.; Watson, L.R. Interventions targeting attention in young children with autism. American
Journal of Speech-Language Pathology 2011, 20, 60-69.
12. Zanker, M.; Rook, L.; Jannach, D. Measuring the impact of online personalisation: Past, present and
future. International Journal of Human-Computer Studies 2019, 131, 160-168.
13. Belle, A.; Hobson, R.; Najarian, K. A physiological signal processing system for optimal engagement
and attention detection. In Proceedings of 2011 IEEE International Conference on Bioinformatics and
Biomedicine Workshops (BIBMW), 12-15 Nov. 2011; pp. 555-561.
14. Sonne, T.; Obel, C.; Grønbæk, K. Designing Real Time Assistive Technologies: A Study of Children with
ADHD. In Proceedings of Proceedings of the Annual Meeting of the Australian Special Interest Group
for Computer Human Interaction; pp. 34-38.
15. Aslan, S.; Cataltepe, Z.; Diner, I.; Dundar, O.; Esme, A.A.; Ferens, R.; Kamhi, G.; Oktay, E.; Soysal, C.;
Yener, M. Learner engagement measurement and classification in 1: 1 learning. In Proceedings of
2014 13th International Conference on Machine Learning and Applications; pp. 545-552.
16. Banire, B.; Jomhari, N.; Ahmad, R. Visual Hybrid Development Learning System (VHDLS) Framework
for Children with Autism. Journal of Autism and Developmental Disorders 2015, 45, 3069-3084,
doi:10.1007/s10803-015-2469-7.
Page 21/3217. Higuchi, K.; Matsuda, S.; Kamikubo, R.; Enomoto, T.; Sugano, Y.; Yamamoto, J.; Sato, Y. Visualizing
gaze direction to support video coding of social attention for children with autism spectrum disorder.
In Proceedings of 23rd International Conference on Intelligent User Interfaces; pp. 571-582.
18. Lee, K.; Schertz, H.H. Brief report: Analysis of the relationship between turn taking and joint attention
for toddlers with autism. Journal of autism and developmental disorders 2020, 50, 2633-2640.
19. Egger, H.L.; Dawson, G.; Hashemi, J.; Carpenter, K.L.; Espinosa, S.; Campbell, K.; Brotkin, S.; Schaich-
Borg, J.; Qiu, Q.; Tepper, M. Automatic emotion and attention analysis of young children at home: a
ResearchKit autism feasibility study. NPJ digital medicine 2018, 1, 1-10.
20. Yaneva, V.; Eraslan, S.; Yesilada, Y.; Mitkov, R. Detecting High-functioning Autism in Adults Using Eye
Tracking and Machine Learning. IEEE Transactions on Neural Systems and Rehabilitation
Engineering 2020.
21. Yang, S.-M.; Chen, C.-M.; Yu, C.-M. Assessing the Attention Levels of Students by Using a Novel
Attention Aware System Based on Brainwave Signals. In Proceedings of Advanced Applied
Informatics (IIAI-AAI), 2015 IIAI 4th International Congress on; pp. 379-384.
22. Ghassemi, F.; Moradi, M.H.; Doust, M.T.; Abootalebi, V. Classification of sustained attention level
based on morphological features of EEG's independent components. In Proceedings of Complex
Medical Engineering, 2009. CME. ICME International Conference on; pp. 1-6.
23. Mitchell, T.M. Machine learning and data mining. Communications of the ACM 1999, 42, 30-36.
24. Russell, S.J.; Norvig, P. Artificial intelligence: a modern approach; Malaysia; Pearson Education
Limited: 2016.
25. Pedregosa, F.; Varoquaux, G.; Gramfort, A.; Michel, V.; Thirion, B.; Grisel, O.; Blondel, M.; Prettenhofer, P.;
Weiss, R.; Dubourg, V. Scikit-learn: Machine learning in Python. Journal of machine learning research
2011, 12, 2825-2830.
26. Schölkopf, B.; Burges, C.; Vapnik, V. Incorporating invariances in support vector learning machines. In
Proceedings of International Conference on Artificial Neural Networks, 1996; pp. 47-52.
27. Breiman, L. Random forests. Machine learning 2001, 45, 5-32.
28. Cover, T.; Hart, P. Nearest neighbor pattern classification. IEEE transactions on information theory
1967, 13, 21-27.
29. Steinberg, D.; Colla, P. CART: classification and regression trees. The top ten algorithms in data
mining 2009, 9, 179.
30. Avnimelech, R.; Intrator, N. Boosting regression estimators. Neural computation 1999, 11, 499-520.
31. Jeni, L.A.; Cohn, J.F.; De La Torre, F. Facing imbalanced data--recommendations for the use of
performance metrics. In Proceedings of 2013 Humaine association conference on affective
computing and intelligent interaction; pp. 245-251.
32. Bosch, N.; D'mello, S.K.; Ocumpaugh, J.; Baker, R.S.; Shute, V. Using video to automatically detect
learner affect in computer-enabled classrooms. ACM Transactions on Interactive Intelligent Systems
(TiiS) 2016, 6, 17.
Page 22/32You can also read