Numerical Investigation of Climate Change Effects on Storm Surges and Extreme Waves on Canada's Pacific Coast
←
→
Page content transcription
If your browser does not render page correctly, please read the page content below

atmosphere

Article
Numerical Investigation of Climate Change Effects on Storm
Surges and Extreme Waves on Canada’s Pacific Coast
Julien Cousineau * and Enda Murphy

                                          National Research Council of Canada, Ottawa, ON K1A 0R6, Canada; enda.murphy@nrc-cnrc.gc.ca
                                          * Correspondence: julien.cousineau@nrc-cnrc.gc.ca

                                          Abstract: Storm surges and waves are key climate-driven parameters affecting the design and opera-
                                          tion of ports and other infrastructure on the coast. Reliable predictions of future storm surges and
                                          waves are not yet available for the west coast of Canada, and this data gap hinders effective climate
                                          risk assessment, planning and adaptation. This paper presents numerical simulations of storm surges
                                          and waves in British Columbia coastal waters under a future climate (Representative Concentration
                                          Pathway) scenario (RCP8.5). The numerical models were first forced by wind and surface pressure
                                          fields from the ERA-5 global reanalysis, and calibrated and validated using historical wave and water
                                          level records. The models were then driven by atmospheric data from four regional climate models
                                          (RCMs) to investigate potential changes in the frequency and magnitude of storm surges and extreme
                                          waves over the 21st century. The model outputs were analyzed to determine the potential impacts of
                                          climate change on storm surges and wave effects at key ports and transportation assets in western
                                          Canada. The study is the first of its kind to utilize unstructured, computational models to simulate
                                          storm surges and waves for the entire western Canada coastal region, while maintaining the high
                                          spatial resolution in coastal sub-basins needed to capture local dynamic responses.


                                   Keywords: storm surge; extreme waves; climate change; coastal infrastructure; downscaling; numerical
Citation: Cousineau, J.; Murphy, E.       model; hydrodynamics; ports
Numerical Investigation of Climate
Change Effects on Storm Surges and
Extreme Waves on Canada’s Pacific
Coast. Atmosphere 2022, 13, 311.          1. Introduction
https://doi.org/10.3390/                        The frequency and magnitude of extreme high water levels influences the main-
atmos13020311
                                          tenance and operational resilience of ports and harbors, affecting cargo-handling and
Academic Editor: Xiangbo Feng             berthing downtime, navigation risks and safety, spill risk and response capacity, and
                                          the exposure/resilience of ships and port structures to coastal hazards (waves, currents,
Received: 20 January 2022
                                          flooding, erosion, and tsunami). Extreme water levels (to which storm surge is often
Accepted: 10 February 2022
                                          a major contributor) and wave action are primary considerations for the planning and
Published: 12 February 2022
                                          design of new port facilities, and expansion or adaptation of existing facilities in British
Publisher’s Note: MDPI stays neutral      Columbia [1–3]. Extreme water levels and waves are also significant factors contributing to
with regard to jurisdictional claims in   regional flood and erosion risks to other types of transportation infrastructure on Canada’s
published maps and institutional affil-   west coast, including the low-lying Vancouver International Airport, roads, bridges and
iations.                                  rail systems [4–7].
                                                Climate change poses risks to ports and maritime operations in western Canada, along
                                          with vital connecting infrastructure and global supply-chain networks [8]. It is broadly
                                          accepted that climate change and local land subsidence will lead to higher relative mean
Copyright: © 2022 by the authors.
                                          water levels on much of Canada’s coasts, including British Columbia [9–11]. Less is known
Licensee MDPI, Basel, Switzerland.
                                          about potential changes in the frequency and intensity of storm surges and wave effects,
This article is an open access article
distributed under the terms and
                                          which are significant factors contributing to flooding, damage to coastal infrastructure,
conditions of the Creative Commons
                                          and disruption of maritime activities [6,7,12,13]. In particular, disruption of maritime
Attribution (CC BY) license (https://     transportation activities can have damaging consequences for many coastal and island
creativecommons.org/licenses/by/          communities in the region, which are reliant on this mode of transport for supply of
4.0/).                                    essential goods [14,15]. The storm surge and wave climates in Canada’s Pacific region are

Atmosphere 2022, 13, 311. https://doi.org/10.3390/atmos13020311                                      https://www.mdpi.com/journal/atmosphere
Atmosphere 2022, 13, 311                                                                                           2 of 26

                           dominated by extra-tropical storms that primarily occur in the months of October through
                           March [16,17]. These cyclones form at mid-latitudes in the North Pacific Ocean and tend
                           to turn northward as they mature and decay as they move eastward [18]. The dominant
                           landfall region is on the British Columbia, Washington and Oregon coasts [19]. Coastal
                           storm damages and flood hazards are generally most severe when high waves coincide
                           with high water levels [12,19], which include contributions from superimposed tides,
                           regional fluctuations in mean sea level, and storm surges. The inverse barometer effect (i.e.,
                           the rise in water level accompanying a fall in sea-level pressure) is the dominant driver
                           of storm surges in the Northeast Pacific [19,20], with secondary contributions by wind
                           effects, currents, and their interactions with shorelines and bathymetry [19,21]. Regional
                           mean sea levels and storminess are influenced by Pacific Ocean climate variability patterns
                           that are superimposed on a variety of timescales, ranging from multi-decadal to inter-
                           annual. Inter-annual variability in regional mean sea levels is predominantly driven
                           by El Niño-La Niña Southern Oscillation (ENSO) and Pacific Decadal Oscillation (PDO)
                           patterns [19,22]. In particular, El Niño events are correlated with lower sea-level pressures,
                           elevated regional water levels, increased storm surges, increased wave energy fluxes, shifts
                           in wave directions, and anomalously high rates of coastal erosion in the Northeast Pacific
                           during winter [19,22]. Khandekar and Swail [14] highlighted the risk to maritime activities
                           arising from storm waves in Canada’s Pacific region, as demonstrated by five fatalities
                           and the sinking of several fishing boats during a particularly severe storm in October
                           1984. More than 100 shipping containers were dislodged from a cargo ship off the coast of
                           Victoria in October 2021 [23], and stormy conditions hindered firefighting and recovery of
                           the containers at the scene. The vulnerability of coastal communities and infrastructure to
                           storm surge and wave-driven hazards is, however, highly variable across the region [14];
                           depending on factors, such as exposure (contrast the sheltered Strait of Georgia with the
                           exposed west coast of Vancouver Island), coastal geomorphology (e.g., the low-lying Fraser
                           River Delta versus the steep rock shorelines prevalent throughout the region), remoteness,
                           population density, adaptive capacity and resilience. Forseth [13] documented observations
                           of coastal flooding, damage to infrastructure, and erosion hazards in the greater Vancouver
                           district (British Columbia’s most populous region) resulting from storm surge and wave
                           events from the late 1800s through 2011. More recently, severe coastal storms coinciding
                           with spring high tides have caused disruption and damage to coastal infrastructure in this
                           region. For example, media reports document the destruction of White Rock’s historic pier
                           in 2018 [24], widespread ferry cancellations in October 2021 [25], the release and sinking
                           or grounding of 22 vessels in a November 2021 storm [26], and serious damage to the
                           Stanley Park Seawall in January 2022 [27]. Despite an enormous contrast in population
                           density to the Metro Vancouver region, remote northern communities in Haida Gwaii are
                           also vulnerable to coastal storms, which cause frequent power outages, interrupted ferry
                           services, occasional highway closures, and shortages of essential goods [14].
                                It is more than three decades since the first numerical investigations of storm surges
                           in British Columbia coastal waters were completed [28]. The escalating regional risks
                           posed by relative sea-level rise, as well as advances in numerical models, computing
                           power, global and regional atmospheric datasets have led to recent, renewed interest in
                           numerical simulation of storm surges in this area [12,21,29]. Soontiens et al. [12] used
                           a three-dimensional, baroclinic Nucleus for European Modelling of the Ocean (NEMO)
                           model of the Salish Sea to hindcast storm surge events in the Strait of Georgia. Atmospheric
                           forcing was provided by the Canadian Meteorological Centre’s 33 km-resolution global
                           atmospheric reforecasting model, and Environment & Climate Change Canada’s High
                           Resolution Deterministic Prediction System [30], and applied to a curvilinear computational
                           grid, which had a horizontal resolution of approximately 440 m by 500 m, and fixed z-layer
                           spacing in the range 1–10 m. Soontiens et al. [12] concluded that storm-driven water level
                           anomalies outside the Strait of Juan de Fuca are the dominant drivers of local storm surge
                           response inside the semi-enclosed Salish Sea. Zhai et al. [21] applied the two-dimensional,
                           barotropic Princeton Ocean Model (POM) to simulate storm surges over a much larger
Atmosphere 2022, 13, 311                                                                                              3 of 26

                           region of the Northeast Pacific Ocean on a structured computational grid with a resolution
                           of approximately 7 km. The POM model was forced by hourly Climate Forecast System
                           Reanalysis (CFSR) atmospheric data [31] to generate a 37-year storm surge hindcast. To
                           account for baroclinic effects not captured by the barotropic model (e.g., intraseasonal and
                           interannual fluctuations, such as those caused by the El Niño-La Niña Southern Oscillation),
                           Zhai et al. [21] adjusted the modelled storm surges with output from the ORAS5 global
                           ensemble reanalysis, resulting in improved agreement with water level residuals derived
                           from tide gauge measurements. Yang et al. [29] used the three-dimensional, Finite-Volume
                           Coastal Community Model (FVCOM), running in barotropic mode, to simulate storm
                           surges in the Salish Sea. The model took advantage of FVCOM’s unstructured mesh
                           capabilities to achieve characteristic horizontal resolutions as high as 200 m in areas of
                           Puget Sound, decreasing to approximately 8 km along the open boundaries, and four sigma
                           layers. As Yang et al. [29] pointed out, this relatively high spatial resolution allows for
                           accurate simulation of nonlinear responses and potential amplifications of storm surges in
                           the coastal sub-basins that are characteristic of the region. Despite the relatively high spatial
                           resolution of their model, Yang et al. [29], like Zhai et al. [21], relied on the 0.5◦ -resolution
                           (~40 km) CFSR dataset for atmospheric forcing. The resolution of the CFSR dataset is quite
                           coarse relative to the dimensions of the Salish Sea, which is less than 40 km across at its
                           widest point between West Vancouver and Gabriola Island. Yang et al. [29] corroborated
                           findings by Soontiens et al. [12] that storm surges in the Salish Sea are dominated by the
                           response to remote surges arising from storms in the Pacific Ocean, with local wind forcing
                           representing a secondary contribution.
                                 Despite damaging impacts of storm waves on coastal infrastructure in British Columbia
                           [7,13], there have been comparatively few region-wide numerical studies of extreme waves.
                           The Global Reanalysis of Ocean Waves North East Pacific (GROWFine:NEPAC) dataset,
                           developed by Oceanweather, Inc. as a follow-on to the MSC50 Atlantic hindcast [30], is a
                           reanalysis product providing wave spectra and parameters at 3-hourly intervals for the
                           period 1980–2015 in waters off Canada’s west coast. The data are provided on a grid with
                           point spacing of 0.635◦ (~45 km) in the east-west direction and 0.3125◦ (~35 km) in the
                           north-south direction. The grid does not cover many of the sub-basins and inlets that
                           are characteristic of coastal British Columbia (such as the Strait of Georgia), and the grid
                           resolution is too coarse to capture nearshore wave transformation processes. The majority
                           of published numerical investigations of wave conditions for the British Columbia region
                           that incorporate nearshore wave processes and high resolution in coastal regions have
                           been to assess wave energy resources [32–34]. Consequently, these studies have mainly
                           focused on characterizing the mean wave climate, rather than extremes or climate change
                           effects. Developing projections of future extreme waves and water levels at global scales is
                           a relatively recent but active area of research [22,35–37]. Global climate models generally
                           lack the high spatial resolution and complex physics needed to accurately downscale waves
                           and storm surges in nearshore coastal waters. A few researchers have investigated climate
                           change effects on waves and storm surges in Canadian regional waters [38,39] but, as
                           yet, reliable projections for coastal British Columbia remain unavailable. There is low
                           confidence in projected changes in waves and storm surges for this region, owing to limited
                           studies and published literature specific to regional winds, a lack of quality observational
                           data, and discrepancies between studies and output from different climate models [9]. This
                           data gap is a barrier to effective climate risk assessment and adaptation of transportation
                           infrastructure on Canada’s west coast.
                                 In this paper, we describe a set of numerical models developed to simulate storm
                           surges and extreme waves in British Columbia coastal waters. The study is the first of its
                           kind to utilize unstructured, computational models to simulate storm surges and waves
                           for the entire western Canada coastal region, while maintaining the high spatial resolution
                           in coastal sub-basins needed to capture local dynamic responses. It is also one of the first
                           attempts to utilize the ERA-5 global atmosphere-ocean reanalysis [40], which provides
                           higher temporal and spatial resolutions and promises improved physics over previous
Atmosphere 2022, 13, x FOR PEER REVIEW 4 of 27
in coastal sub-basins needed to capture local dynamic responses. It is also one of the first
Atmosphere 2022, 13, 311 attempts to utilize the ERA-5 global atmosphere-ocean reanalysis [40], which 4provides of 26
higher temporal and spatial resolutions and promises improved physics over previous
global reanalyses, to hindcast storm surges and waves in the region. Following calibration
and validation
global using
reanalyses, historical
to hindcast observations,
storm surges and the
wavesmodels
in the were
region.used to develop
Following dynami-
calibration
cally
anddownscaled
validation usingprojections of observations,
historical storm surgesthe and extreme
models werewaves
used under a future
to develop dynami-climate
cally downscaled
scenario, also a first projections of storm
for the region. surges
The and extreme
projections waves aunder
represent first astep
future
in climate
addressing
scenario,
current also a first
knowledge for the
gaps region. The
pertaining projections
to climate represent
change impactsa first
on step
storm in surges
addressing
and ex-
treme wave conditions in this coastal region. The data are intended to facilitateextreme
current knowledge gaps pertaining to climate change impacts on storm surges and improved
wave risk
climate conditions in this for
assessments coastal region.
the many The(e.g.,
ports data Port
are intended to facilitate
of Vancouver, Port ofimproved cli-
Prince Rupert,
mate risk assessments for the many ports (e.g., Port of Vancouver, Port of Prince Rupert,
Port of Nanaimo), and other transportation infrastructure on the coast (e.g., Vancouver
Port of Nanaimo), and other transportation infrastructure on the coast (e.g., Vancouver
International Airport and multiple small craft harbors), and may also prove useful to
International Airport and multiple small craft harbors), and may also prove useful to
coastal
coastalhazard
hazardrisk
risk assessments
assessments for forcoastal
coastal communities.
communities. Figure
Figure 1 shows
1 shows the location
the location of the of
theports,
ports,coastal cities, wave buoys, water level stations, weather stations and straits that are that
coastal cities, wave buoys, water level stations, weather stations and straits
arediscussed
discussed in in
thethe paper.
paper.
Figure 1. 1.Cities,
Figure Cities,ports, wavebuoys,
ports, wave buoys, water
water level
level stations,
stations, weather
weather stations
stations andthat
and straits straits that are dis-
are discussed
cussed in the
in the paper. paper.
2. Input
2. Input DataProcessing
Data Processingand
and Analysis
Analysis
2.1. Bathymetry, Water Levels and Vertical Datum
2.1. Bathymetry, Water Levels and Vertical Datum
Bathymetry data were downloaded from the Canadian Hydraulic Service (CHS) non-
Bathymetry data were downloaded from the Canadian Hydraulic Service (CHS) non-
navigational 100-m resolution (NONNA-100) online archive [41] and from the GEBCO_2020
navigational 100-m
gridded database [42]resolution
to support the (NONNA-100)
development ofonline archive
the numerical [41] and from the
models.
GEBCO_2020 gridded database [42] to support the development
Near-continuous, hourly water level records were downloaded from the of the numerical
Fisheries models.
and
Near-continuous,
Oceans Canada (DFO)hourly water level
online archive records
[43], for were
four tide downloaded
gauge fromthe
stations within themodel
Fisheries
and OceansPoint
domain: Canada (DFO)
Atkinson online archive
(Vancouver, Canada) [43], for four
(station tide gauge
identifier = 7795),stations
Victoria within
(7120), the
Bamfield
model (8545),
domain: and Prince
Point AtkinsonRupert (9354). TheCanada)
(Vancouver, archive contained data for all=four
(station identifier stations
7795), Victoria
that spanned at least the period 1979 to 2020. Astronomical tide predictions
(7120), Bamfield (8545), and Prince Rupert (9354). The archive contained data for all four were generated
for each
stations station
that usingatthe
spanned CHS
least tidal
the constituent
period 1979 todatabase with the IOS Tidal
2020. Astronomical Package [44],
tide predictions were
and then subtracted from the water level records to obtain residuals. The
generated for each station using the CHS tidal constituent database with the IOS Tidal computed water
level residuals were assumed to be primarily representative of storm surges, although it is
Package [44], and then subtracted from the water level records to obtain residuals. The
recognized that the residuals contain signatures from other sources [1,21,29,45].
computed water level residuals were assumed to be primarily representative of storm
All bathymetry data and water levels were referenced vertically to mean sea level (MSL).
surges, although it is recognized that the residuals contain signatures from other sources
[1,21,29,45].
Atmosphere 2022, 13, 311                                                                                          5 of 26

                           2.2. Waves—Observations
                                Hourly sea state measurements were downloaded from DFO online archives [46] for four
                           wave buoys within the model domain: Central Dixon Entrance (station identifier = C46145),
                           Halibut Bank (C46146), North Hecate Strait (C46183) and La Perouse Bank (C46206). The
                           records included significant wave heights, peak wave periods and concurrent meteorologi-
                           cal observations. All four stations were established in the late 1980s or early 1990s and the
                           archives contained near-continuous, hourly records spanning the periods from deployment
                           to 2020.

                           2.3. Waves—Reanalysis
                                The GROWFine:NEPAC dataset [47] was obtained by request from Fisheries and
                           Oceans Canada, and included time series data at 3-hourly intervals for 17 wave and wind
                           parameters, derived from a reanalysis of historical surface winds and ocean surface waves
                           in the Northeast Pacific Ocean for the period 1980–2015 (36 years). The dataset covered
                           much of British Columbia coastal waters and provided wind and wave parameters on a
                           0.625◦ (east-west) by 0.3125◦ (north-south) resolution grid.

                           2.4. Wind and Surface Pressure—Observations
                                Measured atmospheric pressure and 10-m elevation, mean (1- to 10-min average)
                           wind velocity data for the period 1992 to 2019 were downloaded from Environment and
                           Climate Change Canada’s online archives [48], for nine weather stations on the west coast
                           of Canada, denoted a to i in Figure 1.

                           2.5. Wind and Surface Pressure—Reanalysis
                                 Hourly, 10-m elevation wind and mean sea level pressure fields for the period
                           1979–2019 were downloaded from the ERA5 global reanalysis archive [40,49]. The spatial
                           resolution of the gridded ERA5 data was 31 km. Local verification of the ERA5 pressures
                           and wind speeds involved comparing observations from the nine weather stations to the
                           reanalysis time series output at grid points nearest to each station. The results of the
                           comparisons are shown in Taylor diagrams [50] in Figure 2. The Taylor diagrams provide
                           a visual framework for comparing the atmospheric pressure and wind speed from a test
                           dataset (ERA5) to a reference dataset (i.e., weather station observations), by simultaneously
                           displaying multiple statistical parameters (normalized standard deviation, correlation co-
                           efficient, normalized root-mean-square error). The normalized standard deviation of the
                           observations is shown as a red line on the Taylor diagrams. Values plotting closer to this
                           line and near the observed point (corresponding to normalized root-mean-square errors
                           and correlation coefficients equal to zero and one, respectively) of the Taylor diagrams
                           indicate locations where the reanalysis shows better agreement with the weather station
                           measurements. The statistical comparisons and inspection of time series data for significant
                           storm events revealed that ERA5 peak wind speeds were generally underestimated, and a
                           bias correction was therefore applied, whereby wind speeds were multiplied by a factor
                           of 1.5. The bias-corrected data were used as input to the numerical simulations of waves
                           and storm surges described later in this paper. The ERA5 atmospheric pressure showed
                           good agreement to measurements at most weather stations, with the exception of some
                           slight underestimation at Langara Island (b) and Cape St. James (d) in northern British
                           Columbia, and was not bias-corrected.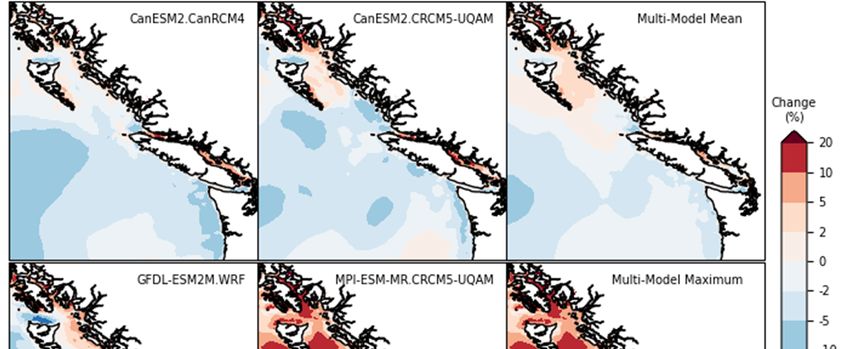
Atmosphere 2022, 13, x FOR PEER REVIEW 6 of 27
Atmosphere 2022, 13, 311 6 of 26
(a) (b)
Figure 2. Taylor
Figure 2. Taylordiagram
diagramshowing
showingerror
errorand
andcorrelation statisticsfor:
correlation statistics for: (a)
(a)atmospheric
atmosphericpressures
pressures (b)
wind
(b) wind speeds. The correlation is based on comparing the ERA5 data to collocated observations at at 9
speeds. The correlation is based on comparing the ERA5 data to collocated observations
weather stations
9 weather (a–i)
stations onon
(a–i) thethe
British
BritishColumbia coast.Values
Columbia coast. Valuesplotting
plotting closer
closer to red
to the the line
red and
linethe
and the
“observed”
“observed” point (corresponding to normalized root-mean-square errors and correlation coefficientscoeffi-
point (corresponding to normalized root-mean-square errors and correlation
cients equal
equal to zero
to zero and respectively)
and one, one, respectively) on thediagrams
on the Taylor Taylor diagrams indicatewhere
indicate locations locations where the rea-
the reanalysis
nalysis
showsshows
betterbetter agreement
agreement with thewith the weather
weather station measurements.
station measurements.
2.6.2.6.
WindWind and
and SurfacePressure—Future
Surface Pressure—Future Climate
Climate
Daily surface wind and pressure projections for the 21st century were downloaded
Daily surface wind and pressure projections for the 21st century were downloaded
from the North American Coordinated Regional Downscaling Experiment (NA-CORDEX)
from the North American Coordinated Regional Downscaling Experiment (NA-
web archive [51]. The projections consisted of four realizations from three Regional Climate
CORDEX) web archive
Models (RCM) [51]. The
for the RCP8.5 projections
global emissions consisted of The
scenario [52]. fourRCMs
realizations
and drivingfrom three Re-
Global
gional Climate Models (RCM) for the RCP8.5 global emissions scenario
◦
Climate Models (GCMs) are listed in Table 1. RCM data were at 0.22 spatial resolution [52]. The RCMs
and(approximately
driving Global 25 Climate Models
km) on native (GCMs) are
rotated-pole listed
grids, and in Tabletime
at daily 1. RCM dataspanning
intervals were at 0.22°
at least
spatial the period
resolution January 2006 to25
(approximately December
km) on 2099.
nativeThe choice of RCM
rotated-pole realizations
grids, and time
and at daily
emissions scenario was driven purely by the availability of surface wind and
intervals spanning at least the period January 2006 to December 2099. The choice of RCM pressure data
at daily temporal
realizations and emissions and 0.22◦was
resolutionscenario spatial resolution
driven purely at by
the the
timeavailability
of accessingof thesurface
archive.wind
and pressure data at daily temporal resolution and 0.22° spatial resolution at the time of
Table 1. Selected global climate and regional climate models.
accessing the archive.
To provide
Global some
Climate initialRegional
Model insightClimate
as to potential
Model climate change effects on storm surges
Institution
and extreme waves in British Columbia coastal waters,Canadian the daily wind
Centre for and surface pres-
Climate
CanESM2 CanRCM4
sure data from the RCMs were sorted by three 20-year reference Modelling & Analysis
periods for comparison:
CanESM2 CRCM5-UQAM Université du Québec à Montréal
• 2006–2025—Early-century period;
MPI-ESM-MR CRCM5-UQAM Université du Québec à Montréal
• 2031–2050—Mid-century period; and University of Arizona/US National
• 2080–2099—End-of-century
GFDL-ESM2M period.
WRF Center for Atmospheric
Research (NCAR)
Table 1. Selected global climate and regional climate models.
To provide some initial insight as to potential climate change effects on storm surges
Global Climate Regional Climate
and extreme waves in British Columbia coastal waters, the dailyInstitution
wind and surface pressure
data from the RCMs were Model
Model sorted by three 20-year reference periods for comparison:
• CanESM2
2006–2025—Early-century period; Canadian Centre for Climate Modelling &
CanRCM4
• 2031–2050—Mid-century period; and Analysis
• CanESM2
2080–2099—End-of-century
CRCM5-UQAM period. Université du Québec à Montréal
MPI-ESM-MR CRCM5-UQAM Université du Québec à Montréal
University of Arizona / US National Center for
GFDL-ESM2M WRF
Atmospheric Research (NCAR)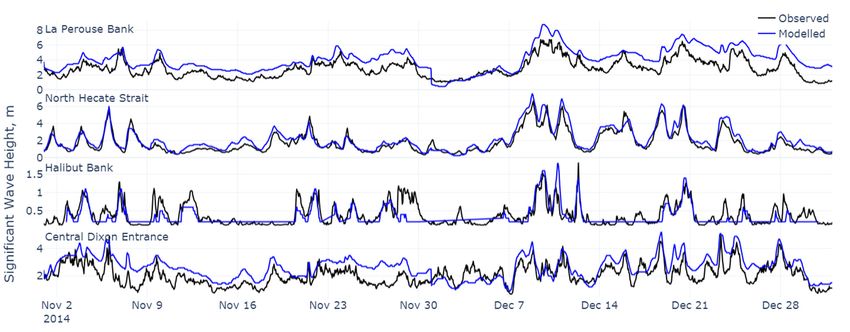
Atmosphere2022,
Atmosphere 2022,13,
13,311
x FOR PEER REVIEW 77of
of26
27
For
Foreach
eachperiod,
period,thethe99th percentile
99th of daily
percentile wind
of daily speed
wind and and
speed the 99th
the percentile of daily
99th percentile of
low
dailypressure were calculated,
low pressure which
were calculated, corresponds,
which on average,
corresponds, to the
on average, to top 3 daily
the top values
3 daily val-
per
ues year. TheThe
per year. 99th99th
percentile
percentilevalues forfor
values 2031–2050
2031–2050 andand2080–2099
2080–2099were wereevaluated,
evaluated,andand
compared
comparedto tobaseline
baseline early-century
early-centuryvalues
values (2006–2025)
(2006–2025) to to obtain
obtain aa representative
representative measure
measure
of
of projected
projectedchanges
changesin in extreme
extremesurface
surfacewind
wind speeds
speeds and
and pressures.
pressures. The
The projected
projected changes
changes
in the 99th percentile daily wind speeds (expressed as a percentage
in the 99th percentile daily wind speeds (expressed as a percentage relative relative to early-century
to early-cen-
values) are shown
tury values) in Figure
are shown 3 for3mid-century
in Figure for mid-centuryand and
Figure 4 for4 end-of-century.
Figure for end-of-century. Positive
Posi-
values, shown
tive values, in red,
shown in indicate increases
red, indicate relative
increases to thetoearly-century
relative the early-centuryperiod, and negative
period, and neg-
values, shownshown
ative values, in blue,
inindicate decreases.
blue, indicate decreases.
Figure 3. Projected changes in the 99th percentile of daily wind speeds by mid-century (2006–2025
Figure 3. Projected changes in the 99th percentile of daily wind speeds by mid-century (2006–2025 to
to 2031–2050) for the RCP8.5 global emissions scenario.
2031–2050) for the RCP8.5 global emissions scenario.
For most nearshore regions, projected changes are in the range ±5% by mid-century,
relative to the baseline early-century period. In parts of northern British Columbia coastal
waters (e.g., near Haida Gwaii) and off the north coast of Vancouver Island, all models
show projected increases in the 99th percentile wind speeds by end-of-century, by 5–20%
depending on the RCM. These changes are consistent with evidence of poleward shifts
in storm tracks across Canada and globally. All RCMs show projected decreases in the
99th percentile (by as much as 10%) in some regions of the outer continental shelf at both
time horizons. Mid-century projections and end-of-century projections in the Central Coast
and Salish Sea (including Strait of Juan de Fuca and Strait of Georgia) regions are highly
variable across RCMs in terms of the direction of changes (i.e., positive or negative). In the
Salish Sea, where several commercial ports (e.g., Port of Vancouver, Port of Nanaimo) and
coastal infrastructure assets are located, projected changes are all within ±5%. However,
projections for semi-enclosed seas such as the Strait of Georgia are subject to uncertainty
associated with poor resolution of the land-sea interface by the RCM grids and the steep,
mountainous topography of coastal British Columbia.
Atmosphere 2022,13,
Atmosphere2022, 13,311
x FOR PEER REVIEW 88of
of26
27
Figure 4. Projected changes in the 99th percentile of daily wind speeds by end-of-century (2006–
Figure 4. Projected changes in the 99th percentile of daily wind speeds by end-of-century (2006–2025
2025 to 2080–2099) for the RCP8.5 global emissions scenario.
to 2080–2099) for the RCP8.5 global emissions scenario.
For most
3. Model nearshore Calibration
Development, regions, projected changes are in the range ±5% by mid-century,
and Validation
relative to the baseline early-century period. In parts of northern British Columbia coastal
Two models were developed to simulate storm surges and waves. Both are based on
waters (e.g., near Haida Gwaii) and off the north coast of Vancouver Island, all models
the TELEMAC system [53], a suite of software for numerical simulation of free surface
show projected increases in the 99th percentile wind speeds by end-of-century, by 5–20%
hydrodynamics, waves, and sediment transport in one, two or three dimensions. The
depending on the RCM. These changes are consistent with evidence of poleward shifts in
TELEMAC-2D and TOMAWAC modules were used to simulate storm surges and waves,
storm tracks TELEMAC-2D
respectively. across Canada and [54] globally.
solves theAll RCMs show projected
shallow-water decreases
(Saint-Venant) in the 99th
hydrodynamic
percentileusing
equations (by asfinite-element
much as 10%)or infinite-volume
some regions methods
of the outer
on continental
unstructured shelf at both time
computational
horizons. Mid-century projections and end-of-century projections
meshes. TOMAWAC [55] is a third-generation spectral wave model, which describes in the Central Coast
the
and Salish Sea (including Strait of Juan de Fuca and Strait of Georgia) regions
generation, propagation, transformation and dissipation of wind-waves in water. It uses are highly
variable across
finite-element RCMs in terms
techniques ofthe
to solve thedirectional
direction of changes
wave (i.e.,
action positive
balance or negative).
equation, In the
with sources
and sinks, also on unstructured computational meshes. The fundamental processes and and
Salish Sea, where several commercial ports (e.g., Port of Vancouver, Port of Nanaimo) file
coastal
types forinfrastructure
applying both assets
modelsare are
located, projectedmesh
very similar: changes are all within
generation, boundary±5%.conditions,
However,
projections
use for semi-enclosed
of bathymetric seas suchdatasets,
and meteorological as the Strait of Georgia
and model are subject
calibration to uncertainty
and validation.
associated with poor resolution of the land-sea interface by the RCM grids and the steep,
3.1. Computational
mountainous Mesh andofBoundary
topography coastal British Columbia.
The TELEMAC-2D and TOMAWAC model domains were set up to cover a substantial
3. Model
portion ofDevelopment,
the Northeast Calibration
Pacific Ocean, and Validation
extending more than 1700 km from the coast of
British Columbia
Two models in all directions,
were developed and utilizingstorm
to simulate a spherical
surgesco-ordinate
and waves. system
Both are(Figure
based 5).
on
Although early iterations of the models involved smaller computational domains,
the TELEMAC system [53], a suite of software for numerical simulation of free surface the larger
domains were required
hydrodynamics, waves,toand
fully resolve transport
sediment Pacific Ocean storm
in one, twosystems
or threepropagating
dimensions.towards
The
the coast, thus and
TELEMAC-2D implicitly
TOMAWACcapturing the remote
modules forcing
were used that dominates
to simulate stormand
storm surges surges
waves,in
coastal sub-basins
respectively. of British Columbia
TELEMAC-2D [54] solves[12,29]. Ultimately, (Saint-Venant)
the shallow-water the upper limithydrodynamic
on the size of
the model domain
equations was constrained
using finite-element by the spatial
or finite-volume extents on
methods of available RCMcomputational
unstructured atmospheric
data. The model computational mesh, as shown in Figure 5, consisted
meshes. TOMAWAC [55] is a third-generation spectral wave model, which describes the of unstructured,
triangular
generation,elements, created
propagation, using the openand
transformation source finite element
dissipation mesh generator,
of wind-waves Gmsh
in water. It [56].
uses
The
finite-element techniques to solve the directional wave action balance equation, from
input files for Gmsh were created using Python, shoreline datasets obtained with
5). Although early iterations of the models involved smaller computational domains, the
larger domains were required to fully resolve Pacific Ocean storm systems propagating
towards the coast, thus implicitly capturing the remote forcing that dominates storm
surges in coastal sub-basins of British Columbia [12,29]. Ultimately, the upper limit on the
size of the model domain was constrained by the spatial extents of available RCM atmos-
Atmosphere 2022, 13, 311 9 of 26
pheric data. The model computational mesh, as shown in Figure 5, consisted of unstruc-
tured, triangular elements, created using the open source finite element mesh generator,
Gmsh [56]. The input files for Gmsh were created using Python, shoreline datasets ob-
OpenStreetMap [57], and available
tained from OpenStreetMap [57], andbathymetric datasets. Characteristic
available bathymetric element edge
datasets. Characteristic ele-
lengths were automatically determined based on three criteria: shortest
ment edge lengths were automatically determined based on three criteria: shortest clear fetch length,
clear
local
fetch water depth
length, localand bathymetry
water depth and gradient. The shortest
bathymetry clear
gradient. fetch
The lengthclear
shortest criterion
fetch(i.e., the
length
shortest distance between adjacent shorelines) allowed for finer mesh resolution
criterion (i.e., the shortest distance between adjacent shorelines) allowed for finer mesh in the
bays, narrow
resolution straits,
in the bays,channels and fjords
narrow straits, characteristic
channels and fjordsof characteristic
coastal BritishofColumbia, and
coastal British
relaxed spatial resolution in open water (offshore) regions. The bathymetry-based
Columbia, and relaxed spatial resolution in open water (offshore) regions. The bathyme- (depth
and gradient)
try-based (depthcriteria facilitatedcriteria
and gradient) finer mesh resolution
facilitated finerin shallow,
mesh coastalinwaters
resolution and
shallow, areas
coastal
of steeply varying bathymetry. In total, there are 352,464 nodes and 618,205 elements in the
waters and areas of steeply varying bathymetry. In total, there are 352,464 nodes and
mesh. The mesh resolution varies from 250 m near coastal assets and areas of interest to
618,205 elements in the mesh. The mesh resolution varies from 250 m near coastal assets
125 km in the open ocean.
and areas of interest to 125 km in the open ocean.
(a) (b)
Figure 5.
Figure 5. (a)
(a) Computational
Computational mesh
mesh and
and open
open water
water boundary
boundary of
of the
the storm
storm surge
surge and
and wave
wave models,
models,
(b) computational mesh in the Strait of Georgia.
(b) computational mesh in the Strait of Georgia.
The model
modelbathymetry
bathymetry waswas based
based on a on a digital
digital elevation
elevation model comprising
model comprising the NONNA-the
NONNA-100
100 data in nearshore
data in nearshore regions
regions and and the GEBCO_2020
the GEBCO_2020 datawater,
data in deep in deepoffshore
water, offshore
regions.
regions. Elevations
Elevations were interpolated
were interpolated to the computational
to the computational mesh
mesh nodes nodes
using theusing thedistance
inverse inverse
distance weighting
weighting method. method.
3.2. Boundary Conditions
Boundary conditions applied to the storm surge and wave models consisted of open
water boundary conditions and surface (atmospheric) forcing. A radiation boundary
condition, based on Thompson’s method of characteristics [53], was applied to the offshore
boundary of the TELEMAC-2D storm surge model. An inverse-barometer criterion was
used to impose water levels along the boundary, whereby an increase in pressure by
1 millibar was accompanied by a decrease of 1 cm in water levels. Surface wind fields
and atmospheric pressure from the gridded ERA-5 reanalysis (historical) and RCM (future
climate) datasets were linearly interpolated to the model mesh nodes. As discussed above,
the ERA-5 wind data were bias-corrected by multiplying wind speeds by a factor of 1.5 to
better fit the statistics of observations at weather stations within the model domain.
The same bias-correction was applied to the RCM wind datasets. Additionally, the
temporal resolution of the bias-corrected ERA-5 dataset was decreased from 1-hourly to
3-hourly to make input file sizes more manageable. This approach was justified by the
results of sensitivity tests, which revealed that storm surge simulated by forcing the model
with the 3-hourly data (with linear interpolation of surface boundary conditions between
time intervals) were within ±1 cm of values obtained by forcing with the hourly data. The
Atmosphere 2022, 13, 311                                                                                             10 of 26

                           daily RCM surface wind and atmospheric pressure fields were also linearly interpolated in
                           time and to the computational mesh nodes.
                                The influence of atmospheric pressure and wind was activated for all storm surge
                           (TELEMAC-2D) simulations. A spatially and temporally varying wind drag coefficient,
                           which parameterizes air-sea momentum transfer, was applied and calculated as a func-
                           tion of wind speed using the Institute of Oceanographic Sciences (UK) formulation [58]:
                            a = 0.565 × 10⁻³                      for                            U < 5 m/s
                            a = (−0.12 + 0.137U) × 10−3           for                            5 < U < 19.22 m/s
                            a = 2.513 × 10⁻³                      for                            U > 19.22 m/s

                           where U is the wind speed and a is the wind surface drag coefficient (or “coefficient of
                           wind influence”, as described in the TELEMAC user manual [54]).
                                 The sensitivity of the storm surge predictions to bed friction was tested by varying bed
                           friction coefficients in the TELEMAC-2D model. Manning’s roughness coefficient variations
                           in the range 0.01 to 0.05 resulted in maximum variations in peak storm surges of ±2 cm. A
                           Manning’s roughness coefficient of 0.025 was used for all production simulations.
                                 Parametric (JONSWAP) wave spectra were prescribed along the open water boundary
                           of the TOMAWAC wave model based on the GROWFine:NEPAC database for historical
                           simulations (method 1). For future climate simulations, modelled wave data were not
                           available. Offshore wave boundary conditions for the future climate simulations were
                           therefore calculated as a function of the daily wind speed supplied by the RCMs, assuming
                           Pierson–Moskowitz spectra and a fully-developed sea state condition (method 2). To assess
                           the uncertainty associated with the (simplified) method 2 for prescribing wave boundary
                           conditions, both methods were used to simulate three historical storm events (in December
                           1993, December 1996, and February 2007). Simulated significant wave heights for these
                           three storms were compared to measurements at the four wave buoys listed in Table 2, and
                           correlation coefficients and root-mean-square-errors (RMSE) were evaluated. As might be
                           expected, correlation coefficients and RMSE at buoys that were relatively sheltered from
                           ocean waves (i.e., North Hecate Strait and Halibut Bank) were insensitive to the boundary
                           condition method. Method 1 resulted in higher correlation coefficients (by 0.02 to 0.04)
                           and lower RMSE (by 2 to 10 cm) at buoys exposed to the open ocean. Global or Pacific
                           Ocean basin-wide numerical simulations of waves for future climate scenarios would be
                           required to mitigate this source of uncertainty in future studies, and supply wave boundary
                           condition data to regional models.

                           3.3. TELEMAC-2D (Storm Surge) Model Input Parameters
                                A number of sensitivity tests were implemented where both tides and storm surges
                           were incorporated in the model, to assess the importance of tide–surge interactions. In
                           these tests, astronomical tidal forcing was supplied by the TPXO global tidal constituent
                           database [59], by activating this option in TELEMAC-2D. Inclusion of the astronomical
                           tides impacted the predicted storm surges by no more than ±3 cm, and tides were therefore
                           excluded from production simulations, reducing the computational cost by a factor of 3.
                           The Coriolis effect was activated for all simulations, as it had an important influence on
                           predicted storm surges. Without considering Coriolis effects, peak storm surges were under-
                           predicted by 10 cm, on average. The constant viscosity turbulence model parameterization
                           was used for all simulations, applying an eddy viscosity of 10−4 m2 /s. Sensitivity testing
                           with different eddy viscosities and a Smagorinsky turbulence model parameterization
                           revealed no discernible impacts on predicted storm surges. A constant time-step of 60 s
                           was prescribed, resulting in Courant numbers typically below 0.5.
Atmosphere 2022, 13, 311 11 of 26
Table 2. Error and correlation statistics for calibration events and validation period.
Storm Surge Significant Wave Height
Period Tide Gauge r2 RMSE (m) Period Wave Buoy r2 RMSE (m)
Bamfield 0.88 0.08 La Perouse Bank 0.90 0.91
Prince Rupert 0.77 0.10 Dec. North Hectate Strait 0.91 0.81
Feb. 1992
Victoria 0.82 0.07 1993 Halibut Bank 0.94 0.2
Vancouver 0.91 0.07 Central Dixon Ent. 0.64 0.91
Bamfield 0.93 0.06 La Perouse Bank 0.84 0.97
Prince Rupert 0.86 0.11 Dec. North Hectate Strait 0.92 0.71
Dec. 1987
Victoria 0.82 0.07 1996 Halibut Bank 0.83 0.17
Vancouver 0.84 0.08 Central Dixon Ent. 0.67 1.1
Bamfield 0.79 0.09 La Perouse Bank -1 -
Prince Rupert 0.88 0.08 Feb. North Hectate Strait 0.92 0.56
Dec. 2014
Victoria 0.87 0.08 2006 Halibut Bank 0.92 0.19
Vancouver 0.87 0.09 Central Dixon Ent. 0.84 0.57
Bamfield 0.84 0.08 La Perouse Bank 0.89 0.75
1979 to Prince Rupert 0.85 0.08 1979 to North Hectate Strait 0.94 0.58
2020 Victoria 0.85 0.07 2020 Halibut Bank 0.75 0.30
Vancouver 0.84 0.08 Central Dixon Ent. 0.78 0.85
1 Observed data not available.
3.4. TOMAWAC (Wave) Model Input Parameters
The time step for the TOMAWAC model was optimized to 900 s, with larger time
steps resulting in model instability. Different spectral direction and frequency resolutions
were tested during the calibration process to determine the impact on computational cost
and model skill. Ultimately, a spectral discretization corresponding to 16 directional bins
(360 degrees) and 36 frequency bins (3 to 25 s) was selected. Physical processes, source
terms and other input parameters were applied in the TOMAWAC model as follows:
• Bottom friction-induced dissipation—Bouws and Komen [60] expression with default
coefficient of 0.038;
• Wave spectrum growth limiter—WAM 4 original limiter [61] with default parameters;
• Whitecapping-induced dissipation—Komen and Janssen dissipation model [62,63]
with default parameters;
• Depth-induced breaking dissipation—Battjes and Janssen model [64] with default
parameters; and
• Nonlinear quadruplet interactions—Discrete Interaction Approximation (DIA) method
of Hasselmann et al. [65].
3.5. Model Calibration and Validation
Water level residuals (deemed representative of storm surge for the purpose of this
study) derived from tide gauge observations and measured wave data from buoys were
analyzed to identify extreme historical events, which were used as the basis for calibrating
and validating the numerical models. The analysis indicated that the most extreme storm
surges and wave heights are weakly correlated in space and time over the region of interest.
Three separate storm periods were therefore identified based on peak storm surges, and
three based on identified peak significant wave heights, to calibrate the storm surge and
wave models, respectively. The six events were chosen to reflect storm events that affected
all ports or wave buoys on the west coast. Table 2 lists the storm periods selected to calibrate
the storm surge and wave models.
Calibration of the storm surge model involved adjusting various model input param-
eters (e.g., turbulence models and eddy viscosity, Section 3.3) and boundary condition
parameterizations (e.g., wind drag and bed friction formulae and coefficients, Section 3.2) to
achieve root-mean-square errors (RMSE) in the range 0.07–0.13 m (evaluated by comparingAtmosphere 2022, 13, 311 12 of 26
Atmosphere 2022, 13, x FOR PEER REVIEW 12 of 27
Atmosphere 2022, 13, x FOR PEER REVIEW
storm surge predictions to observed water level residuals at tide gauges) for the three12 of 27
storm events. Calibration of the wave model primarily involved adjusting the spectral
discretization and activating/deactivating various source/dissipation terms to achieve
to RMSE
to 2020) in
2020) ofsimulated
of storm
significant
storm surges
surges and
wave heights
and waves,
waves, driveninby
driven bythethe
range 0.17–1.10
ERA-5
thewere
ERA-5
m for the
reanalysis three storm
(historical) dataset,
wave events. Once the models were calibrated, they usedreanalysis
to simulate(historical) dataset,
41 years (1979
for validation
for validation purposes.
purposes.
to 2020) of storm surges and waves, driven by the ERA-5 reanalysis (historical) dataset, for
Figures
Figures 66 and 77 show
and show sample
sample time
time series
series of
of observed
observed andand modelled
modelled storm
storm surges
surges and
and
validation purposes.
significant
significant wave
wave
Figures heights
heights
6 and atsample
7 showat stations
stations inseries
timein coastal
coastal British Columbia
British
of observed Columbia
and modelledduring
during winter
stormwinter season in
surges season
and in
1987–1988
significant
1987–1988 and
wave
and 2014–2015, respectively.
heights atrespectively.
2014–2015, stations in coastal British Columbia during winter season in
1987–1988 and 2014–2015, respectively.
Figure 6.
Figure 6. Observed
Observed and
and modelled surge
surge during
during the
the winter
winter months
months of of 1987–1988.
1987–1988.
Figure 6. Observed and modelled
modelled surge during the winter months of 1987–1988.
Figure
Figure 7.7. Observedand
Observed and modelled
modelled significant
significantwave
waveheight during
height the winter
during months
the winter
winter of 2014–2015.
months of 2014–2015.
2014–2015.
Figure 7. Observed and modelled significant wave height during the months of
Figure 8 shows error and correlation statistics (Taylor diagrams), based on a compar-
Figure
Figure
ison 88 shows
shows
of observed
error
error
and
and correlation
and
modelled
correlation statistics
statistics
daily-maxima
(Taylor
(Taylor
over the
diagrams),
entirediagrams),
based on
based
41-year validation
on aa compar-
compar-
period.
ison
ison of observed
of observed
n (legend and8)modelled
of Figure
and modelled daily-maxima
is the total over the
length of the dataset
daily-maxima over the entire
(inentire 41-year
days)41-year
on whichvalidation period. nn
the error and
validation period.
(legend of
correlation
(legend Figure 8)
statistics
of Figure is
8) are the total
based.
is the length of the dataset (in days) on which the
total length of the dataset (in days) on which the error and error and
correlation statistics
correlation statistics are
are based.
based.Atmosphere 2022, 13,
Atmosphere2022, 13, 311
x FOR PEER REVIEW 13 of 26
13 of 27
(a) (b)
Figure
Figure8.8.Taylor
Taylordiagrams
diagramsshowing
showingmodel
model skill at predicting:
skill (a) storm
at predicting: surges
(a) storm (b) significant
surges wave wave
(b) significant
heights, based on comparisons of modelled data (storm surges and waves) and observed data (re-
heights, based on comparisons of modelled data (storm surges and waves) and observed data
siduals and waves) at the four water level gauges and four wave buoys. n is the total length of the
(residuals and waves)
dataset (in days) at the
on which the four
errorwater level gauges
and correlation and four
statistics based.buoys. n is the total length of the
are wave
dataset (in days) on which the error and correlation statistics are based.
For storm surges, coefficients of correlation (r-squared) were in the range 0.84–0.85
for theFor storm surges,
validation period,coefficients
with RMSEofincorrelation (r-squared)
the range 0.07–0.08 were in the
m. Baroclinic range 0.84–0.85
contributions to for
the validation period, with RMSE in the range 0.07–0.08 m. Baroclinic
seasonal, interannual or decadal fluctuations in water levels are not included in the model, contributions
to seasonal,
which negativelyinterannual or decadal
affects model fluctuations
skill statistics in water levels
when comparing modelledare storm
not included
surges toin the
residuals derived from tide-gauge records. For example, the El Niño-La Niña Southernstorm
model, which negatively affects model skill statistics when comparing modelled
surges to residuals
Oscillation (ENSO) can derived from
contribute tide-gauge
+0.12/−0.04 records.
m to averageFor example,
regional waterthe Elanomalies
level Niño-La Niña
Southern
[22]. Oscillation (ENSO) can contribute +0.12/ − 0.04 m to average regional water level
anomalies [22]. wave heights, r-squared values varied in the range 0.75 to 0.94 for the
For significant
For significant
validation period, with wave
RMSEheights,
betweenr-squared
0.30 and values
0.85 m. varied
Modelin skill
the range 0.75 toat0.94
was higher openfor the
validation
ocean period, with
buoy locations and RMSE
lower in between 0.30 and
semi-enclosed 0.85
shelf m. such
seas Model skillStrait
as the was of
higher
Georgiaat open
ocean
and buoy
Dixon locations
Entrance, and the
where lower in semi-enclosed
coarse shelf seas
resolution of forcing such as the
atmospheric Strait(ERA5)
datasets of Georgia
andaffect
may Dixon theEntrance,
quality ofwhere
surfacethe coarse
wind speedresolution of forcing
input to the atmospheric
model. Some improvementdatasets (ERA5)
could
potentially
may affectbe themade by of
quality downscaling
surface wind wind fields
speed in these
input regions.
to the model.Wave–current
Some improvement interac-could
tions were not
potentially be included
made by in the model, and
downscaling wind are a potential
fields in thesesource of uncertainty
regions. Wave–current [52].interactions
were not included in the model, and are a potential source of uncertainty [52].
Table 2. Error and correlation statistics for calibration events and validation period.
4. Production Simulations
Storm Surge Significant Wave Height
4.1. Hindcast (1979 to 2020)
RMSE RMSE
Period Tide Gauge
The 41-year hindcastsrof hourly
2 Period Wave Buoy r2
(m) storm surges and waves, driven by the(m) ERA-5 re-
analysis and GROWFine:NEPAC
Bamfield 0.88 wave data, were generated
0.08 La Perouseusing
Bankthe 0.90
TELEMAC-2D
0.91 and
TOMAWAC models. The hindcast also provided the basis for model
North Hectate validation (Section 3.5).
Prince Rupert 0.77 0.10 Dec 0.91 0.81
Feb 1992 Strait
4.2. Future Climate Scenarios 1993
Victoria 0.82 0.07 Halibut Bank 0.94 0.2
The validated TELEMAC-2D and TOMAWAC models were used to generate a 4-member
Vancouver 0.91 0.07 Central Dixon Ent. 0.64 0.91
ensemble of storm surge and wave projections for the period 2006–2100 and the RCP8.5 sce-
Bamfield 0.93 0.06 La Perouse Bank 0.84 0.97
nario, driven by the four GCM-RCM future climate realizations (Table 1). Simulations were
North Hectate
processed using
Prince 1296 cores0.86
Rupert of Arm-based
0.11 AWSDecGraviton2 processors0.92 using the
0.71Amazon
Dec 1987 Strait
Web Services (AWS) cloud-computing platform. 1996Each simulation took approximately 96 h
Victoria output
to complete. Simulation 0.82 was0.07
saved at every hourHalibut Bank
between 0.83 21000.17
2006 and and stored
Vancouver 0.84 0.08 Central Dixon
on AWS S3. To minimize cloud storage space, the data were transformed Ent. 0.67 from 1.1 double
Bamfield
precision values 0.79 using
to byte values 0.09scaled factors and
La compressed
Perouse Bankusing - 1 NetCDF4
- format
Feb
Dec 2014
files. Two input North Hectateand wind velocity) and
Princevariables (mean sea-level
Rupert 0.88 0.08 atmospheric
2006 pressure, 0.92 0.56
six output variables (storm surge, significant wave height,Straitpeak wave period, mean wave
period, mean wave direction, and mean angular spreading of the directional wave spectra)Atmosphere 2022, 13, 311 14 of 26
were saved to the cloud. A total of 12 Terabytes of data was generated from the 4-member
future climate ensembles (storm surges and waves).
5. Results—Hindcast of Storm Surges and Extreme Waves
The
99th percentiles of daily maximum storm surges and significant wave
Atmosphere 2022, 13, x FOR PEER REVIEW 15 ofheights
27
Atmosphere 2022, 13, x FOR PEER REVIEW 15 of 27
were calculated for the period 2000–2020 (Figures 9 and 10), and are representative of
baseline (early-century) extreme storm surges and waves.
Figure 9. The
9. The 99th
99th percentileofofdaily
percentile daily maximum storm
stormsurges forfor
the period 20002000
to 2020.
Figure
Figure 9. The 99th percentile of dailymaximum
maximum storm surges
surges for thethe period
period to 2020.
2000 to 2020.
Figure 10. The
Figure 99th
10. The percentile
99th ofofdaily
percentile dailymaximum
maximum significant waveheights
significant wave heightsfor
for the
the period
period 2000
2000 to to 2020.
Figure 10. The 99th percentile of daily maximum significant wave heights for the period 2000 to
2020.
2020.Atmosphere 2022, 13, 311 15 of 26
6. Results—Climate Change Impacts on Storm Surges and Extreme Waves
Atmosphere 2022, 13, x FOR PEER REVIEW 16 of 27
To provide insight to projected climate change effects on storm surges and extreme
waves in British Columbia coastal waters, the simulation data were sorted by the three
20-year reference periods for comparison (e.g., early-century period; mid-century period;
6. Results—Climate Change Impacts on Storm Surges and Extreme Waves
end-of-century period). The 99th percentiles of daily maximum storm surges and significant
wave To provide
heights, insight to projected
representative of extremeclimate
events,change effects on for
were calculated storm
eachsurges and
period. extreme
Values for
waves
the mid-inand
British Columbia coastal
end-of-century periods waters,
were the simulation
compared data were
to baseline sorted by the
(early-century three 20-
values) to
year reference
evaluate projectedperiods for in
changes comparison
extreme storm(e.g.,surges
early-century period;wave
and significant mid-century period;
heights through
end-of-century
the 21st century.period). The 99th percentiles of daily maximum storm surges and signifi-
cant wave heights, representative of extreme events, were calculated for each period. Val-
6.1.
ues Storm
for theSurges
mid- and end-of-century periods were compared to baseline (early-century
values) to evaluate
Projected changes projected
in the 99thchanges in extreme
percentiles storm
of daily surges and
maximum stormsignificant
surges at wave
mid-
heights through
century the 21st century.
and end-of-century (expressed as a percentage relative to early-century values)
are shown in Figures 11 and 12, respectively, for the 4-member model ensemble (members
6.1.indicated
are Storm Surges
by their driving GCM-RCM). Multi-model means and multi-model maxima
are also shown.changes
Projected Positiveinvalues
the 99th(red) and negative
percentiles values
of daily (blue) indicate
maximum increases
storm surges and
at mid-
decreases
century andrelative to the early-century
end-of-century (expressed period, respectively.
as a percentage relative to early-century values)
Three of
are shown in the simulations
Figures 11 and 12,predict slight, widespread
respectively, increases
for the 4-member in the
model 99th percentile
ensemble (members of
daily maximum storm surges in British Columbia waters by the mid-
are indicated by their driving GCM-RCM). Multi-model means and multi-model maxima and end-of-century
periods. The exception
are also shown. Positiveisvalues
the simulation
(red) anddriven
negativeby values
GFDL-ESM2M.WRF,
(blue) indicate which shows
increases and
projected decreases throughout the domain of interest.
decreases relative to the early-century period, respectively.
Figure 11. Projected changes in the 99th percentile of daily maximum storm surges by mid-century
Figure 11. Projected changes in the 99th percentile of daily maximum storm surges by mid-century
(2006–2025 to 2031–2050) for RCP8.5.
(2006–2025 to 2031–2050) for RCP8.5.You can also read