Northern Saskatchewan Regional Training Needs Assessment Report 2011 2012 - Making the connection to training and employment opportunities in ...
←
→
Page content transcription
If your browser does not render page correctly, please read the page content below

Northern Saskatchewan
Regional Training Needs Assessment Report
2011 - 2012

                                Making the connection to training
                                 and employment opportunities in
                                         northern Saskatchewan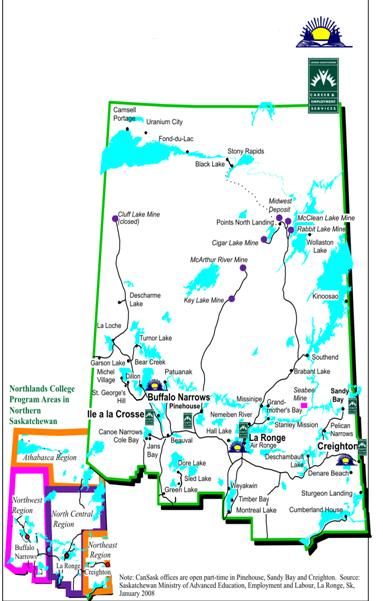
Northern Saskatchewan Regional Training Needs Assessment Report 2011 – 2012

Making the Connection to Training and Employment Opportunities in Northern Saskatchewan April 2011

      This report can be Downloaded from http://career.kcdc.ca/ or www.northlandscollege.sk.ca

                                     Visit us on the Internet at:
                                    www.northlandscollege.sk.ca
                                      http://career.kcdc.ca/
                                        www.aeei.gov.sk.ca
                                       www.sasknetwork.ca

                              The Northern Labour Market Committee
                 c/o Ministry of Advanced Education, Employment and Immigration
                               P.O. Box 5000, La Ronge, SK S0J 1L0
                                        c/o (306) 425-4380

                                        Northlands College
                                          P.O. Box 1000
                                     Air Ronge, SK S0J 3G0              Northlands College
                                          (306) 425-4480                . . . your path to success !

                   Ministry of Advanced Education, Employment and Immigration
                                          P.O. Box 5000
                                      La Ronge, SK S0J 1L0
                                          (306) 425-4380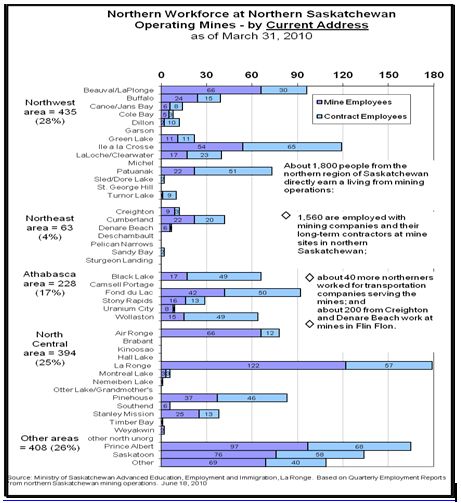
Contents
                                                                                                                                                   Northern Region
Introduction and Summary ..................................................................................... 1
   Introduction .............................................................................................................................. 1                     Northlands College Regional Offices
   Summary.................................................................................................................................... 1
                                                                                                                                                                          Career and Employment Services,
Job and Economic Projections ................................................................................ 2
                                                                                                                                                             Saskatchewan Ministry of Advanced Education,
   Saskatchewan Economy Continues to Grow ...................................................................... 2                                                          Employment and Immigration
   More Education means More Employment Options and Higher Incomes ................... 3
Population Trends ................................................................................................... 9
   The Region is Large and Served by Divers Jurisdictions and Authorities ...................... 9
   The Populations is Mainly of Aboriginal Heritage, Young and Growing....................... 9
Education and Employment Trends ..................................................................... 12
   Northern Students have Lower Marks, Few Credits, and Take Longer to Graduate . 12
   Adult Education Levels Continue to be Lower in the North ......................................... 17
   Half of the Population is not in the Labour Force, Unemployment is High ............... 18
Employment and Training Challenges ................................................................. 19
   People of the Region Often Require Student Training Supports................................... 19
   Many Adults Lack the Prerequisites for Training Programs or Employment.............. 20
Key Regional Industries and Employment Opportunities ................................... 21
   Mining and Exploration Industries Projected to Need More Workers......................... 21
   Oil and Gas Industries Project a rebound in the Industry and Need for Workers ..... 30
   Forestry Industry is almost at a Standstill but Prepares for a Brighter Future ............. 35
   A Growing Construction Labour Force will Increase the need for Training............... 40
   Health, Education and Government Services Offer Many Job Opportunities............ 45
   Commercial Services Sector Looks for Workplace Essential Skills ............................... 54
Connecting People to Jobs .................................................................................... 59
   Explore your Career Options............................................................................................... 59
   Get a Grade 12 Diploma ...................................................................................................... 63
   Upgrade your Essential Skills – What are They?............................................................... 65
   Know what to Expect at your First Job ............................................................................. 65
   Consider a Job in a Trade and Apprenticeship Training ................................................. 66
Northlands College Training Plan and Priorities.................................................. 67
Sources and Methodology ..................................................................................... 73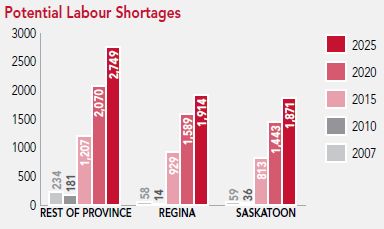
Introduction and Summary

Introduction

 This report fulfills two obligations – the mandate of the Northern Labour Market Committee to produce a labour market report and
 Northlands College’s requirement to produce a report on the region’s training needs. The aim is to provide training agencies and policy
 makers with demographic and labour market information and trends upon which to identify and address education and training needs
 through partnerships and consultations. The report also serves to share information with the public and with students about the northern
 half of Saskatchewan, its residents, its economy, and its training and employment opportunities. In addition to this report, ongoing
 consultations and information sharing through the Northern Labour Market Committee, Northlands College, and other provincial, First
 Nations and Métis institutes and funders help to ensure that training plans are linked to labour market needs.
           Qualifier – Check for up to date Information
           In pulling together this information, the writers have tried to be as up-to-date and accurate as possible. Readers are
           advised, however, to verify the information with the relevant companies and agencies before using it to make
           decisions. The information in this profile is not intended to be used as a sole resource for information.
           For contact numbers, see the section on Connecting People to Jobs and Sources.

Summary

 The regional economy, primarily service and resource-based, has shown signs of improvement since the global economic downturn: mineral
 exploration and mine developments are proceeding again after some slowed activity, and are expected to create new employment
 opportunities. Skilled trades people are needed in almost every trade and across every sector – from mining and construction to service
 sectors. In health care, education, child care, and social work, there are many job opportunities – both new jobs and turnover. Business
 and tourism services are growing and creating new jobs to serve a growing and more prosperous population.

 Residents of the region are filling many of the available entry level and technical jobs at northern mine sites and many of the teaching jobs in
 northern schools, a result of provincial government-industry efforts in these sectors. Mine employers, however, continue to encounter
 challenges in recruiting residents for positions beyond entry level. Schools and health authorities in some communities continue to have
 high turn-over rates of professional workers. The service sector also often has difficulty in recruiting entry level workers who possess the
 necessary essential work skills. Over half of the working age population have less than high school education and might not have the basic
 education, skills, or experience required for jobs in the current labour market. Consequently, many people are unemployed, underemployed
 or have dropped out of the workforce altogether. At the same time, most industries are moving to higher technologies and computerization,
 requiring a highly skilled workforce with technical and professional training.

 Northern Saskatchewan Regional Training Needs Assessment Report 2011-2012                                                              Page #1
Gaps in education are first noticeable in the elementary grades where northern students’ proficiencies in reading, writing, and math are significantly below provincial norms. Some students discontinue school before they reach high school. Of those students who achieve a Grade 12 diploma, the students are sometimes unprepared for post-secondary training or the workforce because they lack prerequisites or workplace essential skills. The northern region is home to 21% of the Aboriginal people of the province. This young and growing population will be an important source for the future provincial and regional workforces, and need to be active participants in the workforce. To achieve this, partners in education and training are working with industry to overcome education barriers. Job and Economic Projections Saskatchewan Economy Continues to Grow A Saskatchewan government news release (December, 2010) predicts the provincial economy will increase 3.7% in 2011. On February 18, 2011 the Conference Board of Canada predicted that Saskatchewan will lead Canada in economic growth in 2011-12 Higher commodity prices, continued population growth, gains in the energy sector, a significant rebound in agriculture and increased activity in resource development are key factors cited in the CBOC report, providing the basis for even stronger growth (4.5 per cent in real GDP) anticipated in 2012. Non-residential investment spending is a major element as well, driven by billions of dollars in expansion projects currently underway in the potash industry. (Source: www.gov.sk.ca/news) While unemployment rates in Saskatchewan are improving, those in the north remain noticeably high. Service Canada’s April 2011 reporting indicates the March – April 2011 unemployment rates in the province are: northern Saskatchewan 18.9%; Regina, 4.9%; Saskatoon 5.7%; and southern Saskatchewan, 7%. A report on labour market issues in Saskatchewan predicts that the provincial workforce will be sufficient to meet the growth of an additional 10,000 jobs each year in the short term. After 2013, however, a significant increase in participation is needed from under-employed groups like Aboriginal people to meet employers’ need for workers. Aboriginal people have historically had low employment rates – challenges to increase their employment include: Page #2 Northern Saskatchewan Regional Training Needs Assessment Report 2011-2012
Limited work experience opportunities in small towns;
Many jobs are seasonal or short term;
Low levels of schooling; and
Many who are not working live in remote communities and would have to relocate.
The northern region is home to 21% of the province’s Aboriginal people. This young and under-employed
population has the potential to fill many existing and projected job vacancies.
More Education means more Employment Options and Higher Incomes
Higher education often means more employment choices and less unemployment. In northern Saskatchewan, people with less than a high
school education had 31% unemployment compared to only 3% of people with a university degree.
Employment by education level for Northern Saskatchewan - %
lower unemployment rate and greater employment as
level of education increases
3
University degree Unemployment rate %
83 %
Post-secondary 12
certificate or diploma 71 Employment rate %
Apprenticeship or 17
trades certificate 65
High school 17
Source: Statistics Canada, 2006 Census of
certificate 52 Population, Statistics Canada. Geography
= Division No. 18 [1]. Catalogue no. 97-
No high school 31 559-XCB2006020. March 4, 2008
certificate 23
More education can mean significantly higher earnings, with full-time workers who have a university degree earning double the amount
earned by workers with less than high school.
Northern Saskatchewan Regional Training Needs Assessment Report 2011-2012 Page #3Saskatchewan median earnings by education level
for full time earners age 25 to 64
Masters/PHD degree $65,806
Bachelor degree $55,531
University below bachelor $45,655 Statistics Canada. 2008.
Median(1) 2005 earnings for
full-year, full-time earners by
College $39,166
education, both sexes, total -
age group 25 to 64, for
Canada, provinces and
Trades or apprenticeship $37,226
territories, and census
subdivisions (municipalities)
High school $33,060 with 5,000-plus population –
20% sample data . Income
and Earnings Highlight Tables.
Less than high school $28,668 2006 Census.
The cost of dropping out of school is high – now as well as later in the person’s life. The cost is also high for governments. According to
the study Cost Estimates of Dropping out of High School in Canada, people who do not complete high school:
are more likely to experience more illnesses and not live as long. There is a strong link between education and health in a range of
illnesses like diabetes, obesity, some mental illness, and heart disease.
are more likely to rely on public services and assistance; 33.6% of high-school dropouts receive income assistance, at a cost of $4,230
per dropout or $969 million each year.
make up a high proportion of the prison population. The estimated annual total cost to the criminal justice system (including
incarceration) is $244 per high school leaver or $350 million each year.
have higher unemployment as well as lower earnings of about $3,500 less each year than earnings of those with a
Grade 12. Governments also lose out, earning less income tax and paying out more in Employment Insurance.
Page #4 Northern Saskatchewan Regional Training Needs Assessment Report 2011-2012Industries Forecast to have the Highest need for Workers
Saskatchewan’s Hot Industries
Professional and Business Services Personal and Household Services
Health Care and Social Assistance Construction
Agriculture Source: Labour Market Issues in Saskatchewan
Saskatchewan’s Hot Jobs – to 2013
Projected best employment opportunities (www.saskjobfutures.ca)
Job Area and Occupation Average Annual
Education Required
(those in bold are projected to have the highest demand) Wage
Social Science, Education and Government
Business Development, Marketing, Research $63,900 University Degree
Community and Social Service Worker $41,000 College Certificate or College Diploma
Early Childhood Educator/ Assistant $22,400 College Certificate or College Diploma
Educational Counsellors $55,600 University Degree
Elementary School Teacher/Education Administrators and Principals $60,000 - $90,000 University Degree
Employment Counsellors $51,900 University Degree
Lawyer $116,900 University Degree
Probation and Parole Officer $69,200 College Diploma or University Degree
Psychologist $72,600 University Degree
Secondary School Teacher $60,000 University Degree
Social Worker $58,700 University Degree
University Professor $94,400 University Degree
Business
Accountant, Auditor $71,100 University Degree
Administrative Clerk/ Officer $42,400 - $52,800 Job-Specific Training/College Diploma
Bank Teller, Financial Clerk $41,600 High School and Job-Specific Training
Bookkeeper $34,900 College Diploma
Clerk – Data Entry, Payroll, File, Personnel, Accounting $35,000 - $42,000 High School and Job-Specific Training
Human Resource Specialist $75,800 University Degree
Personnel Officer $60,600 College Diploma
Receptionist, File Clerk, General Office Clerk $38,000 High School andJob-Specific Training
Secretary $37,900 College Diploma
Northern Saskatchewan Regional Training Needs Assessment Report 2011-2012 Page #5Job Area and Occupation Average Annual
Education Required
(those in bold are projected to have the highest demand) Wage
Sciences
Air Pilot $118,200 College Diploma
Biological Technician/ Technologist $60,900 University Degree
Chemical Technologist/Technician $57,600 College Diploma
Drafting Technologist $53,800 College Diploma
Engineers – Industrial, Mechanical, Electrical, Chemical $85,000 - $121,800 University Degree
Geological Technician $62,700 College Diploma
Geologist $104,000 University Degree
Information Systems Analyst $70,500 University Degree
Instrument Technician $80,000 College Diploma
Land Use/ Urban Planner $68,600 University Degree
Mechanical Engineer Technician $67,700 College Diploma
Survey Technologist/ Technician $37,400 College Diploma
Health
Dental Technician/ Technologist/ Assistant $48,800 College Diploma
Dental Therapist/ Hygienist $67,600 College Diploma
Dentist $165,800 University Degree
Health Managers $72,200 University Degree
Medical Lab/ Radiation Technician/Technologist $49,000 - $59,000 College Diploma
Nurse $72,400 University Degree
Nurse Aide $35,200 High School and Job-Specific Training
Nurse Assistant/ Licensed Practical Nurse $49,400 College Diploma
Nurse Supervisor $73,500 University Degree
Occupational/ Physio Therapist $61,000 - $69,000 University Degree
Optometrist $93,500 University Degree
Paramedic/ Ambulance Attendant $62,000 - $67,000 College Diploma
Pharmacist $95,100 University Degree
Physician $181,000 University Degree
Speech and Hearing Specialist $85,300 University Degree
Veterinarian $83,500 University Degree
Page #6 Northern Saskatchewan Regional Training Needs Assessment Report 2011-2012Job Area and Occupation Average Annual
Education Required
(those in bold are projected to have the highest demand) Wage
Sales and Service
Armed Forces $63,000 High School and Job-Specific Training
Cashier $22,000 Less than High School
Cook, Chef $48,700 College Diploma
Baker, Butcher $35,800 College Diploma
Correctional Service Officer $62,900 High School and Job-Specific Training
Fire Fighter $62,900 College Diploma
Food and Beverage Server $31,100 High School and Job-Specific Training
Food Preparation $22,000 Less than High School
Hair Stylist $42,300 College Diploma
Hotel Front Desk Clerk $26,500 High School and Job-Specific Training
Police Officer $85,300 College Diploma
Restaurant/ Retail Store Manager $36,000 – $53,000 College Certificate
Sales Clerk $39,300 High School and Job Specific Training
Security Guard $33,600 Job-Specific Training
Store Supervisor $36,400 College Diploma
Teacher Assistant $26,000 High School and Job Specific Training
Trades
Auto Mechanic/ Service Technician $70,700 Apprenticeship/ College
Bus and Delivery Drivers $34,800 High School and Job-Specific Training
Cabinet Maker $35,000 Specific Training
Carpenter $64,300 Apprenticeship/ College
Cement Finisher $45,200 Apprenticeship/ College
Crane Operator $73,300 Apprenticeship/ College
Driller/ Blaster $42,100 Apprenticeship/ College
Electrician $73,200 Apprenticeship/ College
Floor Covering Installer $34,800 Apprenticeship/ College
Gas Fitter $75,400 Apprenticeship/ College
Heavy Equipment Mechanic $81,900 Apprenticeship/ College
Heavy Equipment Operator $73,100 High School and Job-Specific Training
Industrial Mechanic $75,700 Apprenticeship/ College
Machinist $68,700 Apprenticeship/ College
Material Handlers $40,600 High School and Job-Specific Training
Northern Saskatchewan Regional Training Needs Assessment Report 2011-2012 Page #7Job Area and Occupation Average Annual
Education Required
(those in bold are projected to have the highest demand) Wage
Trades Continued
Painter $37,800 Apprenticeship/ College
Plumber/ Pipefitter $68,600 Apprenticeship/ College
Roofer/ Shingler $39,900 Apprenticeship/ College
Sheet Metal Worker $64,500 Apprenticeship/ College
Taxi Driver $21,600 High School and Job-Specific Training
Trade Supervisors $52,000 – $128,000 Apprenticeship/ College
Trades Helper $36,900 Less than High School
Truck Driver $47,100 High School and Job-Specific Training
Welder $79,100 Apprenticeship/ College
Mining and Processing
Labourers in Mining and Oil and Gas $62,900 Less than High School
Mine Support Worker, Underground $75,900 College Diploma/ Trade
Miners, Underground $84,500 College Diploma/ Trade
Oil and Gas Well Drillers $85,500 High School and Job Specific Training
Process Operators/ Mill Operators $77,200 College Diploma/ Trade
Process Supervisors $106,100 College Diploma/ Trade
Supervisors in Mining and Oil/Gas $102,000 College Diploma/Trade
Water and Waste Plant Operator $50,500 College Diploma
NOTE: “College” here refers to a technical institute like SIAST or a Saskatchewan regional college – like Northlands College – that purchases and
delivers programs from a technical institute.
Source: Saskatchewan Job Futures website as of January 5, 2010 (Government of Canada and Saskatchewan Ministry of Advanced Education, Employment
and Immigration) www.saskjobfutures.ca. Relevance 2011, Career Options for Your Future, produced in partnership with Credenda Virtual High School,
Saskatoon Industry-Education Council, Government of Saskatchewan, and Service Canada, January 2011.
Page #8 Northern Saskatchewan Regional Training Needs Assessment Report 2011-2012Population Trends
The Region is Large and Served by Diverse Jurisdictions and Authorities
The northern region of Saskatchewan has 35 municipalities and 12 First Nations served by two First Nations Councils (Meadow Lake
Tribal Council and Prince Albert Grand Council), four Métis regions, three provincial school divisions (Northern Lights, Ile a la Crosse
and Creighton), four health authorities (Mamawetan Churchill River, Keewatin Yatthe Health District, Athabasca Health Authority,
and Kelsey Trail Health District which serves Cumberland House municipality and First Nation), and two post-secondary training
institutes (Northlands College, and NORTEP/ NORPAC). Dumont Technical Institute and Saskatchewan Institute of Technologies
also provide training opportunities in northern Saskatchewan.
The area is large, with few roads, sparse populations and several remote communities.
The “North” covers 46% of the Province of Saskatchewan (land mass of 268,499 square kilometres) yet consists of less than 4% of the
provincial population.
Partnerships are key to delivering programs and services in the region because of the size
of the area and the many administrative jurisdictions. Health district populations in northern
Saskatchewan region
The Population is Mainly of Aboriginal Heritage, Young and Growing 25,000
22,766
One of every five Aboriginal people in Saskatchewan lives in the northern region (21%). 20,000
15,000
11,199
Almost 9 of every 10 people in the northern region are of Aboriginal heritage – 86% 10,000
compared to 15% provincially and 4% nationally.
5,000 2,435 1,496
About half the region’s residents live in reserve communities in contrast to 5% of the 0
Mamawetan Keewatin Athabasca Kelsey Trail
overall Saskatchewan population. Churchill River Yatthé Health
Health Authority
Health
Authority
Health
Authority
Note: Cumberland House First Nation and municipality
Authority
are party of Kelsey Trail HD. Source: Ministry of Health
Covered Population 2009, Regina
Northern Saskatchewan Regional Training Needs Assessment Report 2011-2012 Page #9 The northern region’s Aboriginal population grew by 2,365 people – a rate of 8% in 5 years. The largest Aboriginal group is people of
First Nations heritage (primarily Cree and Dene) who make up 62.3% of the total population. People of Métis heritage make up 22%
of the population and non-Aboriginal people form 14% of the north, as shown in the next chart. With the enactment of Bill C3 the
percentage of Métis will decline and the First Nations total population will increase.
Aboriginal People's share of total population is on the rise
100% 86%
Northern Saskatchewan
80%
Saskatchewan The Aboriginal population accounts
60% for 86% of the northern region
Canada population. It grew 8% between
40% 2001 and 2006 while the non-
20% Aboriginal population declined by
15%
20% 4% 8% 9% 5% 10%
0%
Statistics Canada. 2008. Aboriginal
-3%
-20% -10% Population Profile. 2006 Census. Statistics
Canada Catalogue no. 92-594-XWE.
Aboriginal Identity Aboriginal Non-Aboriginal Ottawa. Released January 15
population Population % Population % 2008.www12.statcan.ca/english/census06/
data/profiles/aboriginal/index.cfm?Lang=E
change 2001 to change 2001 to
2006 2006
43% are under age 20 compared to 25% provincially. Only 23% are over age 44 compared to 41% provincially, as charted below.
Young population in northern Saskatchewan region
30% 43% of the population in
26%
the northern region is
25% Northern Region
under age 20 - a much
Saskatchewan higher proportion than
20% 18% the 25% under age 20
13% 13% 15% in the province as a
15% 12% 13% 12% whole. Only 23% are
10% 10% 11%
9% over age 44 compared
10% 6% 7% 7% to 41% provincially.
6% 6% 5%
Source Ministry of
5% Health Covered
Population 2009,
0%
Regina. Aboriginal people represent 93% of the pre-school and school age populations.
Percentage of the population who are Aboriginal - by age group
Northern Saskatchewan Saskatchewan
100% 93% 93% 93% 92% 91% 85% 85% 86%
Statistics Canada.
80% 71% 68%
2007. 2006 Census.
2006 Community
Profiles, Statistics
60% Canada Catalogue no.
92-591-XWE. Released
March 13/2007.
40% 29% 27%
2008 Aboriginal
25% 22% Population Profile,
18% 17% 15% 15% Statistics Canada
20% 8% Catalogue no. 92-594-
3% XWE. Ottawa.
Released January 15
0% 2008
Change in the number of people by
www12.statcan.ca/engli
age group in northern Saskatchewan
er
n
s
s
s
s
s
s
s
s
ar
ar
ar
ar
ar
ar
ar
ar
tio
ov
sh/census06/data/profil
ye
ye
ye
ye
ye
ye
ye
ye
la
Census 1996 to 2006
d
es/community/
u
14
19
24
29
44
64
4
9
an
op
to
to
lp
to
to
to
to
to
to
s
ar
0
5
Total Population
ta
10
15
20
25
30
45
ye
To
2,795
65
65+ 450
55-64 645
45-54 1,130
35-44 605
25-34 -615
20-24 230
The population is growing primarily in age groups over age 34. Subtotal 0-19 350
The number of northern children aged 0 to 9 has declined in the past 10 years. 15-19 875
It is projected that by 2021, the north will see an increase in the number of children as 10-14 450
The current large number of youth age 10 to 19 move into the main child-bearing age. 5-9 -495
0-4 -480
-1,000 - 1,000 2,000 3,000
Northern Saskatchewan Regional Training Needs Assessment Report 2011-2012 Page #11Education and Employment Trends
Northern Student have Lower Marks, Fewer Credits, and take Longer to Graduate
There are many important factors associated with a child’s school successes and their pathway from education to the labour market.
o The Youth in Transition Survey found that children in the following groups are more at risk of not finishing school: those of
Aboriginal heritage, those with a greater number of brothers and sisters, those from single parent homes, and youth who are teen
parents. The northern region has a higher proportion of its population in all of these categories. The report stressed that
children have higher educational attainment if their parents have high expectations for them, are supportive, and engaged in their
education. Youth with parents who had a high level of education were themselves more likely to go to post-secondary training
prior to entering the labour market.
o The education system itself can also affect a child’s success including factors such as unscheduled school closures that shorten
the number of teaching days, high teacher turnover, shortage of teachers with specialization in math and sciences, and curriculum
that cannot be covered in the time allotted.
In contrast to declining rural school populations, the school population in the northern region is remaining fairly constant at just over
10,000 students. Provincial K-12 school enrolment was 5,053 in autumn 2009. First Nations schools in northern Saskatchewan had 5,254
enrolments (2007-8); they make up about one-third of all First Nations school enrolments in the province.
Student Enrolment in Provincially Funded Schools, by Grade Level and Location
Saskatchewan 2007-2008 to 2009-2010
Urban Rural North
Early Entrance 196 52 0
Kindergarten 6,679 3,424 329
Elementary (Grades 1-5) 34,984 19,392 1,937
2007-2008
Middle (Grades 6-9) 31,282 17,081 1,605
Secondary (Grades 10-12) 29,559 12,845 1,244
TOTAL 102,700 52,794 5,115
Early Entrance 196 55 0
Kindergarten 6,857 3,605 335
Elementary (Grades 1-5) 34,743 19,460 1,908
2008-2009
Middle (Grades 6-9) 30,576 17,043 1,560
Secondary (Grades 10-12) 28,933 12,674 1,209
TOTAL 101,305 52,837 5,012
Early Entrance 128 84 0
Kindergarten 7,274 3,486 344
Elementary (Grades 1-5) 35,892 18,827 1,910
2009 - 2010
Middle (Grades 6-9) 30,557 16,556 1,535
Secondary (Grades 10-12) 29,229 12,405 1,264
TOTAL 103,080 51,358 5,053
Page #12 Northern Saskatchewan Regional Training Needs Assessment Report 2011-2012Northern school students are less successful in moving up one grade each year.
Number of Northern Provincial school
enrolments by grade are fairly constant Grade one students: 92% of Saskatchewan’s students moved up to grade 3 within
3 years compared to 73% in the north.
2,000 1,952 1,937 1,908 1,910
1,800
1,605
Kindergarten
Grade four students: 97% of Saskatchewan’s students moved up to grade 6 within
1,589 1,560 1,535
1,600 Elementary (gr 3 years compared to 86% of northern students.
1,400 1,240 1,244 1,264 1-5)
1,209
1,200 Middle (gr 6-9)
1,000
Secondary
800 (gr10-12)
600
400 Source: 2009
363 Saskatchewan
200 329 335 344
Education Indicators
- Report Ministry of
2006-7 2007-8 2008-9 2009-10 Education, (Dec 2009)
Regina. Northern Grade 7 Students less
successful in moving ahead
Total Students Self-Declared Aboriginal North
The chart opposite shows Grade seven students: 91% of provincial students
moved up to grade 10 within 3 years compared to 68% of northern 100%
97%
92% 95%
91%
87% 89%
grade 7 students. 90% 80% 78%
Enrolments
80% include all
Three years after starting Grade seven, 29% of northerners were continuing 70%
68% students in all
schools-provincial
previous grades compared to just 5% of provincial students. 60% and First Nations.
50% Source: 2009
40% Saskatchewan
Education
30%
Indicators Report
20% Ministry of
10% Education, (2009)
0% Regina. P 93
One year Two years Three years
later 2006-7 later 2007-8 later 2008-9
moved up to moved up to moved up to
Grade 8 Grade 9 Grade 10
Northern Saskatchewan Regional Training Needs Assessment Report 2011-2012 Page #13For northern students who do move up to Grade 10, there appears to be a hold-up in Grade 10 for many students. The number of grade
10 enrolments in provincial schools is double the number of enrolments in grade 11, as charted below.
Number of Northern provincial high school enrolments by grade
High school
1,600 enrolments
continue to
1,200 increase.
800 There is a balloon
of enrolments in
400 grade 10 - double
the number in
grade 11.
-
1996- 1997- 1998- 1999- 2000- 2001- 2002- 2003- 2004- 2005- 2006- 2007- 2008-
7 98 99 2000 01 02 03 04 05 06 07 08 09
Source: Saskatchewan
12 195 205 191 219 231 226 264 203 183 207 200 246 370 Ministry of Education,
11 255 214 239 216 230 292 264 238 250 250 289 282 281 Provincial
Examinations, Student
10 326 361 448 386 465 417 510 553 527 602 587 597 613 and Teacher Services ,
9 291 303 324 303 316 299 424 352 396 391 379 418 406 Regina. Dec. 19, 2009.
Northern high school students spend less time on mathematics and sciences classes than students in rural or urban schools. Students
spend a higher proportion of their time in Language Arts, Practical and Applied Arts, and Social Studies. (source: 2009 Education Indicators
Report, Data includes First Nations and provincial schools)
The 2010 Saskatchewan Education Indicators Report shows that in 2009-10 northern students perform below the average marks for selected
grade ten and eleven courses as evidenced in the following charts. Northern self-declared aboriginal males have the lowest average
grade 10 marks.
Average Marks for Selected 10 and 20 Level Courses, by Student Characteristic, 2009-2010
Urban Rural North
Non Aboriginal
Male Female Male Female Male Female
English Language Arts A 10 68.4 % 76.2 % 70.0 % 78.2 % 65.7 % 70.1 %
English Language Arts B 10 63.1 % 75.9 % 70.5 % 78.9 % 61.3 % 63.9 %
Science 10 69.1 % 73.5 % 69.8 % 75.5 % 62.2 % 64.9 %
Mathematics 10 68.6 % 73.3 % 71.1 % 76.5 % 58.5 % 59.1 %
English Language Arts 20 67.8 % 76.5 % 70.3 % 80.6 % 57.9 % 68.0 %
Biology 20 67.6 % 73.6 % 70.0 % 77.9 % 62.3 % 73.4 %
Mathematics 20 67.7 % 71.9 % 69.8 % 75.4 % 63.9 % 66.5 %
Urban Rural North
Self- Declared Aboriginal
Male Female Male Male Female Male
English Language Arts A 10 55.7 % 62.3 % 55.2 % 61.1 % 49.8 % 58.6 %
English Language Arts B 10 56.6 % 61.8 % 53.4 % 60.6 % 50.6 % 58.1 %
Science 10 53.0 % 55.3 % 54.0 % 59.2 % 51.0 % 55.1 %
Mathematics 10 54.0 % 56.8 % 52.6 % 57.1 % 49.7 % 54.5 %
English Language Arts 20 57.1 % 62.9 % 55.6 % 63.4 % 57.3 % 58.8 %
Biology 20 56.0 % 57.4 % 58.1 % 62.1 % 58.7 % 61.0 %
Mathematics 20 57.5 % 59.2 % 56.3 % 58.9 % 54.7 % 57.9 %
Page #14 Northern Saskatchewan Regional Training Needs Assessment Report 2011-2012 The gap between the average marks of northern students and the provincial averages is large, particularly for northern Aboriginal
students. The average marks for northern self-declared Aboriginal males are from 12 to 23% lower than provincial marks: their
performance in level 10 subjects was lower than the 50% mark generally accepted to progress to the next level, as the chart depicts.
Range of Average Marks for Selected courses - Northern Students
achieve lower average marks
Provincial Average North Female North Male North Aboriginal Female North Aboriginal Male
% 80 70 70 70 69 70 69 71 70 70 69
67 68
70 63 63 63
65
61
63 62
59 59 58 58 56
57
60 56
52 54
49 48 49 50 50 50
47
50
40
30
20
10
0
English English Science 10 Math 10 English Biology 20 Math 20
Language Arts Language Arts Language Arts
A10 B10 20
Includes First Nations and Provincial schools in the north. Source: 2009 Saskatchewan Education Indicators
Report Ministry of Education, (2009) Regina.
In addition, northern self-declared Aboriginal students generally having lower marks than the provincial averages, their performance at
all grade levels is significantly below provincial norms in terms of being adequate or proficient in provincial assessments.
The average northern student earns about 5 credits each year – significantly below the average of 8 credits earned by most students in
the province – and the number of credits that northerners earn is declining each year. To graduate, students must have 24 high school
credits: earning 5 credits each year means that the average northern student will take 5 years to complete high school compared to the
3 years typically taken.
Northern Saskatchewan Regional Training Needs Assessment Report 2011-2012 Page #15 Three-quarters of Saskatchewan’s students graduate within 3 years of starting grade 10 compared to only 22% of self-declared
Aboriginal males from the northern region. In the northern region:
Percentage of Students Completing
Grade 12 within 5 years of starting
Grade 10 in 2004-05 Includes all
enrolments
100% 94% 94% 97% from
o 97% of students in Creighton School Division area complete grade 12 90% 3 years or less Provincial and
80% 81% 4 years First Nations
within 5 years, exceeding the provincial graduation rate of 81%. 80% 76%
5 years
schools and
70% all grads in
Grade 12,
60% Adult
52% 50%
50% 46% Secondary
o In comparison, 50% of students in the Ile a la Crosse and Northern 40%
41% and
Alternative
30%
Lights School Division areas had completed within 5 years. 30% 26% Education.
20% Source: 2009
10% Saskatchewan
Education
0% Indicators
Total Creighton Ile a la Northern Report Ministry
School Crosse Lights of Education,
Division School School (2009) Regina.
Division Division P 99
Compared to a decade ago, more northern students are graduating from Grade 12 or gaining Adult Secondary diplomas, 343 graduated
from provincial, First Nations and post-secondary grade 12 programs in the north in 2008-09 as charted below.
343 Graduates of Northern Saskatchewan Grade 12 Programs -
Provincial and First Nations Schools - Regular/French,
Adult Secondary, and Alternate Education
400
Alternative Adult Secondary Graduates 5
350 Adult Secondary Graduates 76 1
300 Regular Grade 12 Program Graduates 81 97 53
75
250 Alternate Education Program Graduates 71 53
65 63
200
66
150 25 61 65 55 280 254 258
7 219 241 235
100 3
175 177 198
118 129 109 118 118 134
50 99
1 2 3 2 6 5
0
1993-4 1994-5 1995-6 1996-7 1997-8 1998-9 1999- 2000-1 2001-2 2002-3 2003-4 2004-5 2005-6 2006-7 2007-8 2008-9
00
Source: Saskatchewan Ministry of Education, Provincial Examinations, Student and Teacher Services, Regina. December 21, 2009
Page #16 Northern Saskatchewan Regional Training Needs Assessment Report 2011-2012 The previous chart partially reflects the growth in the number of people of high school age (age 15 to 19): this age group has grown by
25% since 1993; however, the number of graduates from regular grade 12 programs has grown by over 150%.
Adult Education Levels Continue to be Lower in the North
Although the population is young and growing, a lower proportion of northern youth in their teens and early twenties attend school or
post-secondary training and a lower proportion are employed compared to the province.
The adult population is starting to show trends of improving education levels similar to trends in the rest of the province, however, the
labour force in general still has a sizable gap to cross to achieve provincial education and employment averages. A high proportion of
the labour force has less than a grade 12 education - 58% compared to 30% of the provincial population – as shown below.
Highest Level of Completed
Education - Northern Region Saskatchewan
University University
Less than
Postsec degree degree
high
certificate/ 6% 13%
school
diploma 30%
20%
Postsec
Less than certificate/
high diploma
completed
school 30%
high
58%
school completed
16% high
school
27%
Source: Statistics Canada, Census 2006, Statistics Canada Released
March 2008 Ottawa www.statcan.ca/english/census06/data/
Northern Saskatchewan Regional Training Needs Assessment Report 2011-2012 Page #17Half of the Population is not in the Labour Force, Unemployment is High
Participation in the labour force is low. Half of the people age 15 and over are not participating in the workforce despite the fact that
the population has such a large proportion of young adults. The half who are participating in the labour force – working or looking for
work – have an unemployment rate of almost 20% compared to an overall average of 6% provincially.
Percentage rate of Employment and Participation are lower in
% Northern Saskatchewan - Census 2006
80
68.4
70 64.6 Division No. 18 (Census
60 50.4 division)
50 40.3
Saskatchewan
40 (Province)
30 20.2
20
10 5.6
0
Participation rate Employment rate Unemployment rate
The number of people gaining employment has grown, but the population has grown faster than the number getting jobs. In the last
five years, the number of people over age 15 in the north has grown by 2,200 people, however, only 800 more people are working. No
gains, therefore, have been made since 1991 to increase the percentage of working adults in the workforce or reduce unemployment.
Of the northern Saskatchewan labour force employed at the time of Census 2006, the majority were employed in education, health care
and public administration (governments). The median age of those employed was 40, similar to the median age for Canada as a whole.
The sector with the youngest workers was retail with a median age of 33 while public administration/ governments has the oldest
median age at 41 (from a 20% sample).
Page #18 Northern Saskatchewan Regional Training Needs Assessment Report 2011-2012Industry Employment by age group for Northern Saskatchewan
0 200 400 600 800 1000 1200 1400 1600
11 Agriculture, Forestry, Fishing and Hunting 15 to 24
21 Mining and Oil and Gas Extraction
22 Utilities 25 to 54
23 Construction 55 and over
31-33 Manufacturing
41 Wholesale Trade
44-45 Retail Trade Statistics Canada. Census
48-49 Transportation and Warehousing 2006,Statistics Canada.
51 Information and Cultural Industries Released March 2008.
52 Finance and Insurance Ottawa.
53 Real Estate and Rental and Leasing www12.statcan.ca/english/c
54 Professional, Scientific and Technical ensus06/data/
55 Management of Companies and Enterprises
56 Administrative and Support, Waste
61 Educational Services
62 Health Care and Social Assistance
71 Arts, Entertainment and Recreation
72 Accommodation and Food Services
81 Other Services (except Public Administration)
91 Public Administration
Employment and Training Challenges
People of the Region often Require Student Training Supports
Childcare is an issue for many people taking training. People tend to have children earlier and families tend to be larger compared to
Saskatchewan as a whole. A higher proportion of families are single-parent families: 38% compared to 17% provincially.
Incomes are much lower in the northern region than in Saskatchewan generally and a higher proportion of people are on assistance
programs. 23% of all income in the northern region is from government supports. 16% of the northern population lives below the low
income cut-off (where your after-tax income expenditures on food, shelter, and clothing are 20% higher than for the average family).
Northern Saskatchewan Regional Training Needs Assessment Report 2011-2012 Page #19 Homes are more crowded: 14% of homes in the northern region had more than one person per room compared to 1% of homes provincially. Only one-third of dwellings are owned by the occupants compared to three-quarters provincially. More homes in the north need major repairs – one in four compared to one in ten provincially. Training is more often delivered in the larger centres requiring students to pay for a second home during the program. Transportation can be costly. Some people do not own vehicles or have a driver’s license and bus service is not available between most northern communities or locally within communities. For remote communities training in larger centres is approximately 400 air kms away. Many Adults Lack the Prerequisites for Training Programs or Employment Some young adults are not ready for post-secondary training because they lack certain high school classes, particularly maths and sciences, or their marks were not high enough to meet enrolment criteria. Jobs that are available in the region often require higher education, higher skill levels, or more experience. In some small and remote communities, there are often few opportunities for employment or work experience or few working role models – the usual stepping stones to career planning, skill development, and employment. Some people who are working or looking for work are not ready to be mobile to access employment to training in neighbouring communities or regions. Occasionally, entire programs must be cancelled because applicants do not have the education levels required by the programs. Occasionally too, programs must be cancelled because the training institute is unable to recruit qualified instructors, particularly in trades and technical programs; training institutes often cannot compete with industry’s wages. Page #20 Northern Saskatchewan Regional Training Needs Assessment Report 2011-2012
Key Regional Industries and Employment Opportunities
Mining and Exploration Industries Projected to need more Workers
Demand for resources is growing
Saskatchewan has massive uranium reserves that are the largest high grade reserves in the world. Saskatchewan is Canada’s only
producer of uranium and accounted for about 20% of world production in 2009. Known deposits will last for 20 to 30 years at the
current rate of extraction and new deposits are continually being discovered.
The global demand for uranium is expected to accelerate over the next 20 years, driven by concerns over energy security, rising fossil-
fuel prices, and rising carbon dioxide emissions. A large number of countries have expressed renewed interest in building nuclear
power plants: as of January 2011, 443 nuclear power generators were in operation, 62 were under construction and another 158 were
being planned to be in operation by 2030 (World Nuclear Association, www.world-nuclear.org). Potential global impacts on the
nuclear power industry caused by the recent earthquake and subsequent tsunami in Japan have not been realized.
Because of the high cost and recent public comments, the Saskatchewan government is not considering a specific proposal for the
large-scale nuclear power plant in the province at this time. However, the Saskatchewan government is keen to “add value” to the
province’s large uranium mining industry and a new 30 million dollar nuclear medicine and research centre at the University of
Saskatchewan could pave the way for a small nuclear reactor in the province. (Star Phoenix, March 3, 2011)
New uranium mines take from 10 to 15 years to permit and construct; the mining industry will be challenged to meet the projected
demand.
Permanent new sources of medical isotopes, a uranium product, are still required to ensure a stable supply for medical procedures.
There is continued need for nuclear waste facilities, The Nuclear Waste Management Organization (NWMO) will provide $1 million to
the Federation of Saskatchewan Indian Nations, to educate people about nuclear waste storage. Currently, nuclear fuel waste is stored
at several locations in Canada. NWMO is looking to build one location where all spent fuel can be transported and stored. At the end
of three years, NWMO is hoping to find an informed and willing community to host the $24 billion nuclear waste storage facility. The
English River First Nation and Métis community of Pinehouse have shown interest in the project, along with two other communities
in Ontario. (Source: Prince Albert Daily Herald, November 2010 & nbbusinessjournal.com, November 2010)
Northern Saskatchewan Regional Training Needs Assessment Report 2011-2012 Page #21Northern Saskatchewan opportunities in the mineral sector
Exploration expenditures for 2010 remained similar to the 2009 levels at approximately $293 million. This included $102 million for
uranium; $12.5M for diamonds; $7.9M for precious metals; $0.1M for base metals and $171M for industrial minerals (primarily potash).
Exploration companies and contractors are expecting exploration to increase again in 2011 in uranium, potash, coal, base metals, gold
and rare earths.
Jobs in exploration are mainly with contractors and include jobs like geologists, field assistants, camp cooks, drill operators and helpers,
delivery of fuel and camp supplies, line cutters, mechanics, and skidder drivers.
Diamond exploration is currently being focused on an area east and northeast of Prince Albert; gold exploration is primarily northeast
of La Ronge, base metal activity is west and southwest of Creighton and uranium exploration activity is in the Athabasca Region. Some
of the deposits are in more advanced exploration stages, listed in the following table:
Opportunities in Exploration
Cameco continues to work on the environmental assessment process for the proposed underground Millennium uranium mine preparing to
submit the environmental impact statement late in 2011 or early 2012. The company proposes to house workers at Key Lake and truck ore to
an existing mill such as Key Lake, 30 kms away. If approved, and if the partners decide to proceed, construction could commence in 2012 –
2014 employing 350 people. Production would take place from 2018 – 2025 and employ about 270 workers in underground mining, trucking,
and management.
Shore Gold continues the environmental assessment process for an open pit at the Star Kimberlite and, potentially, a second open pit at the
Orion South Kimberlite, including processing facilities, and associated infrastructure east of Prince Albert. The Star Orion South Diamond
Project’s final feasibility study is anticipated to be completed in the second quarter of 2011. Shore Gold will then proceed to work towards
making a production decision which would lead to the development of Saskatchewan’s first diamond mine approximately 60 kms east of Prince
Albert in the Fort a la Corne forest. Open pit mining would start in 2014 – 2026, creating 400-500 jobs for equipment operators, process
operators, mechanics, security workers and millwrights.
Great Western minerals Group has a Preliminary Economic Assessment Report in progress for Hoidas Lake, 50 kms northeast of Uranium
City, The initial premise of the study is for a Rare Earth Elements (REEs) mine and mill in the next 2-3 years with a 20-year mine life. These
estimates are based on the combined indicated and inferred resources of 2.6 million tonnes at 2.431% total rare earth oxide (TREO) in the JAK
Zone. General Western is also evaluating its Douglas River project in the Athabasca Basin, where chip samples returned up to 8.75% TREO.
Shea Creek hosts a world-class uranium system, which includes the Kianna, Anne, Colette and 58B deposits, ranking as the third largest
uranium resource in the Basin. The 2011 exploration expenditures are budgeted at $7.9 million (AREVA 51%; UEX 49%). Work continues
on exploration and development to update shaft design, preliminary mine design, and surface infrastructure.
Hanthor plans to spend the next five or six years searching for ore at the Russell Lake uranium projects. As of February 2011, Hanthor has
completed drilling two of the estimated ten holes expected for this season with approximately $1.6 million being invested in the project.
Hanthor is also spending approximately $5 million in 2011 working to test the Roughrider East uranium discovery, part of the Midwest
NorthEast project.
Page #22 Northern Saskatchewan Regional Training Needs Assessment Report 2011-2012 Mining opportunities in the northern region include four operating mines, two developing mines, and opportunities across the border
at Flin Flon. Companies are proceeding with planning and regulatory approvals so that they are ready to proceed when market
conditions improve. Operations are listed below.
Opportunities at Mine Operations
Claude Resources continues to mine from its Seabee gold mine and starting early 2010, pending environmental approval, will be mining
the Santoy 8 deposit near the Seabee mill. Underground exploration has increased the scale of the Seabee mining operation: at current
estimates of reserves and resources Seabee has the capability to produce for more than ten years at current production rates. Seabee
mine has produced about 880,000 ounces of gold since 1991. In 2010 Seabee produced 47,300 ounces gold and Claude Resources plans
to add ounces from the new Santoy 8 mine, upping annual production to 70,000 ounces over the next few years. Seabee employs over
150 employees in underground mining, milling, and support workers.
Cameco has signed an agreement to supply 29 million pounds of uranium concentrate to China Guangdong Nuclear Power Holding
Company Ltd. (CGNPC) through 2025. Cameco plans to double uranium production by 2018 and this will boost employment levels at
their northern mine operations (Cameco, November 23, 2010).
The McArthur River mine operated by Cameco has huge reserves of very high-grade uranium ore to ensure mining for 20-30 years. In
2009 McArthur River mine was the world’s largest uranium producer, yielding 19.1 million pounds of uranium oxide. The anticipated
yield for 2010 was 18.7 million pounds. Ore is underground mined by remote-control equipment and trucked to the Key Lake mill. At
Key Lake mine, Cameco will tender contracts to renew the mill and will prepare an environmental assessment in 2010 to extend the mill
life and increase production by 15%. McArthur/ Key Lake operations have about 700 employees in underground mining, milling,
trades, management and support services and 400 contract workers in underground mining, catering, and construction.
At Rabbit Lake mine, recent exploration drilling has extended mine life to at least 2015. The Eagle Point mine produced 3.8 million
pounds of uranium oxide in 2009 with an anticipated yield of 3.6 million pounds in 2010. In the last half of the decade, Rabbit Lake mill
is expected to process about half of the uranium from Cigar Lake, subject to regulatory approval. The site has over 300 employees in
milling, trades management, and support services and 400 contractors in underground mining, catering and construction.
AREVA’s McClean Lake mill remains in maintenance mode until ore is available from Cigar Lake mine. The site will retain maintenance
staff. AREVA’s planning staff are continuing the environmental approval process for Midwest and Caribou ore bodies and planning
McClean underground deposit. Midwest will include an open pit, a new haul road, and milling of ore at the existing mill. AREVA and
the Province continue to study transportation routes between McArthur River mine and McClean Lake mine. If there is approval two
trucks will haul McArthur ore to McClean Lake mill for one year prior to Cigar Lake production, AREVA would be able to call back its
McLean workforce a year earlier.
Remediation is ongoing at the Cigar Lake mine. Production is scheduled to begin in mid 2013. It is anticipated that the mine will
require a four-year ramp-up period before producing at its annual licensed capacity of 18 million pounds uranium oxide.
Northern Saskatchewan Regional Training Needs Assessment Report 2011-2012 Page #23Opportunities at Mine Operations Continued
Golden Band Resources’ newly refurbished Jolu Mill is operating and processing approximately 400 tonnes of high-grade material daily
from the Roy Lloyd Mine (Bingo Deposit). The company will increase its ore feed rate to 700 tonnes per day when it starts processing
ore from the EP gold deposit. Golden Band has a land package that includes twelve known gold deposits, four former gold producing
mines and the Jolu gold mill. Golden Band employs nearly 85 people. It has a General Service Agreement with Kitsaki/Procon Joint
Venture to provide opportunities to Lac La Ronge Indian Band members. (source: Golden Band Resources, December 23, 2010).
Hudbay operations in the Flin Flon – Snow Lake belt include three operating mines – 777, Trout Lake, and Chisel North. Hudbay’s
annual exploration budget in 2010 was $59 million with more than half of that amount devoted to exploring the Flin Flon – Snow Lake
belt. (source: Mining Markets, 2010)
Gold and uranium mining provide direct jobs for about 1,500
people from northern Saskatchewan. Aboriginal people hold
a high proportion – about 44% - of the total 3,200 positions at
the mine sites (includes long-term contract work). An
additional 1,000 people work in the head offices in Saskatoon
and an additional 7,000 work in spin-off jobs indirectly created
by the industry (Saskatchewan Mining Association).
There are approximately 1,800 residents of northern
Saskatchewan who earn a living from mining operations.
Page #24 Northern Saskatchewan Regional Training Needs Assessment Report 2011-2012 Northern Saskatchewan’s mining industry spent $63 million on wages in 2008 paid to northern employees and $355 million on
contracts with northern Saskatchewan companies and joint ventures for services like trucking, catering, mining and security. Since
1991, businesses and residents in northern Saskatchewan have earned $3 billion from northern mine sites.
Workforce challenges facing Northern Saskatchewan mineral sector
Some workforce needs identified by northern Saskatchewan mine sites include:
o mentorship and workplace skills testing for new northern employees;
o supervisory succession mentorships;
o more professionally trained northern workers with mine-related university degrees; and
o an increase in the number of apprentices and journeypersons.
Northern Saskatchewan mines employ directly about 400 trades positions and over 300 professional/supervisory positions: currently,
northern residents of the region hold 24% of those jobs. With training, residents of the northern region have the potential to fill more
of these positions. The northern mines greatest skill needs are underground miners, radiation and geological technicians and engineers.
Potential for Northerners to fill more Trades and Professional
career positions in Northern Saskatchewan’s mining industry
450 Source: Ministry of Advanced
Education, Employment and Labour, La Non-Northern Workers
400 Ronge Yearly averages of company
employees and "Residents of Northern Workers
350 Saskatchewan's North" from Quarterly
Reports from Mine Companies. Does
300 not include contractors. Feb. 27/09
250
200
150
100
50
0
1992
1993
1998
2003
2005
2007
2008
2003
2005
2007
2008
1992
1993
1998
2003
2005
2007
2008
1992
1993
1998
2003
2005
2007
2008
1992
1993
1998
2003
2005
2007
2008
1992
1993
1998
2003
2005
2007
1992
1993
1998
2003
2005
2007
1992
1993
1998
2003
2005
2007
2008
Equipment Underground Mill Support Trades Technical Professional Supervisory
Operator Mining Operator Services
Northern Saskatchewan Regional Training Needs Assessment Report 2011-2012 Page #25You can also read