New Ways to Measure Mechanical Losses by Motoring an ICE with Increased Cylinder Pressure
←
→
Page content transcription
If your browser does not render page correctly, please read the page content below

applied
              sciences
Article
New Ways to Measure Mechanical Losses by Motoring an ICE
with Increased Cylinder Pressure
Radek Procházka *, Aleš Dittrich                   , Robert Voženílek and Stanislav Beroun

                                          Department of Vehicles and Engines, Technical University of Liberec, Studentská 1402,
                                          461 17 Liberec, Czech Republic; ales.dittrich@tul.cz (A.D.); robert.vozenilek@tul.cz (R.V.);
                                          stanislav.beroun@tul.cz (S.B.)
                                          * Correspondence: radek.prochazka@tul.cz; Tel.: +420-737-185-115

                                          Abstract: The article shows the results of measuring the mechanical losses of a piston engine in two
                                          new ways and explains the necessary engine modification for these measurements. At the same time,
                                          it compares the results of measuring mechanical losses in the internal combustion engine (ICE) in
                                          the current (hitherto exploited) way and in new ways. The first method is not replacing the cylinder
                                          charge and regulating the cylinder pressure by feeding compressed air through self-acting valves
                                          into the cylinders of the motoring engine. The second method is a closed working cycle by means of
                                          an exhaust–intake connection, in which the load pressure in the cylinder is adjusted and maintained
                                          by a controlled-intake air supply. With the current method of measuring mechanical losses of a
                                          reciprocating internal combustion engine (ICE) by motoring, there are less than half the pressures in
                                          the cylinder compared to the pressures during real engine operation (i.e., in the combustion mode).
                                          Lower pressures in the cylinder reduce the force load on the piston group and the crank mechanism,
                                          and the detected mechanical losses in the engine are thus significantly reduced compared to the
                                reality. In the laboratories of the propulsion units of the Faculty of Mechanical Engineering of the

                                          Technical University in Liberec, research is underway on a new method of measuring mechanical
Citation: Procházka, R.; Dittrich, A.;
                                          losses of a reciprocating internal combustion engine by motoring with charge pressure profiles in
Voženílek, R.; Beroun, S. New Ways
                                          engine cylinders comparable to cylinder pressures during standard engine operation. The paper
to Measure Mechanical Losses by
Motoring an ICE with Increased
                                          shows the results of measuring the mechanical losses of a piston engine in two new ways and explains
Cylinder Pressure. Appl. Sci. 2022, 12,   the necessary adjustment of the engine for these measurements. At the same time, it compares the
2155. https://doi.org/10.3390/            results of measuring mechanical losses in a reciprocating engine in the current (hitherto used) way
app12042155                               and new ways. The first method is not changing the cylinder charge and regulating the pressure in
                                          the cylinder by inserting compressed air through automatic valves into the cylinders of the motoring
Academic Editors: Michal Puškár
                                          engine. The second method is a closed working circuit involving connecting the exhaust to the
and Georgios Karavalakis
                                          intake, in which the charge pressure in the cylinder is set and maintained by a controlled supply
Received: 12 December 2021                of compressed air to the intake manifold. The first method proved to be a more suitable way to
Accepted: 16 February 2022                investigate mechanical losses in ICE and determine the dependence of these losses on the pressure
Published: 18 February 2022
                                          conditions in the engine cylinder.
Publisher’s Note: MDPI stays neutral
with regard to jurisdictional claims in   Keywords: ICE motoring; mechanical loss; thermodynamic analysis; measurement
published maps and institutional affil-
iations.

                                          1. Introduction
                                               The measurement of exhaust emissions produced by the internal combustion piston
Copyright: © 2022 by the authors.
Licensee MDPI, Basel, Switzerland.
                                          engine is monitored and regulated significantly during road vehicles’ driving and approval
This article is an open access article
                                          tests. Particular attention has recently been paid to the amount of CO2 emissions. These
distributed under the terms and
                                          depend on the overall efficiency of the ICE, which is determined by the thermal efficiency
conditions of the Creative Commons        of the working cycle and the mechanical efficiency of the ICE. Therefore, increasing the
Attribution (CC BY) license (https://     thermal efficiency of the ICE and reducing mechanical losses in the engine is still a very
creativecommons.org/licenses/by/          topical task in the research and development of piston combustion engines (also due to the
4.0/).                                    considered limits given by the future EURO VII standard).

Appl. Sci. 2022, 12, 2155. https://doi.org/10.3390/app12042155                                                    https://www.mdpi.com/journal/applsci
Appl. Sci. 2022, 12, 2155                                                                                           2 of 22

                                  A frequently used procedure for determining the effect of various measures on indi-
                            vidual subfunctional groups, measuring mechanical losses by motoring the engine at a test
                            bench with a dynamometer or at a special test station, is used to reduce ICE mechanical
                            losses. In both cases, it is necessary to equip the test equipment with a very accurate sensor
                            for measuring torque, stabilizing operating fluid temperatures (coolant, lubricating oil) of
                            the engine and automated recording and possibly also evaluation of monitored quantities.
                            The shortcoming of today’s way of measuring mechanical losses in an engine by motoring
                            is the big difference between the pressure in the cylinder when the engine is motoring and
                            the pressure in the cylinder during standard engine operation (i.e., with the combustion of
                            the mixture) [1,2].
                                  Another way to detect ICE mechanical losses is, for example, to calculate the mean
                            effective pressure and mean indicated engine operating pressure from a thermodynamic
                            analysis of the high-pressure engine indication or to extrapolate the fuel consumption pat-
                            tern from the load characteristics. These methods provide reliable data on total mechanical
                            losses in the engine when measurements are made correctly. However, to find new technical
                            solutions leading to a reduction in mechanical losses in the ICE, such measurements are
                            relatively expensive in terms of time and operation. Since friction losses in the piston group
                            (piston + sealing piston rings) account for the largest share (about 40 to 50%) of mechanical
                            losses in the ICE, much attention is paid to the impact of the construction and material
                            performance of the piston group on mechanical losses in the ICE. The research is based on
                            theoretical investigations and model calculations of the friction mechanism of piston rings
                            on the cylinder wall and experiments [3,4].
                                  A simplified view of the main items of lost mechanical energy in ICEs and their share
                            of the total loss of mechanical energy in engines is shown in Tables 1 and 2 [1]. The data on
                            mechanical losses in the ICE are shown in the tables below. They indicate the predominant
                            proportion of friction losses in the piston group and engine bearings. The main potential
                            for finding possible solutions to reduce friction in the ICE is mainly the friction of piston
                            rings. The movement and load of the piston ring in the engine cylinder are very variable
                            during the stroke. The piston rings must minimise the penetration of lubricating oil from
                            the crankcase into the cylinder and the antiblow function of the cylinder charge into the
                            engine crankcases. It is relatively challenging to optimise the piston ring preload, and the
                            shape of the friction surfaces on the piston rings to reduce friction losses. The value of the
                            coefficient of friction can be reduced through coating technologies on the piston rings and
                            improved lubrication technologies.

                            Table 1. Mechanical loss distribution—share of the indicated power [1].

                                GROUP (Indicative Values of
                                                                             SI Engine                CI Engine
                                  Mechanical Losses in % of
                                                                                [%]                      [%]
                              Indicated ICE Power at 100% Load)
                                       Cylinder cartridge
                                                                                 3.5                      3.5
                                          replacement
                                 Water, oil and injection pump                   1.0                      1.5
                                    Valve distribution and
                                                                                 1.5                      1.5
                                      actuator accessories
                                      Losses in main and
                                                                                 4.0                      6.0
                                   connecting rod bearings
                                   Friction of the piston and
                                                                                 8.0                     12.5
                                  piston rings in the cylinder
                                              Total                              18                       25
Appl. Sci. 2022, 12, 2155                                                                                                    3 of 22

                            Table 2. Mutually distributed loss-making mechanical energy [1].

                              LOSSES (Indicative Values of the
                             Share of the Main Groups of Losses                 SI Engine                      CI Engine
                               in the Total Loss of Mechanical                     [%]                            [%]
                                Energy in ICE at 100% Load)
                             The friction between piston–cylinder
                                                                                    45                             50
                                        (rings–cylinder)
                                The friction of crankshaft and
                                                                                    23                             24
                                       camshaft bearings
                              Engine cylinder replacement losses                    20                             14
                                   Timing mechanism drive                            6                             6
                                    Drive of auxiliary units                         6                             6

                                 The friction losses on the piston rings are related to the pressure of the piston rings on
                            the cylinder wall, which is determined both by the assembly preload of the piston rings and
                            by the change of the operating pressure in the engine cylinder. The movement and load of
                            the piston ring are very variable during the stroke of the piston in the engine cylinder. The
                            required clearance in accommodating the piston in the cylinder and the piston rings in the
                            piston grooves created a pressure penetration from the cylinder into the piston ring grooves.
                            It was suitable for pressing the piston rings against the cylinder wall. The variability of
                            the load of the piston rings by the pressure in the groove of the individual rings for the
                            supercharged case of the diesel engine is shown in the graphs in Figure 1, which were
                            determined by computational modelling [5].

                            Figure 1. Calculated pressure courses in the grooves of the individual piston rings and their friction
                            forces depending on the position of the crankshaft of the supercharged diesel engine (i.e., the pressure
                            in the engine cylinder) [5].

                                  Measurement of mechanical losses by motoring an ICE with increased pressure in the
                            cylinder (with a closed working cycle using an exhaust–intake connection and a controlled
                            intake of compressed air into the intake manifold) was carried out, for example, AVL [6].
                            Figure 2a displays a test site with a motoring single-cylinder ICE. A standard steel pipe
                            and hoses connect the intake and exhaust via a large boost pressure vessel. Compressed
                            air is fed directly into the pressured air reservoir. The design of a large pressure reservoir
                            can be explained by the attempt to avoid closed-circuit pressure pulsations (intermittent
                            exhaust-side air inflows and intermittent intake of air on the intake side) when measured
                            by pressure pulsations. Figure 2b shows the measured IMEP, pmax and boost pressure
                            values for the speed in the table.
Appl. Sci. 2022, 12, 2155                                                                                                 4 of 22

                            Figure 2. Test assembly for the boosted–motored friction test (a) with examples of boost pressure
                            levels adjusted to achieve target compression pressure (b) [6].

                                A diagram of the test site, including a description of the experiment’s elements, is
                            shown in Figure 3.

                            Figure 3. Test assembly for the boosted–motored friction test with examples of boost pressure levels
                            adjusted to achieve target compression pressure [6].

                                  Other similar experiments measuring mechanical losses by motoring ICEs with in-
                            creased pressure in the cylinder were published in [7,8]. This is a similar implementation
                            to [6]. Publications [7,8] are expanded to include detailed simulations using a compression
                            ignition internal combustion engine. Figure 4 shows a test site with a motored diesel engine,
                            where rubber hoses connect the intake and exhaust over a large compressed air supply.
                                  In the literature, the measurement of mechanical losses by motoring an ICE with
                            increased pressure in the cylinder (with a controlled supply of compressed air to the
                            individual cylinders using one-way valves) was not found [9].
Appl. Sci. 2022, 12, 2155                                                                                           5 of 22

                            Figure 4. The testbed configuration [7,8].

                            2. New Ways to Measure Losses by Motoring an ICE with Increased Pressure
                                 Experimental research on the following new methods has been carried out on the
                            1.6 dm3 atmospheric spark ignition internal combustion engine MPI series EA211. The
                            basic parameters of the engine used are given in Table 3 below. This positive ignition
                            engine was installed at a special motoring station, equipped with a 26 kW propulsion
                            three-phase electric motor with speed control by a frequency converter and a system of
                            exchangers to set and stabilise the temperatures of the engine’s operating fluids (coolant
                            and lubricating oil). The temperature conditions corresponded to the real operation of the
                            engine. Connecting the motoring engine to the driving electric motor required a flexible
                            clutch assembly and a torque sensor (HBM T40 B, 200 Nm). While the engine was being
                            motored, the progress of the cylinder pressures was monitored and recorded online using
                            the AVL X-ion indicating apparatus using the AVL 365C optoelectronic incremental speed
                            sensor and the AVL GU21D piezoelectric pressure sensors. Measurement and recording of
                            the engine driving torque, motoring engine operating conditions and cylinder blow-outs
                            (using AVL Blow by meter) to the crankcase were performed using the HBM MGCplus
                            gauge switchboard. All measurements were taken at a hot-engine test station with the
                            coolant temperature stabilised at 85 ◦ C and lubricating oil temperature at 90 ◦ C. Figure 5
                            shows the actual state of the test station with the engine installed for motoring.

                            Table 3. Basic parameters of the engine used.

                                                  Type                       SI, 4 Cylinder Inline, Naturally Aspirated
                                              Bore × Stroke                               76.5 × 86.9 mm
                                              Displacement                                  1597.7 cm3
                                            Compression ratio                                  10.5:1
                                            Maximum power                                      80 kW
                                            Maximum torque                                    150 Nm
                                             Cooling system                                    water
Appl. Sci. 2022, 12, 2155                                                                                                  6 of 22

                            Figure 5. Special habitat for measuring mechanical losses by motoring an ICE with increased
                            cylinder pressure.

                            2.1. Option A
                                 This new way of measuring the mechanical losses of the four-stroke piston engine
                            by motoring requires disconnecting the valve controls on all cylinders so that the valves
                            are permanently closed. Instead of spark plugs, multifunction screws were mounted in
                            the cylinder head, housing self-actuating one-way valves with controlled compressed
                            air supply to individual cylinders, pressure transducers and decompression screws. The
                            schematic image and photograph in Figure 6 show the arrangement of a cylindrical engine
                            unit with a multifunction screw and a cylinder head section with pressurised air connections
                            to single-way valves. Photographs of a manufactured functional multifunction screw
                            sample with individual component markings, including the 3D model, are shown in
                            Figure 7.

                            Figure 6. Arrangement of a cylindrical engine unit with multifunction screw and a cylinder head
                            section with compressive air connections to single-way valves. Describing part of the left picture:
                            multifunction screw diagram (1) with a special self-actuating one-way valve (2), a pressure trans-
                            ducer (3) and decompression screw (4). View of the top portion of the cylinder head with installed
                            multiblower screws with the connection of one-way valves by inlet (5) to the pressurised air reservoir
                            (PAR = “pressured air reservoir”) with regulator (6) to adjust the air pressure in PAR.
Appl. Sci. 2022, 12, 2155                                                                                                7 of 22

                            Figure 7. Option A: multifunction screw diagram (1) with a special self-actuating one-way valve (2),
                            a pressure transducer (3) and decompression screw (4).

                                  A detailed view of the 3D model of the multifunction screw (1) with individual
                            component markings is shown in Figure 8. A screw (4) was screwed into the multifunction
                            screw on the left. Decompression reduces the highest value of the driving torque of the
                            motored engine both when starting and when increasing the speed and when stopping
                            the motoring. This solution ensures a reduction in torsional vibrations in the rev area of
                            approximately 500–1000 min−1 , which contains a separate torsion set frequency at the
                            motoring station (motoring engine, flex clutch, torque sensor and electric drive motor).
                            On the right, a compressed air supply batch is shown through the self-actuating one-way
                            valve (2) to the engine cylinder. The one-way self-actuating valve shall be guaranteed
                            cylinder tightness and guaranteed flow from the compressed air supply to the cylinder.
                            The design is as follows: flat end of the compressed air supply pipe (2) (has a hardened,
                            ground and polished surface), to which a steel (hardened, ground and polished) plate
                            (7) was pressed with a slight spring preload, which was put together with the spring (8)
                            housed in a housing (9) mounted on the end of the pipe. The arrangement and dimensions
                            of the end part of the tube, sleeve and plate determined the stroke of the plate in the range
                            of 0.2–0.3 mm.

                            Figure 8. Detailed view of 3D model of the multifunction screw (1) with individual component
                            designations: self-actuating one-way valve (2), decompression screw (4), plate (7), spring (8) and
                            casing (9).
Appl. Sci. 2022, 12, 2155                                                                                                  8 of 22

                                 When motoring a four-stroke engine with permanently closed valves in the cylinder,
                            the cylinder contents are removed from the operating cycle, and both the compression and
                            expansion phases occur at twice the frequency. The pressure sets the required maximum
                            pressure in the cylinder in the compressed air supply to the one-way automatic valve in
                            the multifunction screw. The self-adjusting valve continuously replenishes the filling in
                            the cylinder when measured (compensating for the loss of filling by the prop and the drop
                            in pressure due to heat loss). It automatically keeps the set pressure in the cylinder to the
                            required value—shown in Figure 9.

                            Figure 9. Calculated pressure flow in the engine cylinder with valves closed with an initial pressure
                            of 200 kPa. Replenishment of the air charge of the cylinder with an automatic valve takes place when
                            the crankshaft is around the top dead centre TDC (∆α = 30~40 ◦ CA) [10]. α = ϕ.

                                 A schematic arrangement of Option A of the test bench is shown in Figure 10. The
                            asynchronous electric motor was connected to the ICE with flexible coupling, where the
                            rotor of the torque sensor was screwed on one side of the flange. When motoring the
                            ICE, the cylinder charge (compressed air) was fed through the air valve (allowed the
                            compressed air pressure to be set) and the “pressured air reservoir” = PAR. From PAR, the
                            compressed air was distributed by the individual pressure hoses through the self-actuating
                            one-way valves into the individual cylinders of the engine. The test bench was equipped
                            with a system for stabilising the lubricating oil and engine coolant temperatures (heating
                            and cooling system including external pumps). The necessary temperature and pressure
                            sensors were located on the ICE to ensure that the engine ran smoothly. The experiment’s
                            data recording was collected through two independent devices—the AVL X-ion indication
                            apparatus (measurement of high-pressure indication in the engine cylinders) and the
                            MGCplus measuring control panel (measurement of temperatures, pressures, torque and
                            blow-by). The entire station was controlled via a PC by a test operator.

                            Figure 10. Engagement scheme—Option A.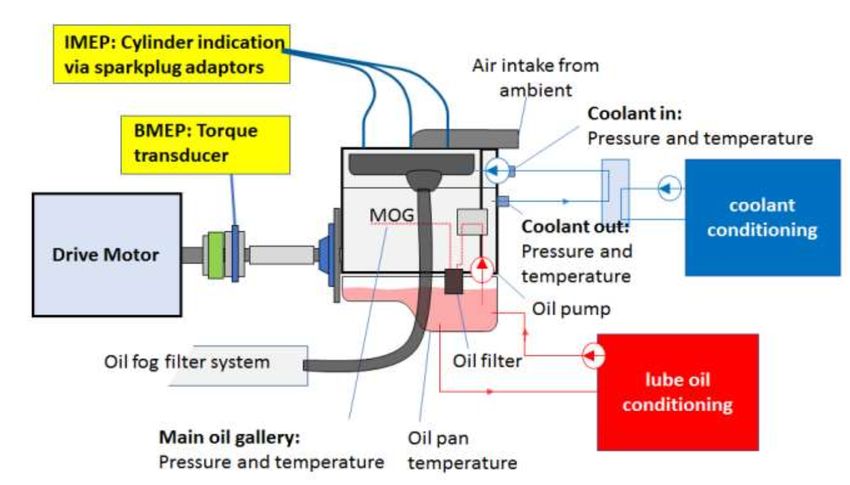
Appl. Sci. 2022, 12, 2155                                                                                               9 of 22

                            2.2. Option B
                                 A closed working circuit can also realise the increase in pressure in the cylinders
                            of a motoring engine by connecting the exhaust with the intake, in which the controlled
                            supply of compressed air to the intake manifold sets and maintains the cylinder pressure
                            at a value corresponding to the beginning of the compression stroke. It is motoring a
                            classic four-stroke engine (with fully functional valves). Implemented modifications on the
                            internal combustion piston engine, including a separate equal pressure pipe connecting the
                            intake to the exhaust, are shown in the photographs in Figure 11.

                            Figure 11. Option B: Construction of a straight pressure pipe connecting the intake to the exhaust
                            mounted on the internal combustion piston engine.

                                 A schematic arrangement of Option B of the test bench is shown in Figure 12. A
                            description of the test bench and its individual parts is given in the description of Figure 10.
                            The main difference is found in the installation on the engine. With Option B, the cylinder
                            charge (compressed air) was also fed via the air valve (allowed the compressed air pressure
                            to be set) to the “pressured air reservoir”. PAR is the part that connects the intake to
                            the exhaust.

                            Figure 12. Engagement scheme—Option B.

                            3. Results of Measuring Mechanical Losses by Motoring ICE with Increased Pressure
                            in the Cylinder in New Ways
                            3.1. Option A—Measurement Results
                                 The measurements demonstrated that the self-operating valves, depending on the
                            air pressure of the container (PAR) to which the air ducting tubes to the compressed air
                            supply pipe to the valve are connected, have a reliable function over the entire speed range
                            of the motored engine (2000–5000 min−1 ). Minor differences in the pmax values of the
                            individual engine cylinders were due to variations in the flow and dynamic characteristics
                            of the individual valves in the multifunction screws, which decide the pressure settings
Appl. Sci. 2022, 12, 2155                                                                                                 10 of 22

                            at the start of the compression strokes in the individual cylinders. A record of the actual
                            progress of cylinder pressures in the 4000 min−1 mode and pPAR = 5 bar is shown Figure 13.

                            Figure 13. Record of the actual progress of the pressures in the individual cylinders from the engine
                            motoring in the 4000 min−1 modes at the pressured air reservoir air pressure (PAR) pPAR = 5 bar.

                                 Inserted tables show both the current pTDC values and their statistical evaluation in
                            a set of 200 consecutive cycles; in a small table at the top left, the current pBDC values in
                            each cylinder are shown, and a larger table at the top right shows the IMEP values from the
                            thermodynamic analysis of the current cycle. The table at the top left of the graph shows
                            the current pressure value in each cylinder at the start of the compression stroke.
                                 The measured mean torque values of the Tq_loss motored engine are the combined
                            result of mechanical losses in the ICE and thermodynamic losses in the motored engine
                            operating cycles. The mechanical work to change the volume of the cylinders is zero for an
                            engine with permanently closed valves. Thermodynamic losses in working cycles (heat
                            transfer between the cylinder volume and the walls and losses by leakage of the air charge
                            mass) were determined by thermodynamic analysis of the measured pressure profiles in the
                            individual cylinders. For thermodynamic analysis of a motored engine with permanently
                            closed valves, the mean indicated pressure of the thermodynamic workflow loss (i.e., for
                            two crankshaft revolutions) is

                                                            IMEP_td-loss = IMEPH − IMEPL                                      (1)

                                 The IMEPH (Indicated Mean Effective High Pressure) and IMEPL (Indicated Mean
                            Effective Low Pressure) values for a multicylinder engine are determined as the average
                            of the thermodynamic analysis results of the measured pressure courses in all cylinders.
                            The total mean indicated loss pressure IMEP-loss(sum) for the motored engine is calculated
                            from the measured torque of the motored engine Tq_loss . The entry for the mean indicated
                            pressure of mechanical losses in the working cycle (i.e., for two crankshaft revolutions) in
                            the motored engine is determined by subtracting IMEP_td-loss from IMEP_loss(sum).
                                 The results of measuring the mechanical losses in the piston engine by the new
                            motoring method were compared with the results of measuring the mechanical losses in
                            the standard way on the same ICE [11] for which the measurements were made at the same
                            motoring station under the same conditions. The motoring engine was free of suction and
                            exhaust piping. The results of the comparison are shown in Figures 14 and 15.
Appl. Sci. 2022, 12, 2155 11 of 22
Figure 14. Record the actual progress of the pressures in the individual cylinders from the engine
motoring in the 4000 min−1 modes at the pressured air reservoir air pressure (PAR) pPAR = 5 bar.
For both the standard and new modes, Option A, the observed quantities were de-
termined by measurements for the same mean pmax values in the engine’s cylinders in
the individual rev modes of the engine. When measuring losses in the piston engine by
the standard motoring method, the mean indicated loss pressure IMEP-loss(sum) was more
significant than when motoring the engine with the valves permanently closed. This is due
to the mean indicated loss pressure item for replacing the IMEP_loss(in-ex) cylinder content
for the standard motoring method (this item is not available for permanently closed valves).
The mean indicated mechanical loss pressure IMEP_mech-loss was higher when the engine
was motored with the valves permanently closed than when the engine was motored in
the usual manner. The graph in Figure 15 shows the subparts of the mean mechanical loss
item IMEP_mech-loss when motoring the engine in the standard way for compression and
expansion (C-E) and exhaust and intake (Ex-In). The complete characteristics for Option A
are shown in Figure 16.
Figure 15. The mean indicated mechanical loss pressure IMEP_mech-loss when the engine was motored
in the usual manner can be expressed as the sum of the IMEP_mech-loss mean indicated pressure
item for compression and expansion IMEP_mech-loss(C-E) and the IMEP_mech-loss(Ex-In) mean indicated
mechanical loss pressure item for exhaust and suction.Appl. Sci. 2022, 12, 2155 12 of 22
Figure 16. Values of the pressures in the engine cylinders at the start of compression (pBDC ) and
the end of compression (pTDC ), subtracted from the records of the high-pressure indication in the
wide operating area of the motored engine. The variation of the observed maximum pressures in the
engine cylinders was roughly equal to the variability of the maximum pressures in the cylinder of the
positive ignition engine.
If the maximum cylinder pressures are the same when motoring the engine in the
usual manner and motoring with the valves closed (Option A), then the IMEP_mech-loss(C-E)
item will have half the IMEP_mech-loss measured when motoring the engine with the valves
closed. The piston was loaded with pressure during compression and expansion at each
crankshaft revolution when motoring the engine with the valves permanently closed.
Therefore, the IMEP (indicated mean effective pressure) of mechanical losses was higher
than when motoring the engine in the standard way.
3.2. Option B—Measurement Results
The measurement results for Option B with a closed working circuit using the con-
nection of the exhaust with the intake and the controlled supply of compressed air to the
intake manifold showed that the IMEP values of the working circuit of the motoring engine
are in good agreement. In the experiment, however, there were pulsations in the relatively
small volume of closed circulation caused by the tailpipe’s intermittent air inflows and
intermittent intake-side air samples. These pulsations affected the reliability of the mea-
surement of the cylinder capacity exchange work (IMEPL) and thus the reliability of the
determination of the mechanical losses in the cranking engine. The pressure variation is
also evident in the recording of the pressure in the cylinder in Figure 17.
Online thermodynamic analysis and statistical processing were performed in the same
way as during engine motoring with permanently closed valves for Option A. Work on the
replacement of cylinder contents (see pressure patterns in the low-pressure area in Figure 13)
showed a gradual increase in temperature at the start of the compression stroke, which
complicated the course and execution of the measurement. Due to the abovementioned
issues in this experiment for Option B, only Option A will be further detailed.Appl. Sci. 2022, 12, 2155 13 of 22
Figure 17. Record of the actual progress of the pressures in the individual cylinders from the engine
motoring in the 4000 min−1 modes at air pressure in the intake manifold pPAR = 3.5 bar.
4. The Working Cycle of Motoring Engine with Permanently Closed Valves—Option A
The measurements showed the dependencies of both friction and thermodynamic
losses of the engine at both speeds and maximum pressures in the cylinder of the motoring
engine. Analysis of the high-pressure indication in all cylinders of the cranked engine
confirmed that blowing compressed air into the cylinders by self-actuating valves provides
a rapid build-up of pressure in the cylinders, which can be easily controlled by air pressure
flow to the valves. The measurement also showed that the new air charge state in the
cylinders would stabilise after several hundred work cycles (i.e., after 3–6 s) from the air
pressure setting on the inflow to the valves. As the pressure was the only measured quantity
of the filling in the cylinder, a calculation study was conducted to investigate the state of
the filling in the cylinder. The purpose of the calculations was to create a theoretical view
of the method of increasing maximum pressures in cylinders of a motoring engine with
permanently closed valves and the rate of stabilisation of the operating circuit parameters
from the moment of setting the air pressure in the reservoir with the injection of compressed
air through the self-actuating valve into the cylinder, as well as the state of the working load
in the cylinder (mass, pressure and temperature in BDC) compared to the measurements
of pBDC , pmax and blow-by. The correctness of the calculated result can only be partially
verified by comparing the calculated pressure of pBDC and pTDC in the cylinder after the
calculated steady-state had been reached with the corresponding values of the pressures in
the cylinder, as determined from the evaluation of the high-pressure indication. The other
calculated values of the cylinder contents, mass m and TBDC temperature, after reaching the
steady-state in the cylinder, need to be considered (concerning the estimation of some input
data for calculations) only probable (their mutual binding is determined by the equation of
state—e.g., for BDC). As the calculations included the modelling of the motoring engine’s
operating cycle with permanently closed valves, the calculated value of thermodynamic
losses from the “calculated” steady-state circulation can be compared to the IMEP_td-loss
from a thermodynamic analysis of the high-pressure indication of measurements taken,
and this comparison can also be considered as a criterion for the accuracy of the results of
the calculation study.
The thermodynamics of the working cycle and the pmax control mechanism in a
cylinder of a motoring engine with permanently closed valves by applying compressed
air to the working cycle to set the required pmax pressures in the steady-state mode of the
motoring engine is a seemingly simple problem. Still, it took some time to find the rightAppl. Sci. 2022, 12, 2155 14 of 22
approach to describe the events in the engine cylinder. Due to the relatively very rapid
stabilisation of the working cycle monitors as well as the measured torque (loss) of the
cranked engine, the study of the progress of changes in the cylinder was aimed at achieving
a steady operating state from the setting of a specific (selected) pPAR air pressure value in
the reservoir.
To clarify the situation at the start of the engine’s revving with permanently closed
valves, a visualisation is given in Figure 18, which shows a record of the progress of the
pressures in each cylinder in the 5000 min−1 modes and the overpressure in the pressurised
air reservoir, i.e., pPAR = 6.5 bar. When motoring the engine at the motoring station,
decompression screws were allowed on all cylinders to make the engine run, and when
the engine started, the screws were gradually tightened. There was zero pressure in the
pressure reservoir. The cylinders had very different pressure courses, determined by
the cylinder load state when the decompression screws were touched. The supply of
pressurised air to the container ensured rapid equalisation of the pressures in the cylinders
so that when the pPAR pressure was set, working pressures increased in all cylinders.
Figure 18. Pressure courses from the indication recording in cylinder one at the start of compression
(blue) and end of the expansion (red) in mode n = 5000 min−1 and air pressure in the inlet to the
automatic valve pPAR = 6.5 bar. The pink line is the polytropic flow of pressure from the calculation.
The air supply from the self-adjusting valve to the cylinder at the end of expansion
and the beginning of compression prevented a simple conversion between measured
pressures pBDC(measured) and pTDC(measured) over the compression ratio. Pressure courses in
the cylinder in the area around the BDC are shown in Figure 19. In the steady mode of
a motoring engine with permanently closed valves, in a set of 200 consecutive operating
cycles of the same cylinder, the pressures in the BDC deviated at the end of expansion and
start of compression to about 0.05 bar.
Figure 19. Pressure courses in each cylinder at 5000 min−1 and pPAR = 0 bar after starting the
motoring (after gradually closing the decompression screws).Appl. Sci. 2022, 12, 2155 15 of 22
Calculating Cylinder Load State—Option A
This section investigates the characteristics of a closed operating cycle for an engine
with permanently closed valves and a controlled air supply to the cylinder while increasing
pmax when cranking the engine from the setting of the pPAR air pressure in the air reservoir
to the final settling of the operating cycle parameters. It was based on a combination of
calculating successively infused doses of compressed air through a self-actuating valve into
a cylinder and modelling the workflow in a computing program.
The arrangement of the compressed air supply system to the self-actuating valve with
individual component markings is shown in Figure 20. The compressed air temperature on
the inlet to the self-closing valve was approximately 350 K. The calculation of compressed
air doses into an engine cylinder with permanently closed valves was based on the solution
of compressed airflow through the system from the compressed air storage chamber
through the volumes V1 (pressure hose) and V2 (tube terminated by a self-closing plate
valve) to the output cross-section S3 (with full-plate stroke) and the ducts to connect with
the engine cylinder. The cross-sections S1 and S2 were formed by interconnecting elements
between the air reservoir and the volumes V1 and V2. To simplify the calculation, these
volumes were combined into a volume V3 = V1 + V2, which was connected to the reservoir
by a replacement SRED_cross-section . The flow characteristics of the individual cross-sections
are expressed by their cross-sections and flow coefficients.
Figure 20. Arrangement of the compressed air supply system to a self-actuating valve with individual
component markings.
The calculation solution of the self-actuating valve to the engine cylinder and the
modelling of the closed operating cycle in a cylinder-motored engine with permanently
closed valves for successive cycles was built on certain simplifications based on the actual
calculation program’s measurement conditions as developed by the TU Liberec.
The transfer of heat between the filling and the walls of the cylinder was addressed in
the computational program according to the Woschni empirical relationship. The mean
wall temperature in the cylinder of the motored engine with permanently closed valves was
raised against the temperature of the heated engine, taking into account the temperature
load on the walls of the cylinder and on the face of the piston from the friction of the
piston rings in the closed working cycle, which can only be cooled by transferring heat
to the cylinder filling. For the modelling of polytropic compression and expansion in
the computing program, the mean wall temperature in the cylinder was set from 390 K
(motoring 30 cycles after setting the pPAR pressure when pmax was low in the cylinder) toAppl. Sci. 2022, 12, 2155 16 of 22
420 K for the 5000 min−1 modes under investigation, after several test calculations, when
the pmax pressure in the cylinder was increased until the cylinder load state stabilised.
The calculation was performed cycles after the selected air reservoir pressure setting.
For the initial cycle, the Mair cylinder’s p180 pressure and air charge weights were chosen,
and the T180 temperature was calculated. Calculations have shown that the choice of p180
pressure and Mair mass for the initial cycle will have virtually no effect on the final result of
the calculation, manifesting only in the number of cycles until a steady state in the cylinder
is reached.
The entire calculation procedure includes the following steps:
1. The flow of the individual cross-sections in the system from the pressurised air
reservoir to the cylinder was calculated as a subcritical polytropic discharge of the
compressible fluid through the S3 cross-section. The possible critical discharge in the
initial phase of the compressed airflow through the S3 section into the cylinder was
neglected. In the V3 volume, at the beginning of the discharge, there is always a pPAR
pressure which decreases significantly when opening the automatic valve plate as the
inflow of compressed air through the SRED cross-section into the V3 volume is lower
than the discharge through the S3 cross-section. In addition, the complexity of the
flow path (see red line in Figure 21) from the valve to the cylinder virtually eliminates
critical discharge. The pressure drop for the discharge through the S3 cross-section
was determined in each addressed cycle by the difference of the mean pressure in
the V3 volume at the discharge of the compressed air through the S3 cross-section (a
simplistically constant mean pressure during the discharge, close to the pBDCmeasured
value) and the instantaneous pressure in the p180 cylinder, as calculated;
2. The temperature of the compressed air introduced into the cylinder by the self-
adjusting valve was estimated to be Tair blow in = 350 K (polytropic discharge through
cross-section S3 with internal losses and heating of the flowing air through the valve
walls and through the cylinder air inlet ducts, which are in the hottest part of the
cylinder head);
3. Compressed air is infused into the cylinder in the area ∆ϕ around the BDC. The values
of ∆ϕ were, according to p-ϕ diagrams on Figure 21, significantly higher than initially
anticipated. In virtually all modes, they point to a vector area of approximately
200 ◦ CA around the BDC, therefore, taking into account some plate motion dynamics
in the self-closing valve; the range ∆ϕ = 150 ◦ CA was set for the calculations;
4. Projects also influenced the state of the filling in the cylinder during the motoring:
the props were simplified in each cycle by recalculating the measured props in a
given motoring mode in the pressure ratio of BDC p180(calculated) /p180(measured) by the
gradual loss of the mass of the cylinder filling so that when the steady state was
reached (i.e., p180(calculated) = p180(measured) ) the calculated mass of the cylinder load
was reduced by the measured props in the cranking mode under investigation. Thus,
at a steady state, the state of ∆Mblow in ∼ = ∆Mblow out will be balanced (the calculation
allows some correction in the calculation settings for ∆Mblow in ).
5. Thermal-technical modelling of the working cycles took place sequentially from
cycle No. 0 so that after determining the pressure, the weight and temperature of
the filling in BDC (after including the calculated mass of heat and profuse for the
cycle, which was counted as single doses in BDC), the mass and pressure in BDC(180)
were inserted as input into the adjusted calculation program. The calculation of
polytropic compression and expansion resulted in a temperature of TBDC(540) , with
which modelling of the next cycle began in the same process as in the previous
cycle. An important quantity in working cycle modelling is determining the mean
temperature of the walls in the cylinder. After a series of test calculations with different
Tmean wall settings, Tmean wall = 390 K (cycle No.0) was selected for the 3000 min−1
and pPAR = 6 bar motoring mode, with a gradual increase up to Tmean wall = 420 K
in cycle No. 30 as a result of the calculations of incremental changes (till the cycle
No. 200) in the cylinder workload (mass, pressure and temperature in BDC(180) )Appl. Sci. 2022, 12, 2155 17 of 22
the calculated masses of the heat, blow-in and blow-out, IMEP_td-loss ) (bar/cycle),
Q_heat transfer (J/cycle) and pmax(360) (bar) were evaluated in each cycle. The runs of
these quantities were plotted graphically and compared with the measurements taken
in the appropriate motoring mode (mean values from statistical evaluation of data
from the high-pressure indication and its thermodynamic analysis). Selected results
are shown in Table 4, complete results are shown in Figure 22.
Figure 21. Cylinder pressure cycles when the engine was motored with the valves permanently
closed, and the compressed air inlet pushed pPAR = 6 bar to self-adjust valves. The change in pPAR
settings only translated into pressure values. In terms of the ∆ϕ range for the self-operating valve
function, the setting of other pPAR values was not significant.
Table 4. Selected results of the calculation of the incremental changes in the cylinder fill state
according to Figure 22.
Initial State in the Cylinder p180 0.55 bar
(Estimated) Mair 0.3 g
Air Pressure Setting in the Rail pPAR 6 bar
Steady State in the Cylinder After 200 cycles 4s
p180 2.98 bar
p180(measured) 3.0 bar
pmax 66 bar
pmax average 67.6 bar
Monitored Quantities in Cycle no. 200
TBDC (180) 272 K
Mair 1.69 g
∆Mblow in 0.004 g/cycle
∆Mblow out 0.0036 g/cycleAppl. Sci. 2022, 12, 2155 18 of 22
Figure 22. The result of calculating the successive changes in cylinder load state in BDC in cycles
from the time of compressed air intake to the automatic valve in the 3000 min−1 modes and the
pressure pPAR = 6 bar.
The seemingly “strange” temperature course of TBDC(180) between cycles 0 and 30
resulted from several factors acting. Initially, the effect of heat transfer to the cylinder
walls prevailed (see graph Q_heat transfer on Figure 23). The area of temperature increase
was related to the gradual change in heat transfer and heat input by the air infused
into the tiny air load of the cylinder. The sustained decrease in TBDC(180) resulted from
increasing Q_heat transfer by increasing the heat transfer coefficient between the air fill and
the cylinder walls.
The transfer of heat between the air filling and the cylinder walls was the integral
result of the action of the heat transfer coefficient (functional dependence on the pressure
and temperature of the air filling and other factors), the temperature drop between the air
filling and the walls, the heat transfer area and time. Calculated heat transfer progress is
shown Figure 23.
Figure 23. Changing the heat between the filling and the cylinder walls for cycle No 200.
The calculation result for cycle No 200 was Q_heat transfer = −7 J/cycle. The calculation
program was set to take heat from the filling into the walls, so the sign for the result means
that the heat from the walls predominated over the cycle to the cylinder filling. At the
same time, the graph shows that under engine conditions with permanently closed valvesAppl. Sci. 2022, 12, 2155 19 of 22
and calculation specifications (mean wall temperature of 420 K), heat transferred from the
charge to the walls in the 1030–1130◦ position of CA (100 ◦ CA, i.e., about the last third of
the piston stroke), the heating of the charge from the walls in the cylinder then proceeded to
about 260 ◦ CA. Transferring heat from the filling to the cylinder walls then affected another
significant parameter of the working cycle, namely thermodynamic losses. Thermodynamic
losses of IMEP_td-loss , which, together with the exchange of heat between the filling and the
walls during the approach of the filling state in the cylinder to the steady-state, are shown
in Figure 24.
Figure 24. Thermodynamic losses of IMEP_td-loss , which, together with the exchange of heat between
the filling and the walls, occured during the approach of the filling state in the cylinder to the
steady-state.
The mean indicated vehicle rolling loss pressure with permanently closed valves
logically increased with the gradual increase in the cylinder mass charge through the intake
of compressed air doses and was also affected by the exchange of heat between the air fill
and the cylinder walls. In cycle No. 200, the calculated value of IMEP_td-loss = 0.776 bar.
Evaluation of thermodynamic analysis of the high-pressure indication of the motored
engine in the 5000 min−1 modes was carried out, and pPAR = 6 bar was the mean value from
statistical data processing of the indication of 200 duty cycles in all cylinders of the motored
engine with permanently closed valves in the IMEP_td-loss_measured size = 0.698 bar. Due to
simplifications in thermal-technical calculations of the motoring engine cycles and some
inaccuracies in determining the mean value from the IMEP_td-loss_measured measurement,
the IMEP_td-loss from the calculated steady-state mode is in relatively good agreement with
the measurement. This result can also be seen as a contribution to confirm the correctness of
the calculation of the incremental state changes in the cylinder load of the engine with the
valves permanently closed and the supply of compressed air doses to adjust the working
pressure in the engine cylinder [12].
5. Discussion
New ways of measuring ICE mechanical losses by motoring are suitable tools for
research and development of both ICE and piston rings, both in the scientific research
field and especially in the automotive industry. From the results produced and the lessons
learned from the experiments conducted, Option A may be considered a more appropriate
way to investigate mechanical losses in the ICE and determine the dependence on engine
cylinder pressure ratios. The measurement for Option B showed that the value of the
mean indicated working pressure of the motoring engine is in good agreement. However,
for this mode of motoring ICE, pulsations occurred in a relatively small volume of a
closed circulation. Pulsations were induced by noncontinuous exhaust-side air inflows andAppl. Sci. 2022, 12, 2155 20 of 22
noncontinuous intake-side air samples. They also affected the reliability of the measurement
of the cylinder capacity exchange work (IMEPL) and thus the reliability of the determination
of mechanical losses in the motored engine. The modification of the ICE for Option A,
while resulting in significant interference with the functional state of the engine, is relatively
simple and completely reversible.
Interestingly, Option A loads the piston group with twice the frequency of the standard
four-stroke ICE. Option A can be used in accelerated wear tests on piston rings and research
on friction loss in the piston group. An essential advantage of Option A with permanently
closed valves is the lower energy intensity compared to motoring a fully functional closed-
circuit engine. Calculated solutions of the state of the cylinder fill of a motoring engine
with permanently closed valves showed a convincing way to change the state quantities
of the cylinder fill and infuse the cylinder with a self-actuating valve for control of engine
cylinder working pressures from pPAR pressure setting until engine operating mode was
stabilised. The result is particularly interesting in terms of the air filling temperatures of
the cylinder in the BDC, which can only be determined by calculation. The calculation
methodology and result are a theoretical addition to the new method of experimental
investigation of mechanical losses in a closed-circuit piston internal combustion engine and
working pressures at the same level as those in a cylinder during regular engine operation.
6. Conclusions
Current methods of measuring the mechanical losses of reciprocating internal combus-
tion engines by motoring make it possible to achieve a maximum of half the pressures in
the engine cylinders compared to the pressures in the actual operation of the engine with
the combustion of the fuel–air mixture. Lower pressures in the engine cylinders caused a
significantly lower force load on the piston group and the crank mechanism. The measured
mechanical losses in the engine cylinders were thus significantly distorted and far from
reality. In the laboratories of the propulsion units of the Faculty of Mechanical Engineer-
ing of the Technical University in Liberec, research was carried out on new methods of
measuring mechanical losses of a reciprocating internal combustion engine by motoring
with pressure in the engine cylinders comparable to the pressures in the cylinders during
standard operation of the combustion engine. The paper shows the results of measuring
mechanical losses by motoring a reciprocating internal combustion engine in two new
ways, including a comparison with the current classical motoring method. It explains
the necessary adjustment of the engine for these measurements. The first new method
involves not changing the cylinder charge and regulating the pressure in the cylinders by
inserting compressed air with automatic valves into the cylinders of the motoring engine.
The second new method is based on a closed working circuit connecting the exhaust with
the intake. The filling pressure in the cylinders is set and maintained by a controlled supply
of compressed air to the intake manifold. The first method proved to be a more suitable
way to investigate mechanical losses in ICEs and determine the dependence of these losses
on the pressure conditions in the engine cylinders. The paper also presented the results of
a theoretical investigation for the state of the cylinder during the rotation of the ICE.
Author Contributions: Conceptualisation, R.P., A.D., R.V. and S.B.; methodology, R.P., A.D., R.V.
and S.B.; data curation, R.P., A.D. and S.B.; validation, R.P., A.D. and S.B.; formal analysis, R.P., A.D.
and S.B.; investigation, R.P., A.D. and S.B.; resources, R.P. and A.D.; draft preparation, R.P., A.D.
and S.B.; writing—review and editing, R.P., A.D., R.V. and S.B.; visualisation, R.P. and A.D.; project
administration, R.V.; funding acquisition, R.V. All authors have read and agreed to the published
version of the manuscript.
Funding: This research was funded at the Technical University of Liberec as part of the project Center
of Competence of the Automotive Industry Josef Božek TN01000026-1-WP02-017 with the support of
the Specific University Research Grant, as provided by the Ministry of Education, Youth and Sports
of the Czech Republic in 2021.
Institutional Review Board Statement: Not applicable.Appl. Sci. 2022, 12, 2155 21 of 22
Informed Consent Statement: Not applicable.
Data Availability Statement: Not applicable.
Conflicts of Interest: The authors declare no conflict of interest.
Abbreviations
Abbreviation/Symbol Description Unit
(C-E) Compression—expansion
(Ex-In) Exhaust—Intake
3D Three-dimensional
BDC(180) Bottom dead centre
CI Engine Compressed ignition engine
CO2 Carbon dioxide
EURO VII European emission standard VII
ICE Internal combustion engine
IMEP Indicated mean effective pressure [bar]
IMEP_loss(in-ex) Indicated mean effective pressure loss of
cylinder volume exchange [bar]
IMEP_loss(sum) Sum of loss indicated mean effective pressures [bar]
IMEP_mech-loss Indicated mean effective pressure of
mechanical losses [bar]
IMEP_mech-loss(C-E) Indicated mean effective pressure of mechanical
losses for compression and expansion [bar]
IMEP_td-loss Indicated mean effective pressure of
thermodynamic losses [bar]
IMEP_td-loss(calculated) Indicated mean effective pressure of thermodynamic
losses—calculated [bar]
IMEP_td-loss(measured) Indicated mean effective pressure of thermodynamic
losses—measured [bar]
IMEPH High-pressure part indicated mean effective pressure [bar]
IMEPL Low-pressure part indicated mean effective pressure [bar]
Mair Mass of air charge in the cylinder [g]
Mcylinder The weight of the cylinder charge [g]
MPI Multipoint injection
p180 Pressure for the initial cycle [bar]
p180(calculated) Pressure for the initial cycle—calculated [bar]
p180(measured) Pressure for the initial cycle—measured [bar]
PAR Pressured air reservoir
pBDC Bottom dead centre pressure [bar]
pBDC(measured) Maximum bottom dead centre pressure—measured [bar]
pBDCmax Maximum bottom dead centre pressure [bar]
pBDCmin Minimum bottom dead centre pressure [bar]
PC Personal computer
pmax Maximum in-cylinder pressure [bar]
pmax(360) Maximum pressure for the entire operating cycle [bar]
Polyn.(IMEP_td-loss(180-540) [bar]) Polynomic curve for indicated mean effective
pressure of thermodynamic losses [J/cycle]
Polyn.(Qheat_transfer [J/cycle]) Polynomic curve for heat transfer [J/cycle]
ppar Pressure inside pressured air reservoir [bar]
pTDC Top dead centre pressure [bar]
pTDC(measured) Minimum top dead centre pressure—measured [bar]
pTDCmax Maximum top dead centre pressure [bar]
pTDCmin Minimum top dead centre pressure [bar]
Qheat_transfer Heat transfer [J/cycle]
S1 Output cross-section (with full plate stroke) [mm2 ]
S2 Cross-section [mm2 ]
S3 Cross-section [mm2 ]Appl. Sci. 2022, 12, 2155 22 of 22
SI Engine Spark-ignition engine
SRED_cross-section Reduced cross-section [mm2 ]
T180 Temperature for the initial cycle [bar]
Tair_blow_in Estimated temperature of the compressed air supplied
by the automatic valve to the cylinder [K]
TBDC(180) Bottom dead centre for the initial cycle [K]
TBDC(540) Bottom dead centre temperature [K]
Tmean_wall Wall mean temperature [K]
Tq_loss Torque loss [Nm]
V1 Pressure hose volume [mm3 ]
V2 Volume of tube terminated by a self-closing plate valve [mm3 ]
V3 Sum of volumes V1 and V2 [mm3 ]
∆Mblow_in Mass of blow-in [g/cycle]
∆Mblow_out Mass of blow-out [g/cycle]
∆ϕ Crankshaft rotation range [◦ CA]
References
1. Beroun, S.; Páv, K. Selected Topics of Vehicle Combustion Engines, 1st ed.; TU Liberec: Liberec, Czech Republic, 2017; p. 149, ISBN
978-80-7372-957-8.
2. Beroun, S.; Voženílek, R. Measurement of Passive Engine Resistances (Complete Engine and Its Selected Groups) by Cranking. Research
Report DVE 617/2009; TU Liberec: Liberec, Czech Republic, 2009; p. 13.
3. Procházka, R.; Dittrich, A. TN01000026-1-WP02-007 Measuring mechanical losses of piston combustion engine by spinning at
various working pressures in engine cylinders. In Proceedings of the M2D2019 8th International Conference Mechanics and
Materials in Design, Bologna, Italy, 4–6 September 2019; Società Editrice Esculapio: Bologna, Italy, 2019; pp. 65–66.
4. Voženílek, R.; Beroun, S.; Dittrich, A. Measuring the passive resistance of the piston combustion engine by cranking with increase
pressure in cylinder. In Proceedings of the XLVIII International Scientific Conference of Czech and Slovak University Departments
and Institutions Dealing with the Research of Combustion Engines, Liberec, Czech Republic, 11–12 September 2017; pp. 191–198,
ISBN 978-80-7494-354-6.
5. Novotný, P.; Píštěk, V.; Drapál, L. Modelling of Piston Ring Pack Dynamics; Journal MECCA IX/02; Czech Technical University in
Prague: Prague, Czech Republic, 2011; pp. 8–12, ISSN 1214-0821.
6. Hopfner, W.; Lösch, S.; Satschen, S.; Winklhofer, E. Friction test procedures in engine development. In Proceedings of the
Conference: 5. Tribologie und Effizienztagung, Györ, Hungary, 19–20 June 2018. Available online: https://www.researchgate.
net/publication/328723117_Friction_test_procedures_in_engine_development/stats (accessed on 8 December 2021).
7. Knauder, C.; Allmaier, H.; Sander, D.E.; Sams, T. Investigations of the Friction Losses of Different Engine Concepts. Part 1: A
Combined Approach for Applying Subassembly-Resolved Friction Loss Analysis on a Modern Passenger-Car Diesel Engine.
Lubricants 2019, 7, 39. [CrossRef]
8. Knauder, C.; Allmaier, H.; Sander, D.E.; Sams, T. Investigations of the Friction Losses of Different Engine Concepts. Part 2:
Sub-Assembly Resolved Friction Loss Comparison of Three Engines. Lubricants 2019, 7, 105. [CrossRef]
9. Allmaier, H.; Knauder, C.; Salhofer, S.; Reich, F.; Schalk, E.; Ofner, H.; Wagner, A. An experimental study of the load and heat
influence from combustion on engine friction. Int. J. Engine Res. 2015, 17, 347–353. [CrossRef]
10. Voženílek, R.; Beroun, S.; Procházka, R. New Method of Measuring Mechanical Losses by Motoring of Internal Combustion Engine.
In Proceedings of the 51th International Scientific Conference of Czech and Slovak University Departments and Institutions
Dealing with the Research of Internal Combustion Engines, CTU Prague, Czech Republic, 9–10 September 2020; pp. 60–69, ISBN
978-80-01-06744-4.
11. Mikulanin, L.; Dittrich, A.; Dráb, O. Measurement of the Passive Resistance of the 1.6 MPI Engine at the Spinning Station; TU Liberec:
Liberec, Czech Republic, 2015; Unpublished DVE Working Document.
12. Beroun, S. The State of the Cylinder Filling when Motoring the ICE without Replacing the Filling and Controlled Air Supply for Increasing
Pressure; TU Liberec: Liberec, Czech Republic, 2020; Research Report DVE.You can also read


