Multimodal Observation and Classification of People Engaged in Problem Solving: Application to Chess Players - MDPI
←
→
Page content transcription
If your browser does not render page correctly, please read the page content below

Multimodal Technologies
           and Interaction

Article
Multimodal Observation and Classification of People
Engaged in Problem Solving: Application to
Chess Players
Thomas Guntz, Raffaella Balzarini, Dominique Vaufreydaz and James Crowley *
 University Grenoble Alpes, Inria, CNRS, Grenoble INP, LIG, F-38000 Grenoble, France;
 Thomas.Guntz@inria.fr (T.G.); Raffaella.Balzarini@inria.fr (R.B.); Dominique.Vaufreydaz@inria.fr (D.V.)
 * Correspondence: James.Crowley@inria.fr; Tel.: +33-476615361

 Received: 28 February 2018; Accepted: 23 March 2018; Published: 31 March 2018

 Abstract: In this paper we present the first results of a pilot experiment in the interpretation of
 multimodal observations of human experts engaged in solving challenging chess problems. Our goal
 is to investigate the extent to which observations of eye-gaze, posture, emotion and other physiological
 signals can be used to model the cognitive state of subjects, and to explore the integration of multiple
 sensor modalities to improve the reliability of detection of human displays of awareness and emotion.
 Domains of application for such cognitive model based systems are, for instance, healthy autonomous
 ageing or automated training systems. Abilities to observe cognitive abilities and emotional reactions
 can allow artificial systems to provide appropriate assistance in such contexts. We observed chess
 players engaged in problems of increasing difficulty while recording their behavior. Such recordings
 can be used to estimate a participant’s awareness of the current situation and to predict ability to
 respond effectively to challenging situations. Feature selection has been performed to construct
 a multimodal classifier relying on the most relevant features from each modality. Initial results
 indicate that eye-gaze, body posture and emotion are good features to capture such awareness.
 This experiment also validates the use of our equipment as a general and reproducible tool for the
 study of participants engaged in screen-based interaction and/or problem solving.

 Keywords: multimodal perception; affective computing; situation awareness

1. Introduction
     Commercially available sensing technologies are increasingly able to capture and interpret
human displays of emotion and awareness through non-verbal channels. However, such sensing
technologies tend to be sensitive to environmental conditions (e.g., noise, light exposure or occlusion),
producing intermittent and unreliable information. Techniques for combining multiple modalities to
improve the precision and reliability of modeling of awareness and emotion are an open research
problem. Few research results have been published on how such signals can be used to inform a system
about cognitive processes such as situation awareness, understanding or engagement. For instance,
published results show that mental states can be inferred from facial expressions and from head and
body gestures [1,2].
     Awareness of mental and emotional state of the human partner could allow systems to deliver
more appropriate services during interactions. For example, a system for testing cognitive abilities
can be useful for assessing cognitive decline from ageing. An ability to model the cognitive abilities
of elderly subjects can permit an artificial systems to provide assistance that is appropriate but not
excessive. Such an ability can be used to provide appropriate emotion and cognitive stimulation
replacing gradual declines in natural cognitive and motor abilities. Similarly, the abilities to model
mental state and emotional reaction can be used in on-line training systems to pose challenges that

Multimodal Technologies and Interact. 2018, 2, 11; doi:10.3390/mti2020011           www.mdpi.com/journal/mti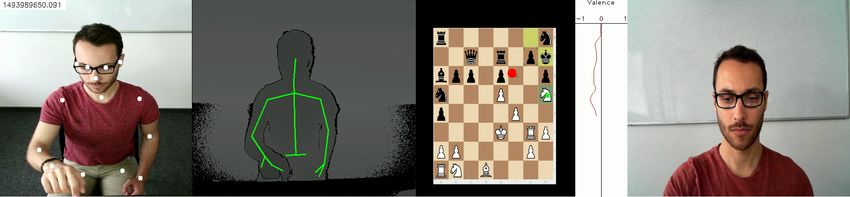
Multimodal Technologies and Interact. 2018, 2, 11                                                             2 of 18

stimulate a user to learn while avoiding problems that are overly simple (boring) or excessively difficult
(frustrating). Such systems can be constructed for interactive training of games (including chess) as
well as any other area of cognitive activity such as reading, mathematics, programming, chemistry
and engineering.

      Figure 1. Multimodal view of gathered data. Left to right: RGB (with body joints) and depth view
      from Kinect 2 sensors, screen record of chess task (red point is current position of gaze, green point is
      position of last mouse click), plot of current level of positive emotion expression (valence) and frontal
      view of face from webcam sensor.

     We have constructed an instrument for capturing and interpreting multimodal signals of humans
engaged in solving challenging problems (see Figure 1). Our instrument, shown in Figure 2, captures
eye gaze, fixations, body postures, and facial expressions signals from humans engaged in interactive
tasks on a touch screen. As a pilot study, we have observed these signals for players engaged in solving
chess problems.

      Figure 2. The experimentation equipment used for data collection. On top, a Kinect2 device looking
      down at the player. In the middle, a webcam to capture the face. At bottom, the touch screen equipped
      with an eye-tracker presenting the chess game. These views are respectively at left, right and center
      of Figure 1. The wooden structure is rigid to fix position and orientation of all sensors. The lighting
      conditions are controlled by 2 USB LED lamps on the sides.

     Recordings are used to estimate subjects’ understanding of the current situation and their ability to
respond effectively to challenging tasks. Such recorded data are to be used to detect when participants
Multimodal Technologies and Interact. 2018, 2, 11 3 of 18
are challenged beyond their abilities. In this paper we present results with experiments that evaluate
the event to which our set up can capture information about cognitive abilities.
Section 2 discusses current methods for capture and interpretation of physiological signs of
emotion and awareness. This lays the ground for the design of our experimental setup presented in
Section 3. Section 4 presents the results from our pilot experiment that was undertaken to validate
our installation and evaluate the effectiveness of our approach. We conclude with a discussion on
limitations and further directions to be explored in Section 5.
2. State-of-the-Art
Chess analysis has long been used in Cognitive Science to understand attention and to develop
models for task solving. In their study [3,4], Charness et al. showed that when engaging in competitive
game, chess players display engagement and awareness of the game situation with eye-gaze and
fixation. This suggests that the mental models used by players can be at least partially determined from
eye gaze, fixation and physiological response. The ability to detect and observe such models during
game play can provide new understanding of the cognitive processes that underlay human interaction.
Experiments described in this article are the preamble to more advanced research on this topic.
Humans display awareness and emotions through a variety of non-verbal channels. It is
increasingly possible to record and interpret information from such channels. Thank to progress
in related research, notably recently using Deep Learning approaches [5–8], publicly available efficient
software can be used to detect and track face orientation using commonly available web cameras.
Concentration can be inferred from changes in pupil size [9]. Measurement of physiological signs of
emotion can be done by detection of Facial Action Units [10] from both sustained and instantaneous
displays (micro-expressions). Heart rate can be measured from the Blood Volume Pulse as observed
from facial skin color [11]. Body posture and gesture can be obtained from low-cost RGB sensors with
depth information (RGB+D) [12]. Awareness and attention can be inferred from eye-gaze (scan path)
and fixation using eye-tracking glasses as well as remote eye tracking devices [13]. This can be directly
used to reveal cognitive processes indicative of expertise [3], situation awareness in human-computer
interaction (HCI) systems [14] or vigilance system used in cars [15].
The information provided by each of these modalities tends to be intermittent, and thus unreliable.
Most investigators seek to combine multiple modalities to improve both reliability and stability [16,17].
Drawing on recent results from computer vision and cognitive science, this study proposes an
experimental set up based recently published techniques to interpret subjects engaged in solving
challenging problems. Our initial research question was:
• Can our experimental set up be used to capture reliable recordings for such study?
If successful, this should allow us to a second research question:
• Can we detect when chess players are challenged beyond their abilities from such measurements and what
are the most relevant features?
3. Experiments
As a pilot study, chess players were asked to solve chess tasks within a fixed, but unknown,
time frame. We recorded eye gaze, facial expressions, body postures and physiological reactions of the
players as they solved problems of increasing difficulty.
3.1. Materials and Participants
3.1.1. Experimental Setup
Figure 2 presents the recording setup for our experiment. This system drew on lessons learned
from an earlier system used to record children during storytelling sessions [18]. As can be seen from
Figure 2, it is composed of several hardware elements: a 23.8 inches Touch-Screen computer, a KinectMultimodal Technologies and Interact. 2018, 2, 11 4 of 18
2.0 mounted 35 cm above the screen focusing on the chess player, a 1080p Webcam for a frontal view, a
Tobii Eye-Tracking bar (Pro X2-60 screen-based) and two adjustable USB-LED for lighting condition
control. The Touch-Screen was chosen to provide a gesture-based interaction resembling play with a
physical board. A wooden super-structure is used to rigidly mount the measuring equipment with
respect to the screen in order to assure identical sensor placement and orientation for all recordings.
This structure has been made using a laser cutter.
Several software systems were used for recording and/or analyzing data. The Lichess Web
Platform (https://en.lichess.org/ (last seen September 2017)) serves for playing and recording games.
Two commercial software systems provide both online and offline information: Tobii Studio 3.4.7 for
acquisition and analyze of eye-gaze; Noldus FaceReader 7.0 for emotion detection. Body posture
is provided by two different means: by the Kinect 2.0 SDK and by using our enhanced version
of the Realtime Multi-Person Pose Estimation software [6]. Considering the state-of-the-art results
of the second software, we decided to keep only this one for this experiment. During the study,
data were recorded from all sensors (Kinect 2, Webcam, Screen capture, user clicks, Tobii-Bar) using the
RGBD Sync SDK (https://github.com/Vaufreyd/RGBDSyncSDK (last seen September 2017)) from the
MobileRGBD project [19]. This framework provides synchronization of data (gaze fixation, emotion
detection, body skeleton position, etc.) by associating a timestamp with a millisecond precision to each
recorded frame. The same framework can read, analyze and display the same way all gathered or
computed data. An example is presented on Figure 1 where most of the data are depicted.
3.1.2. Participants
An announcement for our experiment with an invitation to participate was communicated to
chess clubs, on the local university campus and within the greater metropolitan area. We received a
positive response from the president of one of the top metropolitan area chess clubs, and 32 members
volunteered to participate in our pilot experiment. Unfortunately, of these initial 32 participants,
9 recordings were not usable due to poor eye-tracking results and have not been included in our
analysis. These poor tracking results were traced to several causes: some participants had difficulties
to performing the eye-tracking calibration process, or the eye-tracking process was disrupted too many
times by participants’ movement (e.g., head movements, hand covering the eye-tracking viewing field
etc.) during long recording time (some of them last up to 40 min).
The 23 remaining chess players in our study were 9 experts and 14 intermediates level players
(10-51 years, 2 female, age: M = 30.0; SD = 12.9). Expert players were all active players and with Elo
ratings ( The Elo system is a method to calculate rating for players based on tournament performance.
Ratings vary between 0 and approximately 2850. https://en.wikipedia.org/wiki/Elo_rating_system
(last seen September 2017)) ranged from 1759 to 2150 (M = 1937.3; SD = 123.2). For the intermediate
players, the Elo ratings ranged from 1100 to 1513 (M = 1380.3; SD = 100.5) and 6 among them
were casual players who were not currently playing in club. We can also give some statistics on the
recorded session: the average recording time per participant is 13:35 min (MI N = 4:54, MAX = 23:54,
SD = 5:02) and the average compressed size of gathered data is 56.12 GiB per session.Multimodal Technologies and Interact. 2018, 2, 11 5 of 18
3.2. Methods
3.2.1. Chess Tasks
Thirteen chess tasks were defined by our team in coordination with the president of the chess club.
Two kinds of task were selected: chess openings tasks, where only 3 to 5 moves were played from the
original state; and N-Check-Mate tasks, where 1 to 6 moves were required to check-mate the opponent
(and finish the game).
Openings. Skilled players are familiar with most of the chess openings and play them intuitively.
Intuitive play does not generally require cognitive engagement for reasoning. An important challenge
is to detect when a player passes from intuitive reaction to a known opening, to challenging situations.
Thus, two uncommon openings were selected to this end: a King’s Gambit (3 moves from the initial
state) and a Custom Advanced Variation of the Caro-Kann Defense (6 moves from initial state).
The goal here is to pull participants out from their comfort zone as much as possible to evoke emotions
and physiological reactions. Openings correspond to task number 1 and 2.
N-Check-Mate. Eleven end game tasks were defined. These are similar to the daily chess
puzzles that can be found in magazines or on chess websites. Each of these tasks was designed to
check-mate the opponent in a number of predefined moves ranging from 1 to 6. Tasks requesting 1 to
3 moves are viewed as easy task whereas 4 to 6 moves tasks require more chess reasoning abilities, etc.
Distribution among the 11 tasks differs according to their number of required move and thus to their
difficulty: 4 tasks with one move, 4 tasks with two and three moves (2 of each) and 3 tasks with four,
five and six moves (1 of each). End games were presented to participants in this order of increasing
difficulty while alternating the played color (white/black) between each task.
3.2.2. Procedure
Participants were tested individually in sessions lasting approximately 45 min. Each participant
was asked to solve the 13 chess tasks and their behaviors were observed and recorded. To avoid
biased behavior, no information was given about the recording equipment. Nevertheless, it was
necessary to reveal the presence of the eye-tracker bar to participants in order perform a calibration
step. After providing informed consent, the Lichess web platform was presented and participants
could play a chess game against a weak opponent (Stockfish (Stockfish is an open-source game engine
used in many chess software, including Lichess. https://en.wikipedia.org/wiki/Stockfish_(chess)
(last seen September 2017)) algorithm level 1: lowest level) to gain familiarity with the computer
interface. No recording was made during this first game.
Once familiar and comfortable with the platform, the eye-tracking calibration was performed
using Tobii Studio software, in which subjects were instructed to sit between 60 and 80 cm from
the computer screen and to follow a 9-point calibration grid. Participants were requested to avoid
large head movement in order to assure good eye-tracking quality. Aside from this distance, no other
constraints were instructed to participants.
Each task to solve was individually presented, starting with the openings, followed by the
N-Check-Mate tasks. Participants were instructed to solve the task by either playing a few moves
from the opening or to check mate the opponent (played by Stockfish algorithm level 8: the highest
level) in the required number of moves. The number of moves needed for the N-Check-Mate tasks
was communicated to the subject. A time frame was imposed for each task. The exact time frame
was not announced to the participant, they only knew that they have a couple of minutes to solve
the task. This time constraint ranges from 2 min for the openings and the easiest N-Check-Mate tasks
(1–2 moves) to 5 min for the hardest ones (4–5–6 moves). An announcement was made when only one
minute was remaining to solve the task. If the participant could not solve the task within the time
frame, the task was considered as failed and the participant proceeded to the next task. The experiment
is considered finished once all tasks were presented to the participant.Multimodal Technologies and Interact. 2018, 2, 11 6 of 18
3.3. Analysis
3.3.1. Eye-Gaze
Eye movement is highly correlated with focus of attention and engaged cognitive processes [20],
in problem solving and human-computer interaction [21]. Other studies [3,4] show that expertise
estimation for chess players can be performed using several eye-tracking metrics such as fixation
duration or visit count. In this case, gaze information can be useful to determine information such as:
1. What pieces received the most focus of attention from participants?
2. Is there significant difference in gaze movements between novices and experts?
To reach these aims, Areas Of Interests (AOIs) were manually defined for every task. An AOI can
be a key piece for the current task (e.g., a piece used to check-mate the opponent), the opponent king,
destination squares where pieces have to be moved, etc. An example of AOI is showed on Figure 3
where 3 different AOIs are drawn. One AOI is center around the black king, one around a white
bishop and the last covered an empty square where the bishop should be moved to complete the
task. Afterward, statistics have been computed for every AOI of each task. Among possible metrics,
results depicted in this article are based on Fixation Duration, Fixation Count and Visit Count.
Figure 3. Three Areas Of Interests (AOIs) are centered around 2 key pieces and one square where a
piece has to be moved.
Interpretation for these metrics differs according to the task domain. For example, in the domain
of web usability, Ehmke et al. [22] would interpret long fixation duration on AOI as a difficulty to
extract or interpret information from an element. In the field of chess, Reingold and Charness [3,4]
found significant differences in fixation duration between experts and novices.
3.3.2. Facial Emotions
Micro-expressions, as defined by Ekman and Fiesen [10] in 1969, are quick facial expressions of
emotions that could last up to half a second. These involuntary expressions can provide information
about cognitive state of chess players. In our pilot study, the Noldus FaceReader software [23]
has been used to classify players’ emotions in the form of six universal states proposed by Ekman:Multimodal Technologies and Interact. 2018, 2, 11 7 of 18
happiness, sadness, anger, fear, disgust and surprise (plus one neutral state). These emotional states
are commonly defined as regions in a two-dimensional space whose axes are valence and arousal.
Valence is commonly taken as an indication of pleasure, whereas arousal describes the degree to which
the subject is calm or excited.
In practice, the FaceReader software analyses video by first applying a face detector to identify a
unique face followed by a detection of 20 Facial Action Units [10]. Each action unit is assigned a score
between 0 and 1 and these are used to determine the state label for emotion. Valence and arousal can
be then computed as:
• Valence: intensity of positive emotions (Happy) minus intensity of negatives emotions (sadness, anger,
fear and disgust);
• Arousal: computed accordingly to activation intensities of the 20 Action Units.
Finally, besides giving us information about emotional responses, FaceReader software also
provided a heart rate estimation.
FaceReader was tested on two different datasets: the Radboud Faces Database [24]
containing 59 different models and the Karolinska Directed Emotional Faces [25] which regroups
70 individuals. Both dataset display 7 different emotional expressions (plus neutral) on different angles.
FaceReader algorithm correctly classified 90% of the 1197 images from Radboud Face Database [26]
and 89% of the Karolinska Dataset (4900 images) [23].
3.3.3. Body Posture
Body posture is a rich communication channel for human to human interaction with important
potential for human computer interaction [27]. Studies have shown that self-touching behavior is
correlated with negative affect as well as frustration in problem solving [28]. Thus, we have investigated
a number of indicators for stress from body posture:
• Body Agitation: how many joints are varying along x, y and z axis;
• Body Volume: space occupied by the 3D bounding box built around joints (see [29]);
• Self-Touching: collisions between wrist-elbow segments and the head (see [30]).
These signals are computed from the RGBD streams recorded by the Kinect 2 where a list of
body joints is extracted by means of our variant of a body pose detection algorithm [6]. These joints
are computed on the RGB streams and projected back to Depth data. Thus, a 3D skeleton of the
chess player is reconstructed and can be used as input to compute previous metrics. As one can see
on Figure 1 at left, from the point of view of the Kinect 2 in our setup (see Figure 2), the skeleton
information is limited to the upper part of the body, from hips to head.
Table 1. Features of interest.
Features Modality Sensor
Fixation Duration
Fixation Count Eye-Gaze Tobii Bar
Visit Count
7 Basics Emotions
Valence
Emotion Webcam
Arousal
Heart Rate
Agitation (X, Y, Z)
Volume Body Kinect
Self-TouchMultimodal Technologies and Interact. 2018, 2, 11 8 of 18
4. Results
Synchronous data for every feature, depicted in Table 1, have been extracted from all sensors.
Several tasks, like regression over Elo ratings or over the time needed to perform a task, could be
addressed using these data. Among them, we chose to analyze a classification problem that can be
interpreted by a human: Is it possible, by the use of gaze, body and/or facial emotion features, to
detect if a chess player is an expert or not? This problem is used as example to obtain a first validation
of our data relevancy. It is correlated with whether a chess player is challenging beyond his abilities
or not. This section presents unimodal and multimodal analysis of extracted features to determine
chess expertise of players. Only the data recorded for the 11 N-Check-Mate tasks are considered here,
outcomes for participants are presented in Table 2.
Table 2. Experts and Intermediates results summary for N-Check-Mate tasks. The number of moves
required to complete the task is also given. The higher the number of moves needed, the higher
the difficulty.
Task 1 Task 2 Task 3 Task 4 Task 5 Task 6 Task 7 Task 8 Task 9 Task 10 Task 11
Difficulty of the task Easy Easy Easy Easy Easy Easy Medium Medium Hard Hard Hard
Number of moves required
1 1 1 1 2 2 3 3 4 5 6
to complete the task
Number of experts who
9 8 8 9 9 9 9 8 8 4 1
pass the task (/9)
Number of intermediates who
13 9 12 8 12 13 7 6 3 2 0
pass the task (/14)
4.1. Unimodal Analysis
4.1.1. Eye-Gaze
Two AOIs were defined for each task: one AOI is centered on the very first piece to move in the
optimal sequence to successfully achieve the check-mate; and the second one on the destination square
where this piece has to be moved. Fixations information of every task are gathered for all participants
and results are presented in Figure 4.
Experts Intermediates
15 25
20 19.36
10.55
10
15 14.27
7.45
10
5
5
0 0
Fixation Time Fixation Count
Figure 4. Eye-gaze histograms. Left: Percentage of fixation (in seconds) for all tasks. Right: average
over all tasks of the number of fixations.Multimodal Technologies and Interact. 2018, 2, 11 9 of 18
As can be clearly seen in this figure, experts have longer and more fixations than intermediates
on relevant pieces. These results can be explained knowing the four stages of the thought process for
chess players proposed by De Groot [31]:
1. The orientation phase: participants scan the board to grasp information about piece’s organization;
2. The exploration phase: participants consider variations (moves) from the current configuration;
3. The investigation phase: participants analyze in depth the two most probable candidates from
phase 2;
4. The proof phase: participants confirm the validity of their choice.
In our experiments, intermediates were found to spend less time fixating on relevant pieces than
experts, one hypothesis could be that these participants spend more time during the first phase or
do not consider the correct pieces fast enough during the investigation phase. On the other hand,
experts tend to spend more time on relevant pieces. This difference in duration between experts and
intermediates is statistically significant (p < 0.05) and could be used as discriminant feature. This is
explained by expert’s skill encoding capacity that enables them to quickly focus their attention on
relevant piece by a better pattern matching ability. More work has to be done on eye-gaze such as
analyzing and comparing the scan path order of participants, measuring how fast are participants to
identify relevant pieces or analyzing fixation on empty squares.
4.1.2. Emotions
The increasing difficulty in the non-interrupting tasks has caused our participants to express
more observable emotions across the experiment. Emotions in a long-task experiment are expressed as
peaks in the two-dimensional space (valence, arousal). Thus, standard statistics tend to shrink toward
zero as the record becomes longer.
Other approaches should be considered to visualize emotion expressions. One possibility is to
consider the number of changes of emotions having the highest intensity (i.e., the current detected
facial emotion). As emotion intensities are based on facial unit detection, changes in the main emotion
denote underlying changes in facial expression. The result metric is shown on the graph presented in
Figure 5a.
Average count of main emotion change
15 15
experts experts
experts (no outlier) intermediates
intermediates
10 10
5 5
0 0
1 2 3 4 5 6 7 8 9 10 11 1 2 3 4 5 6 7 8 9 10 11
Task Number Task Number
(a) (b)
Figure 5. Average count of variation of main detected facial emotion in regard to the task (1–13).
Tasks are ranging in an increasing difficulty order. (a) Current study analysis on 23 participants;
(b) Previous study realized on 14 participants.Multimodal Technologies and Interact. 2018, 2, 11 10 of 18
It is clear from our data that expressions of emotion increases with the difficulty of the problem to
solve. For both group levels, experts and intermediates, the number of observable emotions increases
when participants started to be challenged with difficult tasks. As can be observed, all lines remain
close to 0 for tasks requiring less than 3 moves to check mate the opponent (below task number 6).
From task 7 (3 moves), participants started to be challenged. Among the expert group, one participant
presented surprising results with a really high number of emotion variations. This participant could
be interpreted as an outlier as more than twice the average of variations have been detected for him.
To illustrate this, two lines have been plotted, the cyan one represents all experts, whereas the blue one
omits this potential outlier. To support this outlier hypothesis, the resulting blue line (along with the
red line for intermediates participants) is similar to a result we showed during the same experiment
environment with 14 participants (see Figure 5b). More analysis have to be performed to determine if
the cause of this high expressiveness is due to the participant himself or is caused by an unexpected
behavior from the emotion detection software.
Another interesting aspect of that plot is the final decrease for both groups after task 9, this could
be interpreted as a sort of resignation, when players knew that tasks beyond of their skills and could
not be resolved. Indeed, as showed in Table 2, only 6 participants (2 intermediates and 4 experts)
passed the 10th task and only one expert solved the last task.
These primary results suggest that situation understanding and expertise knowledge can be
inferred from variation of facial emotions. Although, more detailed analysis, such as activation of
Action Units, derivative of emotions or detection if a micro expression occurs right after a move being
played should be performed.
4.1.3. Body Posture
Published research has shown that physiological reactions such as stress can be observable
through body behavior to [28]. Using technique presented in [30] to detect self-touching, we can
observe how participants’ body reacts to the increasing difficulty of tasks.
The Figure 6 presents statistics about self-touching. Similarly to the results on emotions, a
variation in participants’ behavior is observed from the first task requiring more than 2 moves (task 7)
to be completed. This change is observed as an increase of self-touches, especially for intermediates
whereas experts’ line shape looks more like the beginning of an exponential curve. Thus, a first
observation is that the number of self-touches increases as tasks get harder and it reveals that this is a
relevant feature to consider. Furthermore, the difference in number of self-touches between experts
and intermediates is statistically significant (p < 0.05) and could be used, as well as other related
features on body (like agitation), to perform a classification. More discussion of this experiment can be
found in Section 5.
4.2. Statistical Classification and Features Selection
To demonstrate the potential benefit of a multimodal approach, a supervised machine learning
algorithm has been used to quantify accuracy of different modalities for classification.
Support Vector Machines (SVM) have been built for each modality and for each possible
combination of modalities. For this purpose, we computed statistical analysis in respect to the
nature of our data: discrete (count, duration) or continuous (mean, variance, standard deviation)
over our features of interest. Giving us a total of 3 features for the gaze modality, 30 for the emotion
modality and 14 for body modality. (see Table 3). Then, we constructed input samples as the following:
one input sample would be the instantiation of one participant for one particular task, given a total
number of 23 × 11 = 253 input samples.Multimodal Technologies and Interact. 2018, 2, 11 11 of 18
20
experts
intermediates
Count of self-touching
15
10
5
0
1 2 3 4 5 6 7 8 9 10 11
Task Number
Figure 6. Count of self-touching in regard to the task (1–11). Tasks are ranging in an increasing
difficulty order.
Table 3. Features of interest overview.
Modality Features Data Type Statistical Transformation Number of Features
Fixation Discrete Duration-Count 2
Gaze
Visit Discrete Count 1
7 Basics Emotions Continuous Mean - Var - Std 21
Valence Continuous Mean - Var - Std 3
Emotion
Arousal Continuous Mean - Var - Std 3
Heart Rate Continuous Mean - Var - Std 3
Agitation (X, Y, Z) Continuous Mean-Var-Std 9
Body Volume Continuous Mean-Var-Std 3
Self-Touch Discrete Duration-Count 2
A 10-fold stratified cross-validation procedure has been used on every SVM to compute their
accuracy. An exhausting grid search over different set of hyper parameters is used to explore and
find the best parameters for each SVM to consider. Two grids were explored, one RBF kernel and one
Linear kernel. The C parameter for both kernels took values in [1, 10, 50, 75, 100, 1000] and the γ for
RBF kernel ranged in [0.1, 0.01, 0.001, 0.0001, 0.00001, 0.000001]. To compute accuracy for one SVM,
each stratification is randomly shuffled before splitting into batches and before computing accuracy.
This process is repeated 100 times and the final accuracy for the SVM is the average of all randomly
shuffled stratification.
Accuracy results over all features are depicted in the first line of Table 4. First observation is that
emotion and body modalities reached good accuracies, 86% and 90% respectively, confirming that
theses features capture relevant information. Gaze modality performed less than expected, only 62%,
this could be explained by the way the metric have been chosen. Indeed, we decided first to analyze
fixations for only 2 AOIs without considering scan path order. More work has to been performed to
improve gaze interpretation.Multimodal Technologies and Interact. 2018, 2, 11 12 of 18
Table 4. Best accuracy scores from cross-validation for SVMs (10-Fold Cross Validation). The number of
sample N is the number of participants (23) times the number of N-Check-Mate tasks (11). Columns are
the modality subset chosen to train the SVM (G: Gaze, B: Body, E: Emotion).
Modalities G B E G+B G+E B+E G+B+E
Number of Features 3 14 30 17 33 44 47
Accuracy Score 0.62 0.90 0.86 0.81 0.86 0.83 0.83
Standard Deviation 0.24 0.09 0.17 0.14 0.16 0.12 0.19
Secondly, modality fusion varied between 81% and 86% for any possible combination which is
less than a unimodal approach. To perform expertise classification, one might be tempted to choose
only body or emotions features. However, a system relying on a unique modality may face unreliable
or noisy data in real life conditions. For example, an emotion detection can not be performed if there is
occlusions in front of the subject head. Being able to rely on multi modalities to build a robust system
is essential. Now, as several features characterize each modality and our system takes into account
47 features, we propose to evaluate the most relevant for the expertise classification task.
For this purpose, among existing methods in the literature, we selected two different techniques,
the first one is the Minimum Redundancy Maximum Relevance (mRMR) technique [32] for the
expressiveness of the selected features we experienced formerly [33] and the second is the Fisher
Feature Selection [34,35]. These algorithms allow a dimensionality reduction of the feature
space according to the maximal statistical dependency criterion based on mutual information.
Both techniques search to maximize features relevance and effectiveness, however, they differ in
their redundancy policy. Indeed, mRMR will try to reduce redundancy as much as possible even if
its impact the overall effectiveness, on the other hand, Fisher may keep redundancy if it can improve
effectiveness. We propose here to use both techniques separately on our data and compare results.
Using these techniques, we expect to reduce drastically the feature space to improve the data
fusion performed by the SVM classifier. Both mRMR and Fisher techniques have been used on all our
features and the resulting ranking are listed in Tables 5 and 6. A key information here is that among
the top rated selected features, all three modalities are present. It confirmed that all modalities bring
relevant information. Fisher’s selection rather prefer to keep body and emotion information as its
maximize effectiveness, this has been observed with SVM accuracy (see Table 4), even if some features
are redundant (like agitation in x, y, z) where mRMR preferred to keep only one of them. It is interesting
to observe that both techniques agreed to select top feature for each modality. Variance about agitation
and volume combined with the number of self-touches give us significant information about body
behavior. Variance, standard deviation and mean about valence, heart rate and —negatives—basics
emotions (disgusted, scared and angry) capture emotional reactions the participants when being
challenged. Finally, as specified in Section 4.1.3, fixation duration is relevant to classify a participant as
expert or intermediate.
With the aim of benefit from both feature selections, the impact on accuracy is showed on Figures 7
and 8. Highest accuracy score for mRMR selection is 84% using its top 9 ranked features. Using Fisher
features selection, accuracy can reach up to 90% with its top 7 ranked features. One interesting
observation from these plots is the two different paces for accuracies to reach their maximum. Only 4
non redundant features combined from mRMR ranking are enough to reach more than 80% of accuracy
where the slowly but steady curve from Fisher needs to combine 7 features to go beyond this 80%
threshold (and going even way higher with 90%). 8 firsts features are enough to reach up to 77%,
which is close from the one achieved earlier (82%) by using all features.
These results show that features from different modalities are not equally relevant. Figure 7
illustrates that after certain amount of features, performance stagnates or even decreases slightly.
This phenomena starts after 15 and 17 features for mRMR and Fisher techniques respectively. This can
have 2 explanations. The first one is that the number of input data is not high enough to takeMultimodal Technologies and Interact. 2018, 2, 11 13 of 18
advantage of these features. The second explanation is that these last features do not actually provide
new information for classification. This hypothesis is consistent with the ranking results from both
mRMR and Fisher techniques which classified them last and therefore shows that thy contain a large
amount of redundant information already included in top features.
Table 5. Ordered list of the 20 most relevant features generated by mRMR algorithm [32].
mRMR
Feature Modality Description
Ranking Order
1 Y_Agitation_var Body Variation of agitation on Y axis
2 Disgusted_std Emotion Standard Deviation of the detected basic emotion: Disgusted
3 Fixation_Duration Gaze Average Fixation Duration on AOI
4 Valence_mean Emotion Mean of the computed Valence
5 Volume_var Body Variance of the body volume
6 HeartRate_std Emotion Standard Deviation of Heart Rate
7 Angry_var Emotion Variance of the detected basic emotion: Angry
8 SelfTouches_Count Body Average number of self-touches
9 Scared_var Emotion Variance of the detected basic emotion: Scared
10 Angry_mean Emotion Mean of the detected basic emotion: Angry
11 Fixation_Count Gaze Average Number of Fixation on AOI
12 X_Agitation_std Body Standard Deviation of agitation on X axis
13 Happy_mean Emotion Mean of the detected basic emotion: Happy
14 Disgusted_var Emotion Variation of the detected basic emotion: Disgusted
15 Volume_std Body Standard Deviation of the body volume
16 HeartRate_mean Emotion Mean of Heart Rate
17 Sad_std Emotion Standard Deviation of the detected basic emotion: Sad
18 Arousal_mean Emotion Mean of the computed arousal
19 SelfTouches_Duration Body Average duration of self-touches
20 Neutral_var Emotion Variation of the detected basic emotion: Neutral
Table 6. Ordered list of the 20 most relevant features generated by Fisher algorithm [35].
Fisher
Feature Modality Description
Ranking Order
1 Valence_mean Emotion Mean of the computed Valence
2 Y_Agitation_var Body Variation of agitation on Y axis
3 Z_Agitation_var Body Variation of agitation on Z axis
4 Y_Agitation_std Body Standard Deviation of agitation on Y axis
5 X_Agitation_var Body Variation of agitation on X axis
6 Angry_mean Emotion Mean of the detected basic emotion: Angry
7 Z_Agitation_std Body Standard Deviation of agitation on Z axis
8 X_Agitation_std Body Standard Deviation of agitation on X axis
9 Volume_mean Body Mean of the body volume
10 HeartRate_mean Emotion Mean of Heart Rate
11 Disgusted_std Emotion Standard Deviation of the detected basic emotion: Disgusted
12 Angry_var Emotion Variance of the detected basic emotion: Angry
13 Sad_mean Emotion Mean of the detected basic emotion: Sad
14 Fixation_Duration Gaze Average Fixation Duration on AOI
15 X_Agitation_mean Body Mean of agitation on X axis
16 Y_Agitation_mean Body Mean of agitation on Y axis
17 Z_Agitation_mean Body Mean of agitation on Z axis
18 Disgusted_var Emotion Variance of the detected basic emotion: Disgusted
19 Volume_std Body Standard Deviation of the body volume
20 SelfTouches_Count Body Average number of self-touchesMultimodal Technologies and Interact. 2018, 2, 11 14 of 18
1
0.8
SVM Accuracy
0.6
0.4
0.2
Fisher
mRMR
0
30 25 20 15 10 5
Size of Feature Space
Figure 7. Mean of the accuracy scores from 10-fold cross-validation for SVMs with decreasing number
of features. Features order is given by mRmR (see Table 5) and Fisher (see Table 6) algorithms.
1 1
0.8 0.8
SVM Accuracy
SVM Accuracy
0.6 0.6
0.4 0.4
0.2 0.2
0 0
30 25 20 15 10 5 30 25 20 15 10 5
Size of Feature Space Size of Feature Space
(a) (b)
Figure 8. Mean with standard deviation of the accuracy scores from 10-fold cross-validation for
SVMs with decreasing number of features. Features order is given by Fisher (see Table 6) and mRMR
(see Table 5) algorithms. (a) Fisher ranking features; (b) mRMR ranking features.
5. Discussion
This research and primary results (see Section 4) show consistency results on unimodal features
used to distinguish expert and intermediate chess players. Although these results appear promising,
they are only preliminary: the number of participants (23); the variation of recording duration
(from seconds to a couple of minutes depending on the task and players’ expertise); and the tasks
must all be expanded and developed. Due to the size of our dataset, generalizing this preliminary
results is not possible for the moment. Further experiments must be conducted to validate them.
Our results showed that negative emotions carry significant information about participant’s
situation understanding. However, the semantic and class names used by the FaceReader softwareMultimodal Technologies and Interact. 2018, 2, 11 15 of 18
(i.e., the 7 basics emotions) should be carefully interpreted. This study does not intend to demonstrate
that human engage in problem solving would express always the same basic emotion but would rather
show a variation in facial action unit (AU) activations. Thus, even if the ranking Tables 5 and 6 reveals
that variations in negative emotions are relevant, one should understand that action units’ activation
(involved in these emotions) are varying significantly.
Both feature selections from mRMR and Fisher algorithms give interesting results and improve
data fusion alongside with classification accuracy. By only considering relevant features and removing
redundancy, mRMR feature selection uses its 4 top features to reach 81% of accuracy. Fisher selection
authorizes redundancy if it can increase effectiveness, using 7 features, Fisher selection performs 90%.
Observing these results, one might asks whether selection should be done, based on which criteria.
One should question the importance of redundancy in a multi modal study. Real life recordings
may experiment missing or noisy data on one or several modalities. Having redundancy between
modality may allow the system to still operating even if some modality are facing unreliable data.
Fisher selection shows that redundancy requires more features than non redundancy selection but can
improve efficiently the accuracy. On the other hand, if a light system can not process too many data,
one can chose only relevant and non redundancy features to guarantee maximum accuracy with the
lowest set of features.
The conditions of the chess tasks should also draw attention. In the experimental configuration,
chess players were facing a chess algorithm engine in tasks where they knew the existence of a winning
sequence of moves. Moreover, players are seating (see Figure 1) in front of a touched screen and where
asked to interact with it for playing. Some clues like body agitation or body volume may provide
different information in another experimental environment. Also, participants may not be as engaged
as they would have been in a real chess tournament facing a human opponent using an actual chess
board. In these particular situations, involving stakes for players, the physiological reactions and
emotional expressions are more interesting to observe.
Nevertheless, these experiments reveal that valuable information can be observed from human
attention and emotions to determine understanding, awareness and affective response to chess solving
problems. The feature selection gives good insight on where we should put our attention to grasp the
most relevant information from every modality. Another underlying result is the validation of our
setup in monitoring chess players.
6. Conclusions
This paper presents results from initial experiments with the capture and interpretation
of multimodal signals of 23 chess players engaged in solving 13 challenging chess tasks.
Reliable observations have been made with our experimental equipment composed of a Kinect
capturing body posture, a webcam recording variation of facial action units and an eye-tracker
analyzing gaze trajectories. These records contain relevant information about situation awareness of
human engaged in solving 13 challenging chess tasks. In addition to validating our initial question
that our set up can capture reliable recordings for such study, this equipment is based on off-the-shelf
commercially available components as well as open source programs and thus can be easily replicated.
As well as providing a tool for studies of participants engaged in problem solving, this equipment can
provide a general tool that can be used to study the effectiveness of affective agents in engaging users
and evoking emotions.
Afterward, unimodal and multimodal analysis have been perform on these signals to validate
our second research question. Fixation durations from eye-gaze reveal encoding skills of participant
according to their expertise level. Self-touching and body posture agitation can be interpreted as a stress
reaction when participants are challenged. Finally variation in emotional responses of participants
are correlated with task difficulty. Each of these modality carry enough information to answer our
second research question about detecting when participants are challenged beyond their abilities.
Moreover, Support Vector Machine classifiers trained with 10 cross-fold validation revealed thatMultimodal Technologies and Interact. 2018, 2, 11 16 of 18
combining such modalities could also give good performances: 90% with only 7 features. This would
allow us to build multimodal system that are more reliable and more stable than systems relying on
only one sensor.
These results encourage us to perform further experiments increasing the number of participants,
integrating more modalities and defining new set of reasoning tasks (full game task, facing human
opponent, etc.). First lead to further improve interpretation of human engaged in problem solving is to
embed protocol analysis and self report from participants in our system. This would provide better
situation awareness and semantic annotations for our multimodal signals.
Acknowledgments: This research has been be funded by the French ANR project CEEGE (ANR-15-CE23-0005),
and was made possible by the use of equipment provided by ANR Equipement for Excellence Amiqual4Home
(ANR-11-EQPX-0002). Access to the facility of the MSH-Alpes SCREEN platform for conducting the research is
gratefully acknowledged. We are grateful to all of the volunteers who generously gave their time to participate in
this study and to Lichess webmasters for their help and approval to use their platform for this scientific experience.
We would like to thank Isabelle Billard, current chairman of the chess club of Grenoble “L’Échiquier Grenoblois”
and all members who participated actively in our experiments.
Author Contributions: For this study, James Crowley proposed the experiment and outlined its objectives and
measures. All authors participated in designing the experiment. Thomas Guntz recruited participants and
supervised the execution of the experiments. Thomas Guntz, Dominique Vaufreydaz and Raffaella Balzarini
contributed in analyzing the data. Finally, all authors contributed to writing of the paper.
Conflicts of Interest: The authors declare no conflict of interest.
References
1. El Kaliouby, R.; Robinson, P. Real-time inference of complex mental states from facial expressions and head
gestures. In Real-Time Vision for Human-Computer Interaction; Springer: Berlin, Germany, 2005; pp. 181–200.
2. Baltrušaitis, T.; McDuff, D.; Banda, N.; Mahmoud, M.; El Kaliouby, R.; Robinson, P.; Picard, R. Real-time
inference of mental states from facial expressions and upper body gestures. In Proceedings of the 2011
IEEE International Conference on Automatic Face & Gesture Recognition and Workshops (FG 2011),
Santa Barbara, CA, USA, 21–25 March 2011; IEEE: Piscataway, NJ, USA, 2011; pp. 909–914.
3. Charness, N.; Reingold, E.M.; Pomplun, M.; Stampe, D.M. The perceptual aspect of skilled performance in
chess: Evidence from eye movements. Mem. Cogn. 2001, 29, 1146–1152.
4. Reingold, E.M.; Charness, N. Perception in chess: Evidence from eye movements. In Cognitive Processes in
Eye Guidance; University of Oxford: Oxford, UK, 2005; pp. 325–354.
5. Baltrušaitis, T.; Robinson, P.; Morency, L.P. OpenFace: An open source facial behavior analysis toolkit.
In Proceedings of the 2016 IEEE Winter Conference on Applications of Computer Vision (WACV),
Lake Placid, NY, USA, 7–10 March 2016; pp. 1–10.
6. Cao, Z.; Simon, T.; Wei, S.E.; Sheikh, Y. Realtime Multi-Person 2D Pose Estimation using Part Affinity Fields.
arXiv 2017, arXiv:1611.08050.
7. Simon, T.; Joo, H.; Matthews, I.; Sheikh, Y. Hand Keypoint Detection in Single Images using Multiview
Bootstrapping. arXiv 2017, arXiv:1704.07809.
8. Wei, S.E.; Ramakrishna, V.; Kanade, T.; Sheikh, Y. Convolutional pose machines. arXiv 2016, arXiv:1602.00134.
9. Kahneman, D. Thinking, Fast and Slow; Macmillan Publishers: Basingstoke, UK, 2011.
10. Ekman, P.; Friesen, W.V. Nonverbal leakage and clues to deception. Psychiatry 1969, 32, 88–106.
11. Poh, M.Z.; McDuff, D.J.; Picard, R.W. Advancements in noncontact, multiparameter physiological
measurements using a webcam. IEEE Trans. Biomed. Eng. 2011, 58, 7–11.
12. Shotton, J.; Sharp, T.; Kipman, A.; Fitzgibbon, A.; Finocchio, M.; Blake, A.; Cook, M.; Moore, R. Real-time
human pose recognition in parts from single depth images. Commun. ACM 2013, 56, 116–124.
13. Stiefelhagen, R.; Yang, J.; Waibel, A. A model-based gaze tracking system. Int. J. Artif. Intell.Tools 1997,
6, 193–209.
14. Paletta, L.; Dini, A.; Murko, C.; Yahyanejad, S.; Schwarz, M.; Lodron, G.; Ladstätter, S.; Paar, G.; Velik, R.
Towards Real-time Probabilistic Evaluation of Situation Awareness from Human Gaze in Human-Robot
Interaction. In Proceedings of the Companion of the 2017 ACM/IEEE International Conference on
Human-Robot Interaction, Vienna, Austria, 6–9 March 2017; ACM: New York, NY, USA, 2017; pp. 247–248.Multimodal Technologies and Interact. 2018, 2, 11 17 of 18
15. D’orazio, T.; Leo, M.; Distante, A. Eye detection in face images for a driver vigilance system. In Proceedings
of the 2004 IEEE Intelligent Vehicles Symposium, Parma, Italy, 14–17 June 2004; IEEE: Piscataway, NJ, USA,
2004; pp. 95–98.
16. Giraud, T.; Soury, M.; Hua, J.; Delaborde, A.; Tahon, M.; Jauregui, D.A.G.; Eyharabide, V.; Filaire, E.;
Le Scanff, C.; Devillers, L.; et al. Multimodal Expressions of Stress during a Public Speaking Task:
Collection, Annotation and Global Analyses. In Proceedings of the 2013 Humaine Association Conference
on Affective Computing and Intelligent Interaction (ACII), Geneva, Switzerland, 2–5 September 2013;
IEEE: Piscataway, NJ, USA, 2013; pp. 417–422.
17. Abadi, M.K.; Staiano, J.; Cappelletti, A.; Zancanaro, M.; Sebe, N. Multimodal engagement classification for
affective cinema. In Proceedings of the 2013 Humaine Association Conference on Affective Computing and
Intelligent Interaction (ACII), Geneva, Switzerland, 2–5 September 2013; IEEE: Piscataway, NJ, USA, 2013;
pp. 411–416.
18. Portaz, M.; Garcia, M.; Barbulescu, A.; Begault, A.; Boissieux, L.; Cani, M.P.; Ronfard, R.; Vaufreydaz, D.
Figurines, a multimodal framework for tangible storytelling. In Proceedings of the WOCCI 2017—6th
Workshop on Child Computer Interaction at ICMI 2017—19th ACM International Conference on Multi-modal
Interaction, Glasgow, UK, 13–17 November 2017.
19. Vaufreydaz, D.; Nègre, A. MobileRGBD, An Open Benchmark Corpus for mobile RGB-D Related Algorithms.
In Proceedings of the 13th International Conference on Control, Automation, Robotics and Vision, Singapore,
10–12 December 2014.
20. Holmqvist, K.; Nyström, M.; Andersson, R.; Dewhurst, R.; Jarodzka, H.; Van de Weijer, J. Eye Tracking:
A Comprehensive Guide to Methods and Measures; OUP Oxford: Oxford, UK, 2011.
21. Poole, A.; Ball, L.J. Eye tracking in HCI and usability research. Encycl. Hum. Comput. Interact. 2006,
1, 211–219.
22. Ehmke, C.; Wilson, S. Identifying web usability problems from eye-tracking data. In Proceedings of the
21st British HCI Group Annual Conference on People and Computers: HCI... but Not As We Know It,
University of Lancaster, Lancaster, UK, 3–7 September 2007; Volume 1, pp. 119–128.
23. Den Uyl, M.; Van Kuilenburg, H. The FaceReader: Online facial expression recognition. In Proceedings
of the Measuring Behavior, 2005, Wageningen, The Netherlands, 30 August–2 September 2005, Volume 30,
pp. 589–590.
24. Langner, O.; Dotsch, R.; Bijlstra, G.; Wigboldus, D.H.; Hawk, S.T.; Van Knippenberg, A. Presentation and
validation of the Radboud Faces Database. Cogn. Emot. 2010, 24, 1377–1388.
25. Goeleven, E.; De Raedt, R.; Leyman, L.; Verschuere, B. The Karolinska directed emotional faces: A validation
study. Cogn. Emot. 2008, 22, 1094–1118.
26. Bijlstra, G.; Dotsch, R. FaceReader 4 emotion classification performance on images from the Radboud Faces
Database. 2015. Available online: http://gijsbijlstra.nl/wp-content/uploads/2012/02/TechnicalReport_
FR4_RaFD.pdf (accessed on 2 March 2018)
27. Anzalone, S.M.; Boucenna, S.; Ivaldi, S.; Chetouani, M. Evaluating the engagement with social robots. Int. J.
Soc. Robot. 2015, 7, 465–478.
28. Harrigan, J.A. Self-touching as an indicator of underlying affect and language processes. Soc. Sci. Med. 1985,
20, 1161–1168.
29. Johal, W.; Pellier, D.; Adam, C.; Fiorino, H.; Pesty, S. A cognitive and affective architecture for social
human-robot interaction. In Proceedings of the Tenth Annual ACM/IEEE International Conference on
Human-Robot Interaction Extended Abstracts, Portland, OR, USA, 2–5 March 2015; ACM: New York, NY,
USA, 2015; pp. 71–72.
30. Aigrain, J.; Spodenkiewicz, M.; Dubuisson, S.; Detyniecki, M.; Cohen, D.; Chetouani, M. Multimodal stress
detection from multiple assessments. IEEE Trans. Affect. Comput. 2016, PP, 1.
31. De Groot, A.D. Thought and Choice in Chess; Walter de Gruyter GmbH & Co KG: Berlin, Germany, 1978.
32. Peng, H.; Long, F.; Ding, C. Feature selection based on mutual information criteria of max-dependency,
max-relevance, and min-redundancy. IEEE Trans. Pattern Anal. Mach. Intell. 2005, 27, 1226–1238.
33. Vaufreydaz, D.; Johal, W.; Combe, C. Starting engagement detection towards a companion robot using
multimodal features. arXiv 2015, arXiv:1503.03732.Multimodal Technologies and Interact. 2018, 2, 11 18 of 18
34. Duda, R.O.; Hart, P.E.; Stork, D.G. Pattern Classification; Wiley: New York, NY, USA, 1973; Volume 2.
35. Li, J.; Cheng, K.; Wang, S.; Morstatter, F.; Robert, T.; Tang, J.; Liu, H. Feature Selection: A Data Perspective.
arXiv 2016, arXiv:1601.07996.
c 2018 by the authors. Licensee MDPI, Basel, Switzerland. This article is an open access
article distributed under the terms and conditions of the Creative Commons Attribution
(CC BY) license (http://creativecommons.org/licenses/by/4.0/).You can also read