Multi LC-MS/MS and LC-HRMS Methods for Determination of 24 Mycotoxins including Major Phase I and II Biomarker Metabolites in Biological Matrices ...

Page created by Francisco Mcdaniel
 
CONTINUE READING
Multi LC-MS/MS and LC-HRMS Methods for Determination of 24 Mycotoxins including Major Phase I and II Biomarker Metabolites in Biological Matrices ...
toxins
Article
Multi LC-MS/MS and LC-HRMS Methods
for Determination of 24 Mycotoxins including Major
Phase I and II Biomarker Metabolites in Biological
Matrices from Pigs and Broiler Chickens
Marianne Lauwers 1,2 , Siegrid De Baere 1 , Ben Letor 2 , Michael Rychlik 3 , Siska Croubels 1
and Mathias Devreese 1, *
 1    Department of Pharmacology, Toxicology and Biochemistry, Faculty of Veterinary Medicine,
      Ghent University, 9820 Merelbeke, Belgium; marianne.lauwers@ugent.be (M.L.);
      siegrid.debaere@ugent.be (S.D.B.); siska.croubels@ugent.be (S.C.)
 2    Innovad, Postbaan 69, 2910 Essen, Belgium; b.letor@innovad-global.com
 3    Chair of Analytical Food Chemistry, Technische Universität München, Maximus-von-Imhof-Forum 2,
      85354 Freising, Germany; michael.rychlik@tum.de
 *    Correspondence: mathias.devreese@ugent.be; Tel.: +32-9-264-7527
                                                                                                   
 Received: 15 January 2019; Accepted: 12 March 2019; Published: 19 March 2019                      

 Abstract: A reliable and practical multi-method was developed for the quantification of mycotoxins
 in plasma, urine, and feces of pigs, and plasma and excreta of broiler chickens using liquid
 chromatography–tandem mass spectrometry. The targeted mycotoxins belong to the regulated
 groups, i.e., aflatoxins, ochratoxin A and Fusarium mycotoxins, and to two groups of emerging
 mycotoxins, i.e., Alternaria mycotoxins and enniatins. In addition, the developed method was
 transferred to a LC-high resolution mass spectrometry instrument to qualitatively determine phase I
 and II metabolites, for which analytical standards are not always commercially available. Sample
 preparation of plasma was simple and generic and was accomplished by precipitation of proteins
 alone (pig) or in combination with removal of phospholipids (chicken). A more intensive sample
 clean-up of the other matrices was needed and consisted of a pH-dependent liquid–liquid extraction
 (LLE) using ethyl acetate (pig urine), methanol/ethyl acetate/formic acid (75/24/1, v/v/v) (pig feces)
 or acetonitrile (chicken excreta). For the extraction of pig feces, additionally a combination of LLE
 using acetone and filtration of the supernatant on a HybridSPE-phospholipid cartridge was applied.
 The LC-MS/MS method was in-house validated according to guidelines defined by the European
 and international community. Finally, the multi-methods were successfully applied in a specific
 toxicokinetic study and a screening study to monitor the exposure of individual animals.

 Keywords: Biomarkers; exposure; LC-MS/MS; LC-HRMS; pig; broiler chicken; multi-mycotoxin

 Key Contribution: An LC-MS/MS multi-method was developed, validated and transferred to the
 LC-HRMS to determine mycotoxins and their metabolites in plasma, urine and feces of pigs and
 plasma and urine of broiler chickens. This method enables the determination of biomarkers for
 exposure to mycotoxins in biological samples.

1. Introduction
     The worldwide contamination of feed with mycotoxins is of major agro-economic importance.
In addition to crop and feed loss and damage, these mycotoxins can have a large impact on animal
health. Surveys show that mycotoxins occur in more than 70% of the tested feed samples and 38% of

Toxins 2019, 11, 171; doi:10.3390/toxins11030171                                www.mdpi.com/journal/toxins
Multi LC-MS/MS and LC-HRMS Methods for Determination of 24 Mycotoxins including Major Phase I and II Biomarker Metabolites in Biological Matrices ...
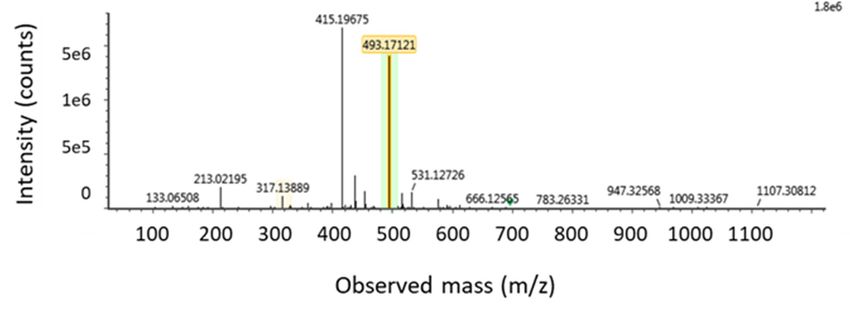
Toxins 2019, 11, 171                                                                                2 of 30

these samples contain multiple mycotoxins. Co-contamination of several mycotoxins can result in
additive or synergistic effects. Consequently, multi-methods are an asset in mycotoxin analysis [1].
      This study focused on the mycotoxins regulated by the European Union [2,3], as well as the
mycotoxins for which legislation is currently lacking but which reveal evident toxicity and high
prevalence in feed [4]. More specifically, aflatoxin B1 (AFB1), ochratoxin A (OTA), fumonisin B1 (FB1),
T2-toxin (T2), zearalenone (ZEN) and deoxynivalenol (DON), as well as enniatins (ENN), beauvericin
(BEA), alternariol (AOH) and tenuazonic acid (TeA) were included.
      Traditionally, mycotoxins are determined and regulated at the level of the feed. However, feed
analysis has some major disadvantages. First, the possible presence of mycotoxin hotspots, i.e., local
areas in the feed with a higher concentration, can cause an unequal distribution of mycotoxins
in the feed and make it difficult to obtain a representative sample [5]. Second, analyzing feed
gives no information about the individual exposure. Fluctuations can arise from differences in
food consumption or in absorption, distribution, biotransformation and excretion (ADME) processes
between the animals. Third, the risk associated with exposure can be underestimated because feed
analysis does not include alternative routes of exposure such as dermal and respiratory exposure [6,7].
Fourth, modified or conjugated forms, previously called masked mycotoxins, can convert back to
their free forms and hence contribute to the adverse effects related to mycotoxin exposure. This has
been demonstrated for 3- and 15-acetyldeoxynivalenol (3ADON and 15ADON, respectively) and
DON-3-glucoside (DON3G) in pigs and broiler chickens [8,9]. Therefore, both ADONs and DON3G
can be considered as toxic as DON itself. Detection of these modified forms in feed can be difficult and
is not always possible with conventional methods where the non-modified mycotoxin is determined.
This creates a possible mismatch between the feed contamination level and the exposure of the
animals [10]. Finally, clinical signs of mycotoxin exposure can appear when the contaminated feed
has already been consumed, thus complicating or preventing diagnosis of herd problems associated
with mycotoxins [11].
      These issues can be resolved by biomonitoring of the animals and determining the exposure to
mycotoxins in biological matrices with the use of so-called biomarkers of exposure. Biomarkers are
molecules related to the exposure and are often the mycotoxin itself, the in vivo formed metabolites or
interaction products with macromolecules such as nucleic acids or proteins [12,13].
      The selected mycotoxins and their phase I and II metabolites or interaction products
(e.g., aflatoxin-guanine) can be measured in several biological matrices. In this study, plasma, urine
and feces of pigs and plasma and excreta of broiler chickens were chosen as biological matrix since
combining these enables studying all the in vivo toxicokinetic parameters and the complete metabolic
profile. Moreover, these matrices can be used to determine the efficacy of mycotoxin detoxifiers
according to the guidelines of the European Food Safety Authority (EFSA) [14]. In addition, they can
be easily applied for the detection of mycotoxins in these animals under field conditions. Especially,
the non-invasive character of urine and feces collection can be of added value when sampling on farm.
      Nowadays, state-of-the-art equipment such as liquid chromatography (LC) coupled to a tandem
mass spectrometer (MS/MS) or a high-resolution mass spectrometer (HRMS) have become the
standard in determining mycotoxins in biological matrices. Indeed, several LC-MS/MS multi-methods
(≥2 mycotoxins) have already been developed for the determination of mycotoxins in biological
matrices of pigs and broiler chickens. However, most of these multi-methods are limited to one
group of mycotoxins. Such methods are available for (the metabolites of) DON [9,15–18], ZEN [19,20],
ENNs [21,22], T2 [23–25], AFB1 [26] and TeA [27]. Only few multi-methods combine mycotoxins from
different families. To the best of our knowledge, this is the case for urine [28–33] and plasma [33–35] of
pigs, and plasma [35] of broiler chickens. These multiclass methods are also available for other animal
species such as for fish plasma [36], human plasma and urine [5,37–40], and rat plasma and urine [39].
The methods for urine clean-up often apply immunoaffinity columns or solid phase columns [30–33].
This approach increases the sensitivity but also the cost of analyzing a large number of samples and it
limits the number of analytes that can be detected. To avoid these limitations, the dilute and shoot
Multi LC-MS/MS and LC-HRMS Methods for Determination of 24 Mycotoxins including Major Phase I and II Biomarker Metabolites in Biological Matrices ...
Toxins 2019, 11, 171                                                                               3 of 30

approach without further pre-treatment is frequently used [5,37,39,40]. However, this method demands
careful optimization of the dilution factor, and often matrix effects and interfering matrix peaks are
observed, which might decrease the sensitivity. Therefore, liquid–liquid extractions (LLE) are preferred
as urine sample preparation because they are easy to perform in large quantity and enough sensitivity
can be obtained. The developed plasma methods by Brezina et al. [41] and De Baere et al. [35] use
OASIS HLB columns that require conditioning before use, limiting the number of samples that can be
processed in a period of time. To increase the possible number of samples processed, LLE and protein
precipitation are preferred. This study therefore aimed to develop a practical, fast and cost-efficient
multi-method for analysis of plasma and urine of pigs and plasma of chickens, using LLE and protein
precipitation, avoiding the use of affinity/solid phase columns.
     Multi-methods are to the best of our knowledge currently not available for pig feces and excreta of
broiler chickens. This might be due to high matrix complexity and the diversity of the physicochemical
characteristics of the mycotoxins. Hence, the aim of this study was also to address these difficulties
and to develop a multi-method in these highly complex matrices.
     LC-HRMS is especially interesting to elucidate and determine phase I and II metabolites and
interaction products for which analytical standards are not easily available. Especially, since phase
II metabolites might be the most appropriate biomarkers for some mycotoxins due to the extensive
biotransformation by these pathways. The glucuronidated and sulfated metabolites of DON and ZEN,
as well as the metabolites formed after hepatic biotransformation of ENNB and B1 have already been
determined using LC-HRMS [9,20,22,42]. However, to our knowledge, these metabolites of several
toxins belonging to multiple classes have never been determined in a single chromatographic run
using LC-HRMS.
     Thus, the combination of LC-MS/MS and LC-HRMS enables not only determining mycotoxins
with an appropriate sensitivity in the lower ng/mL or ng/g range but also detecting a broad range of
mycotoxins, i.e., the mycotoxins and metabolites for which standards are readily available as well as
other phase I and II metabolites and interaction products. This is especially interesting when assessing
the most appropriate biomarker for exposure.
     Therefore, the aim of this study was to develop and validate multi-methods using LC-MS/MS
to determine relevant mycotoxins in biological matrices of pigs and broiler chickens. In addition,
the LC-MS/MS method was transferred to LC-HRMS to determine mycotoxins for which analytical
standards are not always commercially available. It is important to consider the main challenges
including the high complexity of the matrix, the large range of different physicochemical characteristics
of the mycotoxins and the need for a method with an appropriate sensitivity (in the lower ng/mL or
ng/g range), so that they can be used not only for specific toxicokinetic studies but also for screening
studies to monitor the exposure of individual animals.

2. Results and Discussion

2.1. Method Development

2.1.1. Sample Preparation and Extraction
     Three requirements were prioritized in the development of adequate sample pre-treatments for
the different matrices. First, the sample preparation should be simple and practical, thereby enabling
analysis of a large quantity of samples in a time and cost efficient way. Second, the sample preparation
should be as generic as possible, to allow the extraction of the 24 mycotoxins including some relevant
metabolites, which was a real challenge taking into account the various physicochemical properties of
the different classes of mycotoxins. Third, the method should be sensitive and, therefore, an LOQ of
1 ng/mL of ng/g was aimed for all analytes in all matrices.
     Initially, all methods started from the most generic and simple sample preparation:
deproteinization with an organic solvent. However, due to high matrix complexity and the large
variety in physicochemical characteristics of the different mycotoxins more complex methods were
Multi LC-MS/MS and LC-HRMS Methods for Determination of 24 Mycotoxins including Major Phase I and II Biomarker Metabolites in Biological Matrices ...
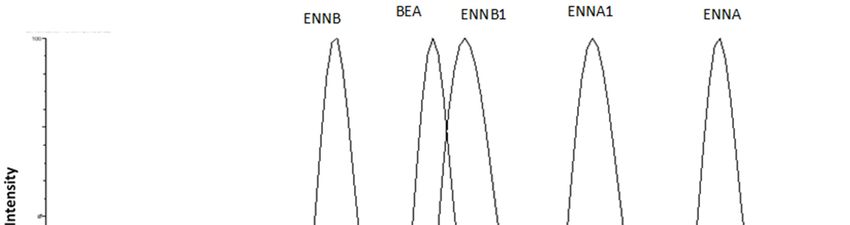
Toxins 2019, 11, 171                                                                              4 of 30

needed for urine, feces and excreta. A summary of the final protocols can be found in the flowchart
below (Figure 1).

Pig and Chicken Plasma
     Method development was started with the optimization of the extraction of the analytes
of interest from pig and chicken plasma. Proteins and phospholipids are often removed from
plasma samples before analysis on LC-MS/MS equipment to prevent clotting and contamination
of the equipment. Deproteinization can be accomplished using organic solvents, such as MeOH
and ACN. The elimination of phospholipids could be obtained using an Oasis Ostro® -plate or
HybridSPE® -phospholipid 30 mg/1 mL solid-phase extraction (SPE) tubes. The use of the Ostro® -plate
required the addition of 0.1% formic acid. Therefore, 0.1% formic acid was added to ACN and MeOH.
     For pig plasma, deproteinization with 0.1% formic acid in MeOH and 0.1% formic acid in ACN
were tested in triplicate on spiked pig plasma samples (analyte concentration: 10 ng/mL). In this
study, ACN was preferred as deproteinization solvent for pig plasma, compared to MeOH, since it
gave a clearer supernatant after centrifugation. This is in accordance with previous studies where
deproteinization with ACN was successfully applied to detect mycotoxins in pig plasma [20,34].
     Plasma of broiler chickens contains more phospholipids compared to pigs [43]. Therefore,
an additional removal of the phospholipids was necessary to obtain clear samples and to prevent
clogging of tubings of the LC-MS/MS and LC-HRMS instruments during routine sample analysis.
Spiked broiler chicken plasma samples (analyte concentration: 10 ng/mL) were extracted using the
Oasis Ostro® -plate or the hybrideSPE® phospholipid SPE tubes (n = 3 per protocol). As can be seen in
Figure 2, the use of SPE tubes resulted in a lower peak area, especially for ENNs, BEA, TEA, AME
and AOH. Consequently, for broiler chicken plasma, deproteinization with ACN and 0.1% formic acid
was combined with the Oasis Ostro® -plate to obtain the best results. This combination was already
successfully applied to detect mycotoxins in chicken plasma by our group [44].

Pig Urine
     Since methanol and ACN are mixable with urine, it was not possible to use the same method
for urine as for plasma. The use of immunoaffinity columns is avoided due to the high cost. Dilute
and shoot methods were eliminated to avoid matrix effects. Therefore, LLE was used to extract the
mycotoxins from urine. The main parameters affecting the extraction of all components were optimized:
type of extraction solvent, pH, solvent volume and extraction time. During initial experiments, ethyl
acetate was evaluated as extraction solvent at neutral pH as in literature extraction of mycotoxins from
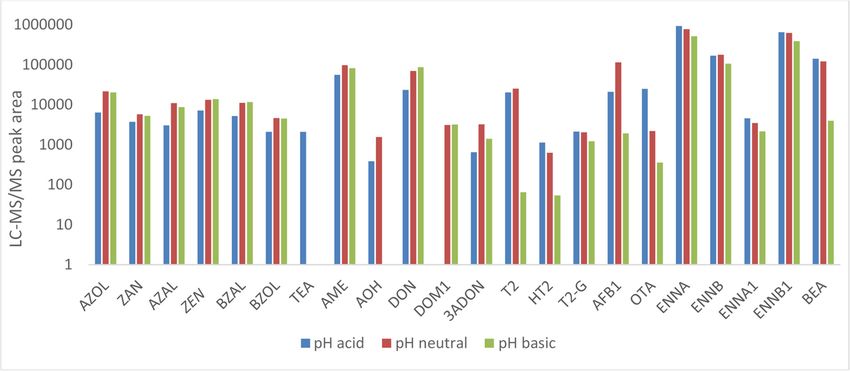
human urine with this solvent can be found [5,28]. Next, the pH of extraction was optimized using
urine spiked at analyte concentrations of 10 ng/mL (n = 2 per protocol): acidic (pH 2), neutral (pH 8)
and basic (pH 10) extraction conditions were evaluated. Most components showed good extraction at
neutral pH (see Figure 3); only for TeA, HT2 and OTA neutral pH showed insufficient results. For these
components, significantly higher peak areas were observed at pH 2. This can be explained by the
pKa-values of these components. The pKa of TeA (4.5 ± 1) and OTA (3.2 ± 0.1) [45,46] indicate that
these components are weak acids and at pH 2 all these components will be neutral and can thus easily
be extracted. The pKa values and chemical formulas of the other toxins can be found in Supplementary
Table S12. As a result, it was decided to perform two extraction protocols for pig urine, i.e., one in
acidic medium (pH 2, tube 1) and another in neutral medium (pH 7, tube 2). Since the same internal
standard was used for TeA as for AME and AOH and these components were also detected in acidic
medium, they were also added to the acidic protocol. Finally, the volume of ethyl acetate and the
extraction time were also optimized. Different volumes (1.5, 3, 5, and 7.5 mL) and different extraction
times (15, 30, 45, and 60 min) were tested. It was found that extraction was optimal using a solvent
volume of 3 mL and an extraction time of 15 min (results not shown). The combination of both extracts
into one vial was not possible since DOM1 and ADON were no longer recovered.
Toxins 2019, 11,
Toxins 2019, 11, 171
                 x FOR PEER REVIEW                                                                                                                                      5 5of
                                                                                                                                                                            of 31
                                                                                                                                                                               30

                      Flowchartof
           Figure1.1.Flowchart
          Figure                ofthe
                                   thefinal
                                       finalmethods
                                            methodsto
                                                    todetermine
                                                      determinedifferent
                                                                different mycotoxins
                                                                          mycotoxins in
                                                                                      in plasma,
                                                                                         plasma, urine
                                                                                                 urine and
                                                                                                       and feces
                                                                                                           feces of
                                                                                                                 of pigs,
                                                                                                                    pigs, and
                                                                                                                          and plasma
                                                                                                                              plasma and
                                                                                                                                     and excreta
                                                                                                                                         excreta of
                                                                                                                                                 of broiler
                                                                                                                                                    broiler chickens.
                                                                                                                                                            chickens.
Toxins 2019,11,
Toxins2019,  11,171
                 x FOR PEER REVIEW                                                                                              66 of
                                                                                                                                   of 30
                                                                                                                                      31

   10000000

          1000000
   LC-MS/MS peak area

                  100000

                        10000

                        1000

                         100

                          10

                           1

                                                                          SPE        OSTRO

                 Figure 2.
                         2. Comparison
                            Comparisonofofthethechromatographic
                                                  chromatographic    peak
                                                                  peak     areas
                                                                        areas     of the
                                                                              of the     different
                                                                                     different     mycotoxins
                                                                                               mycotoxins (mean(mean
                                                                                                                 + SD)+after
                                                                                                                         SD)
                 after extraction
                 extraction        from chicken
                             from broiler broiler chicken   plasmaat(spiked
                                                   plasma (spiked             at 10
                                                                      10 ng/mL)       ng/mL)
                                                                                   using Oasisusing ®
                                                                                               Ostro Oasis
                                                                                                      plate Ostro ®        ®
                                                                                                                    plate or
                                                                                                            or hybrideSPE
                 hybrideSPE phospholipid
                 phospholipid  ®
                                 SPE tubes (n =SPE  tubes
                                                 3 per    (n = 3 per protocol).
                                                       protocol).

                 Figure 3.
                 Figure   3. Comparison
                             Comparison of  of the
                                               the chromatographic
                                                   chromatographic peak
                                                                      peak areas
                                                                            areas of
                                                                                   of the
                                                                                      the different
                                                                                          different mycotoxins
                                                                                                    mycotoxins after
                                                                                                                 after extraction
                                                                                                                       extraction
                 with ethyl   acetate  (spiked  at 10 ng/mL)  from  pig urine at three  different pH levels: acid (pH  2),
                 with ethyl acetate (spiked at 10 ng/mL) from pig urine at three different pH levels: acid (pH 2), neutral neutral
                 (pH  8), and  basic  (pH  10)
                 (pH 8), and basic (pH 10) (n = (n = 2 per protocol).
                                                           protocol).

Chicken
Chicken Excreta
        Excreta
      For
      For the
            the excreta
                 excreta ofof broiler
                               broiler chickens,
                                         chickens, the
                                                    the same
                                                         same solvents
                                                                 solvents as  as used
                                                                                  used forfor extraction
                                                                                               extraction of of urine
                                                                                                                 urine and
                                                                                                                         and
deproteinization      of  plasma   were   evaluated:   ACN,     MeOH      and   ethyl   acetate.
deproteinization of plasma were evaluated: ACN, MeOH and ethyl acetate. The excreta samples         The   excreta  samples
                                                                                                                        were
were
spiked spiked   at an analyte
         at an analyte           concentration
                          concentration          of 10(nng/g
                                           of 10 ng/g          (n =protocol).
                                                          = 3 per    3 per protocol).      MeOH extraction
                                                                                 MeOH extraction        of broilerofchicken
                                                                                                                     broiler
chicken
excreta excreta
          did notdid    not contain
                     contain   all theallmetabolites
                                          the metabolites   of ZEN.
                                                       of ZEN.         In addition,
                                                                  In addition,      thethe  peakareas
                                                                                         peak      areasofofthe
                                                                                                             the measured
                                                                                                                 measured
metabolites
metabolites of ZEN and DON and AOH/AME were much lower. Next, the chromatograms after
               of  ZEN    and  DON     and  AOH/AME        were    much     lower.    Next,   the  chromatograms        after
extraction
extraction with
              with ethyl
                   ethyl acetate
                           acetate and
                                    and ACN
                                         ACN were
                                               werecompared.
                                                      compared.The  Theethyl
                                                                          ethylacetate
                                                                                 acetateextract
                                                                                           extractshowed
                                                                                                     showedaalower
                                                                                                                 lowerS/NS/N
ratio for ZEN    and  its metabolites.    Moreover,  the peak   areas   for  the ENNs,     AFB1
ratio for ZEN and its metabolites. Moreover, the peak areas for the ENNs, AFB1 and DON family     and   DON    family  were
much    higherhigher
were much        after extraction     with ACN
                        after extraction          compared
                                            with ACN           to ethyl
                                                        compared          acetate
                                                                      to ethyl       (Figure
                                                                                 acetate       4). Therefore,
                                                                                           (Figure               ACNACN
                                                                                                      4). Therefore,     was
chosen   as optimal
was chosen             extraction
                as optimal          solvent.
                              extraction      However,
                                           solvent.      to improve
                                                     However,            the recovery,
                                                                  to improve              the influence
                                                                                   the recovery,           of the addition
                                                                                                     the influence    of the
of salts (MgSO
addition of salts   and   Na  SO
                  4 (MgSO24 and    ), acid (HCl), base  (NaOH)     and   water   on   the extraction    recovery
                                  4 Na2SO4), acid (HCl), base (NaOH) and water on the extraction recovery          was also
evaluated.    The extraction
was also evaluated.             recovery ofrecovery
                          The extraction      TeA and ofOTATeAincreased
                                                                 and OTA    byincreased
                                                                                a factor 100bybya adding
                                                                                                   factor 100HCl,bywhereas
                                                                                                                    adding
for all the  other components      extraction  with ACN    alone   showed     the  highest   recovery.
HCl, whereas for all the other components extraction with ACN alone showed the highest recovery.          Therefore,  it was
Therefore, it was decided to perform the extraction of chicken excreta twice: with and without HCl
Toxins 2019, 11, 171                                                                                                                     7 of 30
Toxins 2019, 11, x FOR PEER REVIEW                                                                                                      7 of 31

decided
(only fortoTeA
            perform   the extraction
                and OTA).            of protocol
                             The final  chicken excreta twice:
                                                 for broiler     with and
                                                             chicken      without
                                                                      excreta  usedHCl   (only
                                                                                     1.5 mL  offor
                                                                                                ACNTeAasand
                                                                                                         an
OTA). The   final protocol
extraction solvent.        for broiler chicken excreta used  1.5 mL  of ACN   as an extraction solvent.

                        1000000

                        100000
  LC-MS/MS peak areas

                         10000

                           1000

                            100

                             10

                               1

                                               Ethylacetate    ACN     MeOH

                        Figure 4.
                        Figure   4. Comparison
                                    Comparisonofofthe
                                                    thechromatographic
                                                        chromatographic    peak
                                                                         peak    areas
                                                                              areas     of the
                                                                                    of the      different
                                                                                            different     mycotoxins
                                                                                                      mycotoxins   after after extraction
                                                                                                                         extraction from
                        from broiler
                        broiler chickenchicken  excreta at
                                        excreta (spiked  (spiked at with
                                                           10 ng/g) 10 ng/g)
                                                                         ethylwith ethyl
                                                                              acetate,     acetate, and
                                                                                       acetonitrile  acetonitrile
                                                                                                         methanol and
                                                                                                                    (n =methanol   (n = 3
                                                                                                                          3 per protocol).
                        per protocol).
Pig Feces
Pig Feces
     The extraction of mycotoxins from pig feces was initially evaluated using the same solvents as
for theTheoptimization
             extraction of of mycotoxins
                              chicken excreta:
                                             fromMeOH,       ACN,
                                                     pig feces  wasand     ethylevaluated
                                                                      initially   acetate. However,
                                                                                              using thethese
                                                                                                          samesolvents
                                                                                                                 solventsdid as
not   give  satisfactory    results in recovery     and  the   extracts  were    not sufficiently
 for the optimization of chicken excreta: MeOH, ACN, and ethyl acetate. However, these solvents didclean  to  inject into  the
instrument.     Therefore,
 not give satisfactory         otherin
                            results  extraction
                                       recoverysolvents
                                                    and the (acetone,     diethyl
                                                               extracts were     notether)   were also
                                                                                      sufficiently      evaluated,
                                                                                                    clean             but the
                                                                                                           to inject into  the
recovery     of the  mycotoxins      was  still insufficient.    This  could    be explained    by  the
 instrument. Therefore, other extraction solvents (acetone, diethyl ether) were also evaluated, but the complexity     of  the
matrix.
 recoveryThis    challenge
             of the           was solved
                     mycotoxins             by insufficient.
                                     was still   testing different
                                                                 Thiscombination        of solvents
                                                                       could be explained            andcomplexity
                                                                                                by the    the combination
                                                                                                                       of the
of   the different
 matrix.             solvents
           This challenge        with
                               was     SPE by
                                    solved    columns.      This led combination
                                                  testing different    to a double of   extraction
                                                                                           solvents procedure.      The first
                                                                                                     and the combination
extraction    was a solvents
 of the different     liquid extraction
                                  with SPE  using    MeOH/ethyl
                                               columns.     This ledacetate/formic         acid (75/24/1;
                                                                        to a double extraction               v/v) toThe
                                                                                                      procedure.      extract
                                                                                                                          first
OTA,    TeA, was
 extraction    AMEa and
                      liquidAOH.   The second
                               extraction  usingprotocol
                                                    MeOH/ethylto extract  the other mycotoxins
                                                                    acetate/formic     acid (75/24/1;was  a to
                                                                                                       v/v) combination
                                                                                                               extract OTA, of
aTeA,
   liquid
        AMEextraction
                and AOH. withThe
                               acetone
                                   secondandprotocol
                                              a solid phase     extraction
                                                         to extract          withmycotoxins
                                                                      the other     a HybridSPE-phospholipid
                                                                                                  was a combination  column.
                                                                                                                          of a
All   extraction
 liquid  extractionprocedures    were and
                       with acetone     tested   in triplicate
                                             a solid            at analytewith
                                                       phase extraction      concentrations     of 10 ng/g.
                                                                                   a HybridSPE-phospholipid          column.
       Both fecesprocedures
 All extraction     and excretawereextraction
                                         tested required     theat
                                                  in triplicate   use  of a filtration
                                                                    analyte              step using
                                                                              concentrations         the
                                                                                                 of 10   Millex® -LG filter
                                                                                                       ng/g.
unit (0.2
       Bothµm)    to and
              feces  obtain   samples
                           excreta      that were
                                    extraction        sufficiently
                                                  required          clean
                                                              the use  of atofiltration
                                                                               inject onstep
                                                                                           the using
                                                                                               equipment.
                                                                                                      the Millex®-LG filter
       For  all matrices,    the  dried  extract    was  reconstituted     in  250  µL
 unit (0.2 µm) to obtain samples that were sufficiently clean to inject on the equipment.(or 150  µL  for chicken plasma)
of MeOH/water
       For all matrices,(85/15;   v/v). extract
                             the dried   The combination        of water
                                                   was reconstituted     in and   MeOH
                                                                             250 µL         wasµL
                                                                                       (or 150   crucial  to redissolve
                                                                                                   for chicken    plasma)all of
mycotoxins      with   their  various  physicochemical        characteristics.
 MeOH/water (85/15; v/v). The combination of water and MeOH was crucial to redissolve all
mycotoxins with their various physicochemical characteristics.
2.1.2. Optimization of LC-MS/MS and HRMS Parameters
2.1.2.Four
       Optimization   of LC-MS/MS
           different reversed         and HRMS
                               phase columns       Parameters
                                               (Hypersil   Gold 50 mm × 2.1 mm, dp: 1.9, Thermo Scientific,
Breda,  The Netherlands;   Zorbax   Eclipse  C18 50
      Four different reversed phase columns (Hypersilmm   ×  2.1 Gold
                                                                 mm, dp:50 1.8,
                                                                             mmAgilent,   Sint-Katelijne-Waver,
                                                                                   × 2.1 mm,    dp: 1.9, Thermo
Belgium;  Acquity   BEH-C18    50 mm  ×  2.1 mm,  dp:  1.7, Waters,  Milford,
Scientific, Breda, The Netherlands; Zorbax Eclipse C18 50 mm × 2.1 mm, dp: 1.8,MA,   USA;  and   Acquity  HSS-T3
                                                                                                    Agilent, Sint-
100 mm    ×  2.1 mm,   dp:  1.8,  Waters, Milford,  MA,    USA)   were   tested   to achieve
Katelijne-Waver, Belgium; Acquity BEH-C18 50 mm × 2.1 mm, dp: 1.7, Waters, Milford, MA, USA;   chromatographic
separation
and Acquity of HSS-T3
                the selected
                        100 mmmycotoxins.
                                  × 2.1 mm,Thedp:best
                                                  1.8, separation    of all components
                                                       Waters, Milford,     MA, USA) were wastested
                                                                                                obtained   on the
                                                                                                       to achieve
HSS-T3   column. separation of the selected mycotoxins. The best separation of all components was
chromatographic
obtained multi-methods
      The                   were developed with two subsequent analytical runs, i.e., ESI+ and ESI−
           on the HSS-T3 column.
modeTherespectively. This was
           multi-methods were   necessary to bewith
                                   developed    able to
                                                     two detect all the mycotoxins
                                                            subsequent    analytical with
                                                                                       runs,sufficient
                                                                                             i.e., ESI+sensitivity
                                                                                                        and ESI−
without  increasing theThis
mode respectively.       run time. Therefore, the
                             was necessary         mobile
                                               to be   ablephases   for each
                                                             to detect        ionization
                                                                          all the         mode were
                                                                                    mycotoxins    with optimized
                                                                                                        sufficient
sensitivity without increasing the run time. Therefore, the mobile phases for each ionization mode
were optimized separately. In the literature, the most common mobile phases for mycotoxin detection
Toxins 2019, 11, 171                                                                                                     8 of 30
Toxins 2019, 11, x FOR PEER REVIEW                                                                                      8 of 31

separately.
consist      In theand
         of water     literature,
                          an organicthe most
                                         solventcommon
                                                   (such asmobile
                                                              ACNphases
                                                                      or MeOH).for mycotoxin      detection
                                                                                     These solvents           consist
                                                                                                         are often     of water
                                                                                                                     combined
and  an  organic   solvent   (such   as ACN     or MeOH).     These    solvents   are  often
with mobile phase modifiers such as volatile acids (formic acid and acetic acid) and ammonium combined     with  mobile   phase
modifiers
formate   orsuch   as volatile
             ammonium             acids[34,35].
                              acetate    (formicDifferent
                                                   acid and combinations
                                                               acetic acid) and   of ammonium
                                                                                     these solvents  formate   or ammonium
                                                                                                         and modifiers    were
acetate [34,35].
evaluated          Different
            to identify    the combinations       of thesefor
                                optimal combination          solvents    and modifiers
                                                                each ionization       mode. were evaluated to identify the
optimal   combination
     In ESI−   mode, ZEN,  for each
                                AZEL,  ionization
                                          BZEL, AZAL,mode.BZAL, ZAN, TeA, AOH and AME were determined.
      In ESI
Baseline     − mode,among
          separation      ZEN, AZEL,       BZEL, and
                                   ZAN, AZEL,       AZAL,BZEL BZAL,
                                                                 as wellZAN,    TeA, AOH
                                                                           as between     AZAL andandAME   were
                                                                                                         BZAL   wasdetermined.
                                                                                                                      achieved
Baseline  separation     among     ZAN,    AZEL,    and  BZEL     as well   as between
using water (MP A) and ACN (MP B) as mobile phases [20]. The use of mobile phase with a pHAZAL      and  BZAL    was  achieved
                                                                                                                          close
using
to     water
   neutral    (MP
            led      A) and
                 to an         ACN (MP
                         impaired     peakB)    as mobile
                                             shape          phases
                                                      for TeA    [47].[20].
                                                                        TheThepeakuse  of mobile
                                                                                     shape          phase with
                                                                                              was optimal    when a pH  close1%
                                                                                                                      using    to
neutral
acetic   led Therefore,
       acid. to an impaired       peak shape
                            1% acetic    acid infor  TeA and
                                                   water   [47].1%Theacetic
                                                                        peakacid
                                                                               shape
                                                                                   in was
                                                                                       ACNoptimal      when using
                                                                                               were chosen            1%mobile
                                                                                                               as final   acetic
acid. Therefore,
phases,   since this1% acetic    acid in water
                         combination       gave and     1% aceticresults
                                                   satisfactory      acid in for
                                                                               ACNallwere    chosenFigure
                                                                                        analytes.     as final 5a
                                                                                                               mobile
                                                                                                                    showsphases,
                                                                                                                             the
since this combination
chromatographic              gave satisfactory
                       separation                   results forinallESI−
                                      of the mycotoxins               analytes.
                                                                            modeFigure
                                                                                    with 5a theshows    the chromatographic
                                                                                                 optimized     parameters as
             of the mycotoxins in ESI− mode with the optimized parameters as described here.
separationhere.
described
      DON,    DOM-1, 3-ADON,
     DON, DOM-1,          3-ADON, 15-ADON,
                                        15-ADON, T2,   T2, HT2,
                                                            HT2, T2G,
                                                                    T2G, OTA,
                                                                            OTA, AFB1,
                                                                                   AFB1, AFM1,
                                                                                             AFM1, FB1,
                                                                                                      FB1, ENNA,
                                                                                                            ENNA, ENNA1,
                                                                                                                       ENNA1,
ENNB, ENNB1
ENNB,     ENNB1 and   and BEABEAwere weredetermined
                                             determinedininESI+   ESI+mode.
                                                                          mode.      Taking
                                                                                Taking     intointo    account
                                                                                                  account         all analytes,
                                                                                                            all analytes,   the
the combination       of water    (MP    A)  and   MeOH     (MP    B)  was   most    suitable
combination of water (MP A) and MeOH (MP B) was most suitable [34]. These mobile phases were    [34].  These   mobile    phases
were further
further         optimized
         optimized              using ammonium
                       using ammonium          formate formate
                                                          and formic and    formic
                                                                         acid         acid tothe
                                                                               to evaluate      evaluate
                                                                                                   formationtheofformation
                                                                                                                   ammonium   of
ammonium                                   +
adducts   (M +adducts
                  [NH4+]).(M    + [NH
                              These       4 ]). These
                                       adducts           adducts easier
                                                  are generally      are generally      easierthan
                                                                              to fragment        to fragment     than sodium
                                                                                                      sodium adducts,      thus
adducts, thus
enhancing    theenhancing
                    sensitivitythe of sensitivity
                                       the method.  of the
                                                         Themethod.      The final combination
                                                               final combination         of mobile of     mobilewas
                                                                                                        phases     phases
                                                                                                                       10 mMwas
10 mM ammonium
ammonium      formateformate
                          and 0.3% and   0.3% acid
                                      formic    formic   acid in(MP
                                                     in water     waterA) (MP
                                                                           and A)    and in methanol
                                                                                 in methanol     (MP B).(MP     B). 5b,c
                                                                                                           Figure   Figure  5b,c
                                                                                                                         shows
shows
the     the chromatographic
    chromatographic                 separation
                           separation      of theofmycotoxins
                                                     the mycotoxinsin ESI+in ESI+
                                                                             mode  mode
                                                                                      withwith    the optimized
                                                                                             the optimized          parameters
                                                                                                               parameters     as
as described
described      here.
            here.

                                                              (a)
                                                       Figure 5. Cont.
Toxins 2019, 11, 171                                                                                                         9 of 30
Toxins 2019, 11, x FOR PEER REVIEW                                                                                         9 of 31

                                                               (b)

                                                               (c)
     Figure
     Figure 5.5.(a) LC-MS/MS
                    (a) LC-MS/MS    chromatogram
                                           chromatogramshowing    the separation
                                                               showing              of tenuazonic
                                                                           the separation             acid (TeA, acid
                                                                                                of tenuazonic      6.16 min),
                                                                                                                         (TeA,
     alternariol
     6.16 min), alternariol (AOH, 6.45 min), α-zearalanol (AZAL, 7.34 min), α-zearalenolmin),
                  (AOH,     6.45   min),   α-zearalanol     (AZAL,    7.34   min),  α-zearalenol     (AZEL,    7.47   (AZEL,β-
     zearalanol
     7.47 min), (BZAL,        6.73 min),
                   β-zearalanol       (BZAL,β-zearalenol       (BZEL, 6.84 (BZEL,
                                                 6.73 min), β-zearalenol        min), zearalanone        (ZAN, 8.38 (ZAN,
                                                                                         6.84 min), zearalanone         min),
     zearalenone   (ZEN, 8.47 min)
     8.38 min), zearalenone         (ZEN,and8.47
                                              alternariol-monomethyl       ether (AME, 8.52
                                                   min) and alternariol-monomethyl               min)(AME,
                                                                                              ether    at a concentration
                                                                                                              8.52 min) atofa
     10  ng/mL in broiler
     concentration              chickenin plasma;
                      of 10 ng/mL                      (b) LC-MS/MS
                                            broiler chicken               chromatogram
                                                                plasma; (b)                   showing the separation
                                                                               LC-MS/MS chromatogram             showing theof
     deoxynivalenol      (DON,       4.37   min),   de-epoxy-deoxynivalenol         (DOM1,       4.71
     separation of deoxynivalenol (DON, 4.37 min), de-epoxy-deoxynivalenol (DOM1, 4.71 min), 3/15-     min),    3/15- acetyl-
     deoxynivalenol    (3/15-ADON,
     acetyl-deoxynivalenol                 5.02 min),
                                  (3/15-ADON,        5.02aflatoxin  M1 (AFM1,
                                                           min), aflatoxin        5.20 min),
                                                                             M1 (AFM1,     5.20aflatoxin    B1 (AFB1,
                                                                                                  min), aflatoxin       5.73),
                                                                                                                    B1 (AFB1,
     HT2-toxin   (HT2, 7.01
     5.73), HT2-toxin     (HT2,min),
                                   7.01T2-glucoside     (T2G, 7.08
                                        min), T2-glucoside          min),
                                                                 (T2G,     T2min),
                                                                        7.08   toxin T2
                                                                                     (T2,toxin
                                                                                           8.27 (T2,
                                                                                                 min),8.27
                                                                                                        ochratoxin   A(OTA ,
                                                                                                           min), ochratoxin
     9.28
     A(OTAmin),  beauvericin
             , 9.28              (BEA) and
                    min), beauvericin          the and
                                           (BEA)    enniatins   (ENNA,
                                                         the enniatins    A1, B and
                                                                       (ENNA,         B1)
                                                                                  A1, B    in B1)
                                                                                         and   broiler  chicken
                                                                                                   in broiler     plasma
                                                                                                              chicken     at a
                                                                                                                      plasma
     concentration
     at a concentration of 10 ng/mL; and (c) enlargement of (b): LC-MS/MS chromatogram showing the
                      of  10  ng/mL;      and   (c) enlargement     of  (b):  LC-MS/MS      chromatogram        showing    the
     separation
     separation ofofBEA
                      BEAand  andthethe    enniatins
                                      enniatins   (ENNA,(ENNA,
                                                             A1, B A1,  B and
                                                                   and B1)        B1) in
                                                                             in broiler    broiler
                                                                                        chicken      chicken
                                                                                                  plasma        plasma at a
                                                                                                           at a concentration
     concentration
     of 10 ng/mL. of 10 ng/mL.

      Sinceananisotopically
     Since         isotopically    labeled
                              labeled  IS forISeach
                                                 forsingle
                                                        eachmycotoxin
                                                               single mycotoxin       is tooand
                                                                         is too expensive      expensive     and not
                                                                                                  not commercially
commercially      available,  an  IS labeled   with   [13 C] or [15 N] was used for each group of mycotoxins.
available, an IS labeled with [ C] or [ N] was used for each group of mycotoxins. [13C15]-
                                       13          15

[13 C15 ]-deoxynivalenol
deoxynivalenol     was used  was   used
                               as IS for as IS for
                                          DON,       DON, and
                                                 DOM-1       DOM-1    and 3/15ADON;
                                                                 3/15ADON;                [13 C17 ]-Aflatoxin
                                                                               [13C17]-Aflatoxin   B1 for AFB1  B1and
                                                                                                                   for
AFB1 and              13                                    13                          FB1; [13 C6 15 N]-Tenuazonic
AFM1;    [13CAFM1;   [ C20 ]-Ochratoxin
             20]-Ochratoxin   A for OTA; [A13C for  OTA; [ C34 ]-Fumonisin
                                                34]-Fumonisin     B1 for FB1; [13B1 for
                                                                                 C615 N]-Tenuazonic     acid for TeA,
acid for
AME    and TeA,
             AOH;AME    and
                     [13C    AOH; [13 C18 ]-Zearalenone
                         18]-Zearalenone     for ZEN, AZAL,    for ZEN,
                                                                   BZAL,AZAL,
                                                                           AZEL,BZAL,BZELAZEL,
                                                                                           and ZAN; BZELandand[15ZAN;
                                                                                                                  N3]-
Enniatin B for ENNA, ENNA1, ENNB, ENNB1 and BEA. Hence, an optimal correction for matrix
Toxins 2019, 11, 171                                                                                                         10 of 30

and [15 N3 ]-Enniatin B for ENNA, ENNA1, ENNB, ENNB1 and BEA. Hence, an optimal correction
      Toxins 2019,
for matrix         11, x FOR
               effects   andPEER   REVIEW
                               losses  during sample preparation was obtained, which was confirmed                       10 of during
                                                                                                                               31

method validation (see Table 2, Tables S6–S9, and Results Section for accuracy and precision).
      effects and losses during sample preparation was obtained, which was confirmed during method
      Data acquisition
      validation    (see Tableon2,the  high-resolution
                                   Tables    S6–S9, and Results massSection
                                                                       spectrometer      (HRMS)
                                                                               for accuracy        was done in the positive or
                                                                                             and precision).
negative Data
            ESI resolution       mode,     using     the  MS    E continuum scan function. The results were processed
                   acquisition on the high-resolution mass spectrometer (HRMS) was done in the positive or
usingnegative
        the Unify ESI version    1.8mode,
                        resolution    softwareusing(Milford,       MA, USA)scan
                                                       the MSE continuum         to determine    theresults
                                                                                     function. The   phasewereI andprocessed
                                                                                                                      II metabolite,
for which
      using nothe commercial
                   Unify versionanalytical
                                    1.8 software   standards
                                                      (Milford,were     available.
                                                                   MA, USA)    to determine the phase I and II metabolite,
      for which no commercial
      Metabolites        known in the analytical     standards
                                            literature     were were
                                                                   addedavailable.
                                                                           to the accurate mass—MSe screening method
and additionally a pathway profiling MS processing to
            Metabolites     known    in  the   literature E were   added      the accurate
                                                                           method            mass—MSe
                                                                                      (the chemical       screening
                                                                                                      formulas      and method
                                                                                                                           theoretical
      and  additionally     a pathway     profiling    MS  E processing method (the chemical formulas and theoretical
accurate masses were added) with additional adducts and transformations was made. Peaks were
      accurate masses were added) with additional adducts and transformations was made. Peaks were
identified based on the found accurate mass in the low energy spectrum and the product ions generated
      identified based on the found accurate mass in the low energy spectrum and the product ions
in the high energy spectrum. An additional confirmation criterion was the observed profile of peak
      generated in the high energy spectrum. An additional confirmation criterion was the observed profile
areasofversus     time,
         peak areas        seen time,
                         versus  in theseensamples       obtained
                                                in the samples        duringduring
                                                                   obtained     the toxicokinetic    study.
                                                                                      the toxicokinetic  study.AnAnexample
                                                                                                                       example of an
extracted
      of an ion   chromatogram
             extracted                 of a glucuronidated
                          ion chromatogram                          metabolite
                                                   of a glucuronidated            of ZEN
                                                                           metabolite       and and
                                                                                        of ZEN  the corresponding
                                                                                                     the corresponding    low  energy
                                                                                                                             low
and high    energy     spectra,   which    was     detected     in a plasma    sample   of a pig  administered
      energy and high energy spectra, which was detected in a plasma sample of a pig administered an                an  intra-gastric
bolusintra-gastric
        of ZEN (3 bolusmg/kg     bw), (3
                              of ZEN    is mg/kg
                                           shownbw),   in Figure
                                                            is shown6. in Figure 6.
      The TheUnifyUnify    version1.8.
                       version     1.8. software
                                          software(Waters,
                                                        (Waters,  Milford,  MA, MA,
                                                                     Milford,     USA) USA)
                                                                                         detected two peaks
                                                                                                detected   two with   the exact
                                                                                                                   peaks     with the
exactmass
       massofofZEN-glucuronide
                   ZEN-glucuronide      [m/z[m/z494.1788].    However,
                                                      494.1788].          only the
                                                                     However,        MS/MS
                                                                                   only       spectrumspectrum
                                                                                         the MS/MS      of the secondof the peak
                                                                                                                               second
      (4.68 min)   showed     the product     ions  [m/z  317   and  175] of ZEN-glucuronide
peak (4.68 min) showed the product ions [m/z 317 and 175] of ZEN-glucuronide as defined in the   as defined  in  the literature
      [19]. The first fragment ion (m/z = 317), corresponds with the loss of glucuronic acid (176 amu) and
literature [19]. The first fragment ion (m/z = 317), corresponds with the loss of glucuronic acid
      the second at m/z = 175 results from the loss of the aglycone from the quasimolecular ion [48]. The
(176 amu) and the second at m/z = 175 results from the loss of the aglycone from the quasimolecular
      data of the first peak can be found in Figure S1.
ion [48]. The data of the first peak can be found in Figure S1.

                                              (A) Extracted Ion Chromatogram

                                                  (B) Low Energy spectrum

                                                          Figure 6. Cont.
Toxins 2019, 11, 171                                                                                                     11 of 30
      Toxins 2019, 11, x FOR PEER REVIEW                                                                          11 of 31

                                                (C) High Energy spectrum
           Figure
      Figure      6. (A)
              6. (A)  LC LC   high-resolutionextracted
                          high-resolution     extracted mass
                                                         mass chromatogram
                                                                chromatogram   of of
                                                                                   a plasma
                                                                                      a plasmasample  that that
                                                                                                 sample    was taken
                                                                                                                was taken
      fromfrom  a pig
            a pig     that
                   that    receivedan
                        received    an intra-gastric
                                       intra-gastricbolus
                                                      bolusof zearalenone (ZEN)(ZEN)
                                                               of zearalenone     (3 mg/kg
                                                                                         (3 bw);
                                                                                            mg/kgthe following
                                                                                                      bw); themass-
                                                                                                                following
           to-charge (m/z) values, corresponding to the theoretical exact mass of the deprotonated molecular ions
      mass-to-charge (m/z) values, corresponding to the theoretical exact mass of the deprotonated
           [M − H]−, were extracted from the total ion chromatogram using Unify 1.8 software: ZEN-glucuronide:
      molecular ions [M − H]− , were extracted from the total ion chromatogram using Unify 1.8 software:
           [m/z 493.1788]. (B) In the low energy MS/MS spectrum, this mass was confirmed as m/z-value
      ZEN-glucuronide: [m/z 493.1788]. (B) In the low energy MS/MS spectrum, this mass was confirmed
           493.17121 (target mass error = 10 ppm). (C) In the high energy MS/MS spectrum, the corresponding
      as m/z-value    493.17121
           product ions            (targetand
                         at m/z 317.13877   mass   error =(target
                                               175.04015     10 ppm).   (C) =In10the
                                                                  mass error          high
                                                                                   ppm)  are energy
                                                                                             shown. MS/MS spectrum,
      the corresponding product ions at m/z 317.13877 and 175.04015 (target mass error = 10 ppm) are shown.
      2.2. Method Validation
2.2. Method Validation
           The most optimal extraction protocol for plasma, urine and feces of pigs and plasma of broiler
      The most
     chickens     optimal
                was          extraction
                     not validated          protocol for
                                       for fumonisins     dueplasma,
                                                               to low urine    andTherefore,
                                                                       recovery.    feces of pigs
                                                                                                it wasand  plasma
                                                                                                        decided      of broiler
                                                                                                                  to only
chickens    wasfumonisin
     validate    not validated       for fumonisins
                            B2 in broiler                 due hence
                                            chicken excreta,    to lowinrecovery.
                                                                         this matrixTherefore,
                                                                                      25 mycotoxins it was
                                                                                                        weredecided
                                                                                                              validated. to only
validate fumonisin      B2 incoefficient
           The correlation      broiler chicken      excreta,
                                           (r) and the         hence in this
                                                         goodness-of-fit        matrix
                                                                           (g) are shown 25 in
                                                                                             mycotoxins
                                                                                               Table 1 as anwere   validated.
                                                                                                               average    ±
     standard   deviation   of three  curves   made    across three different  analysis days.  The  linearity
      The correlation coefficient (r) and the goodness-of-fit (g) are shown in Table 1 as an average ±         results for
     the other
standard        matrices
            deviation   of can
                           threebe curves
                                    found in    Tables
                                              made      S2–S5.three
                                                      across    Theydifferent
                                                                      ranged for   pig plasma
                                                                                 analysis  days. from
                                                                                                   The0.993   to 0.998
                                                                                                         linearity      (r) for
                                                                                                                    results
     and   9.0% to  17.5%  (g); for  pig urine   from   0.995 to 0.999 (r) and  3.5%  to 17.0%   (g); for
the other matrices can be found in Tables S2–S5. They ranged for pig plasma from 0.993 to 0.998 (r) and   pig feces from
     0.993 to 0.999 (r) and 7.1% to 18.7% (g); for chicken plasma from 0.994 to 0.999 (r) and 5.9% to 17.7%
9.0% to 17.5% (g); for pig urine from 0.995 to 0.999 (r) and 3.5% to 17.0% (g); for pig feces from 0.993 to
     (g); and for chicken excreta from 0.995 to 0.999 (r) and 5.1% to 16.80% (g). Most of the calibration
0.999 (r) and 7.1% to 18.7% (g); for chicken plasma from 0.994 to 0.999 (r) and 5.9% to 17.7% (g); and for
     curves matched a linear calibration model with a 1/x weighing factor, except for the ENNs and BEA.
chicken
     Theseexcreta  from 0.995
             components     showtoa0.999     (r) and
                                      quadratic    1/x 5.1%  to Linearity
                                                        model.  16.80% (g).   Mostofof
                                                                           results      thecomponent
                                                                                      each   calibrationseparately
                                                                                                           curves matched
                                                                                                                       for     a
linearpig
        calibration  model     with
          plasma are shown in Table 1.a 1/x   weighing     factor, except   for the ENNs     and   BEA.   These   components
show a quadratic 1/x model. Linearity results of each component separately for pig plasma are shown
in Table 1.Table 1. Validation results for linearity (linear range, correlation coefficient (r) and goodness-of-fit
           coefficient (g)) and limit of quantification (LOQ) of 24 mycotoxins in pig plasma.
      Table 1. Validation results for linearity (linear range, correlation coefficient (r) and goodness-of-fit
                                            Linearity (n = 3 Different Days)
      coefficient (g)) Analyte
                       and limit ofLinear
                                    quantification  (LOQ) of 24
                                          Range (ng/mL)        r ± mycotoxins
                                                                   SD         in±pig
                                                                          g (%)
                                                                                      LOQ (ng/mL)
                                                                                 SD plasma.
                     ZEN             1–200            0.996 ± 0.003  12.9 ± 3.8                  1.0
                                       Linearity (n = 3 Different Days)
             Analyte
                     AZEL            1–200            0.995 ± 0.002  15.0 ± 1.2                  1.0   LOQ (ng/mL)
                     AZAL   Linear Range
                                     1–200            0.995±
                                                    r±   SD 0.003    15.2  ± 3.6± SD
                                                                        g (%)                    1.0
                     BZAL     (ng/mL)1–200            0.996 ± 0.001  10.7 ± 2.0                  1.0
              ZEN    BZEL      1–200 1–200             ± 0.003
                                                0.9960.996  ± 0.002  14.912.9  ± 3.8
                                                                           ± 3.7                 1.0        1.0
              AZEL ZAN         1–200 1–200             ± 0.002
                                                0.9950.997  ± 0.001  16.315.0  ± 1.2
                                                                           ± 3.1                 1.0        1.0
              AZAL TEA         1–200 1–200             ± 0.003
                                                 0.9950.998 ± 0.001  12.015.2  ± 3.6
                                                                           ± 4.9                 1.0        1.0
              BZAL AOH         1–200 1–200             ± 0.001
                                                0.9960.997  ± 0.002  12.910.7  ± 2.0
                                                                           ± 5.2                 1.0        1.0
              BZEL             1–200            0.996 ± 0.002            14.9 ± 3.7                         1.0
                     AME             1–200            0.996± 0.004   13.1± 5.1                   1.0
              ZAN              1–200            0.997 ± 0.001            16.3 ± 3.1                         1.0
                     DON             1–200            0.998 ± 0.002  13.9 ± 4.4                  1.0
               TEA             1–200            0.998 ± 0.001            12.0 ± 4.9                         1.0
              AOH DOM-1        1–200 1–200      0.9970.997  ± 0.003
                                                       ± 0.002       16.912.9
                                                                           ± 2.5
                                                                               ± 5.2             1.0        1.0
              AME 3/15 ADON    1–200 1–200       0.9960.998 ± 0.001
                                                       ± 0.004        9.313.1
                                                                          ± 3.1± 5.1             1.0        1.0
              DON      T2      1–200 1–200      0.9980.998  ± 0.001
                                                       ± 0.002        9.913.9
                                                                          ± 1.6± 4.4             1.0        1.0
             DOM-1 HT2         1–200 1–100             ± 0.003
                                                0.9970.993  ± 0.002  17.516.9  ± 2.5
                                                                           ± 2.8                 1.0        1.0
           3/15 ADON T2G       1–200 2–200             ± 0.001
                                                0.9980.995  ± 0.003  14.49.3  ± 3.1
                                                                           ± 1.2                 2.0        1.0
                T2   AFB1      1–200 1–200             ± 0.001
                                                0.9980.996  ± 0.002  12.79.9  ± 1.6
                                                                           ± 2.8                 1.0        1.0
               HT2             1–100            0.993 ± 0.002            17.5 ± 2.8                         1.0
               T2G             2–200            0.995 ± 0.003            14.4 ± 1.2                         2.0
              AFB1             1–200            0.996 ± 0.002            12.7 ± 2.8                         1.0
              AFM1             1–200            0.997 ± 0.002            13.8 ± 5.6                         1.0
              OTA              1–200             0.993 ±0.004             9.3 ± 2.9                         1.0
Toxins 2019, 11, 171                                                                                             12 of 30

                                                    Table 1. Cont.

                                           Linearity (n = 3 Different Days)
              Analyte         Linear Range                                                         LOQ (ng/mL)
                                                        r ± SD                g (%) ± SD
                                (ng/mL)
              ENNA1               1–200              0.998 ± 0.001            9.0 ± 0.9                1.0
              ENNA                1–50               0.995 ± 0.003            13.9 ± 3.2               1.0
               ENNB               1–100              0.993 ± 0.002            9.3 ± 1.2                1.0
              ENNB1               1–100              0.998 ± 0.001            15.9 ± 2.3               1.0
                BEA               1–100              0.998 ± 0.000            16.6 ± 4.5               1.0
                        Note: SD, standard deviation; acceptance criteria: r ≥ 0.990 and g ≤ 20.

      The LOQ that was aimed for during method development was 1 ng/mL or ng/g. This could be
obtained for the majority of the components in the different matrices, with the following exceptions:
DOM1 (4 ng/mL) and T2G (2 ng/mL) in pig urine; T2G (2 and 5 ng/mL) in pig and broiler chicken
plasma; and T2G (2 ng/g), HT2 (4 ng/g) and FB2 (10 ng/g) in broiler chicken excreta. In pig feces,
the LOQ for ZEN, AZAL, AOH, DON, DOM-1, HT2 and T2G was established at 5 ng/g.
      No peaks were detected at the retention time zone of the analytes of interest in the solvent sample
that was injected after the highest calibrator sample, thus demonstrating the absence of carry over.
Moreover, for none of the components a signal was observed at the elution zone of the analytes of
interest in a blank matrix sample. This indicates a good specificity of the method.
      The results of the within-day and between-day precision and accuracy met the specifications for
all mycotoxins and matrices. The results can be found in Table 2 for pig plasma and Tables S6–S9 for
the other matrices.
      The results for matrix effects (signal enhancement and suppression) and extraction recovery are
shown in the Tables S10 and S11. Most components gave acceptable results (range 60–140%). However,
for some components, matrix effects were more pronounced and recovery was rather low. However,
for all mycotoxins, an adequate internal standard and matrix-matched calibration curves were used,
resulting in validation results for accuracy and precision matching the acceptance criteria.
      The validation results for the other matrices can be found in Tables S6–S9.
      This resulted in a fully validated quantitative targeted LC-MS/MS method and additionally
a qualitative untargeted LC-HRMS method. Both methods together enable not only determining
mycotoxins with good sensitivity but also targeting a broad range of mycotoxins and their metabolites,
not limited by the commercial availability of standards. This approach makes is possible to determine
24 mycotoxins and their relevant metabolites in easily obtainable biological matrices (plasma, urine
and feces) of pigs and broiler chickens. This is the first time that a paper covers such a broad range
of matrices and mycotoxins with a simple and practical sample preparation. This leads to a general
applicable method that can be applied in, among others, in vivo toxicokinetic studies and screening
studies to investigate the exposure of individual animals to mycotoxins, as shown in Section 2.3.

2.3. Biological Samples: Toxicokinetic Study

2.3.1. Pigs
     In the pig plasma samples, low concentrations (1–15 ng/mL) of DON and ZEN were found
using LC-MS/MS analysis. The plasma concentration–time curves for these components are shown in
Figure S2. However, analysis of the samples using the LC-HRMS instrument showed that DON-GlcA
and ZEN-GlcA are better biomarkers for exposure as their observed peak areas are much higher
than those of the respective parent components DON and ZEN [9,20]. Since no DON-GlcA and
ZEN-GlcA standards were available at our laboratory, these components were tentatively identified
using the LC-HRMS multi-method. DON-GlcA and ZEN-GlcA plasma response–time curves are
shown in Figure 7. The highest response for ZEN-GlcA was achieved at 30 min and for DON-GlcA at
4 h post-administration.
Toxins 2019, 11, 171                                                                                                                                                               13 of 30

                                   Table 2. Results of the within-day and between-day precision and accuracy experiments for 24 mycotoxins in pig plasma.

                                    Within-Day Precision and Accuracy (n = 6)                                             Between-Day Precision and Accuracy (n = 3 × 3)
                           Theoretical            Theoretical Concentration     Theoretical Concentration       Theoretical        Theoretical Concentration   Theoretical Concentration
                        Concentration LOQ                 10 ng/mL                     100 ng/mL             Concentration LOQ             10 ng/mL                   100 ng/mL
     Analyte
                       Precision      Accuracy     Precision     Accuracy        Precision     Accuracy     Precision   Accuracy    Precision     Accuracy      Precision     Accuracy
                       (RSD %)          (%)        (RSD %)          (%)          (RSD %)         (%)        (RSD %)       (%)       (RSD %)         (%)         (RSD %)         (%)
       ZEN               12.1           6.5           7.3            1             5.4          −1.5          13.4        2.7          7.5          2.4            5.7         −2.2
      AZEL                6.5          19.7           13            2.3            7.4           6.6          35.4       −5.3         10.9         −0.7           11.6          1.5
      AZAL               17.4          −14.5         7.7           −1.4            4.4          −0.4          20.9       −3.3          8.2         −5.2            8.1         −4.9
      BZAL                5.2            7            3.5           8.2            2.9           8.9           9.3        6.2          3.9          6.6           10.7          4.2
      BZEL               13.0          −9.2           5.1          −1.8             6.1         −2.4          15.9       −1.8          8.1         −4.9            6.6         −5.3
       ZAN               11.7          −40.5         3.9            8.8            4.6           3.0          21.5       −32.4        3.6           9.8           7.1           0.4
       TEA                2.8          19.0           3.2           8.2             3.6          4.5          10.7       18.2          3.4          8.7            5.8          4.8
       AOH               17.6          −32.2         3.5            8.6            3.8          −0.4          26.9       −20.8        4.5           9.5           5.3          −3.1
       AME               14.1          10.1           7.7           2.4            4.8          −12.3         18.7       −5.3          7.0          4.8           5.9          −11.9
       DON               24.9          −8.0           6.9           1.0            5.6          −5.7          22.3        4.4         10.0          2.3             8          −4.6
     DOM-1               17.5          −0.4          15.0          −3.3             5.9         −6.9          14.7       −2.0          14          −2.7            7.9         −7.3
   3/15 ADON             15.6           7.5           5.2           5.2            6.4          −3.5          16.4       10.9          5.4          6.9            8.6         −3.5
        T2               15.4           3.3           1.6           7.7            2.7           8.4          12.7        3.7          1.5          8.1            6.2          5.0
       HT2               21.1          −29.8         6.5           −14.0           9.9           5.8          30.5       −21.4        10.0         −11.5           5.7          2.1
       T2G               10.8          −3.8           7.8           6.9            7.0           1.3          23.8       −2.6          9.5          4.1           13.8          6.6
      AFB1               13.1          −14.3          3.0           3.9            4.9          −2.0          16.4       −16.9         3.6          4.5           6.3          −2.8
      AFM1               11.2          −38.8         10.6          −19.5           8.8          −15.6         28.0       −28.5        18.8         −7.1           20.2         −5.4
       OTA                7.5          13.4           8.7          −13.3           4.5          −12.3         14.4        2.5          7.2         −12.5           9.2         −8.0
     ENN A1              15.7          −11.3         12.6          −3.7             6.7          1.8          14.6       −2.3         10.8         −0.8            9.6         −0.9
      ENNA               19.4          −1.0           9.4          −14.1           11.7         −14.7         41.7       −11.2        13.8         −6.8           13.5         −5.6
      ENNB               16.7          −0.1          11.8           9.6            2.6           9.4          16.8       −1.4         13.9         −1.3            6.6          4.1
     ENNB1                7.6          16.1           3.9          −0.1             3.5         −3.9          31.8        1.6          8.7          5.5            3.2         −3.2
       BEA               13.3          −2.9           3.2           6.9            3.2           7.4          29.7       −6.3          2.3          7.2           11.9          8.5
      Note: The acceptance criteria: Accuracy, ≤1 ng/mL: −50% to +20%; 1–10 ng/mL: −30% to +10%; ≥10ng/mL: −20% to +10%. Within-day precision: RSD% < RSDmax with RSDmax for
      ≥1 to
Toxins 2019, 11, x FOR PEER REVIEW                                                                                       13 of 31
Toxins 2019, 11, 171                                                                                                      14 of 30

                                                              (A)

                                                              (B)
                    HRMS response–time
     Figure 7. (A) HRMS     response–time curve of deoxynivalenol-glucuronide
                                                            deoxynivalenol-glucuronide (DON-GlcA)
                                                                                            (DON-GlcA) in plasma after
     intra-gastric administration     of deoxynivalenol       (DON,
      intra-gastric administration of deoxynivalenol (DON, 36 µg/kg    36  µg/kg   bw) to pigs
                                                                                          pigs (n
                                                                                               (n == 8). The mean ratio of
     the HRMS                                    13
          HRMS peak
                  peak areas
                        areasof ofDON-GlcA/
                                   DON-GlcA/ C    13 C1515-DON
                                                           -DON++SD  SD isis shown.
                                                                             shown. (B)
                                                                                     (B) HRMS response–time curve of      of
     zearalenone-glucuronide
      zearalenone-glucuronide(ZEN-GlcA)
                                   (ZEN-GlcA)in in   plasma    after
                                                          plasma     intra-gastric
                                                                   after            administration
                                                                           intra-gastric             of zearalenone
                                                                                         administration               (ZEN,
                                                                                                            of zearalenone
     3(ZEN,
        mg/kg   bw) tobw)
                       pigsto(npigs
                                = 8).(nThe                                                                13 C 13
             3 mg/kg                     = 8).mean  ratio of
                                               The mean        theof
                                                             ratio HRMS
                                                                      the HRMSpeak areas of ZEN-GlcA/
                                                                                   peak areas  of ZEN-GlcA/   18 -ZEN  + SD+
                                                                                                                  C18-ZEN
     is shown.
      SD is shown.

     In
     In pig
        pig feces,
            feces, no
                   no traces
                       traces of
                               of DON
                                  DON were
                                         were observed.
                                                observed. This
                                                             This can
                                                                  can be
                                                                       be explained
                                                                          explained byby the
                                                                                          the complete
                                                                                               complete absorption
                                                                                                        absorption
and
and fast elimination of DON in urine, while only 1–3% of the administered dose is
    fast elimination    of DON     in urine,   while   only  1–3%  of  the administered     dose  is reported
                                                                                                     reported to
                                                                                                               to be
                                                                                                                  be
excreted  via feces [16].  The  concentration–time        profiles of ZEN   and  its phase   I metabolites
excreted via feces [16]. The concentration–time profiles of ZEN and its phase I metabolites in feces        in feces
showed
showed maximum
         maximum levels
                      levels from
                             from the
                                    the first
                                        first 12
                                               12 hh after
                                                     after exposure
                                                           exposure onwards
                                                                      onwards (Figure
                                                                                (Figure 8).
                                                                                          8). The
                                                                                              The highest
                                                                                                   highest amounts
                                                                                                           amounts
were
were excreted during 12–24 h. This is in line with the observations of Binder et al., who
      excreted  during   12–24   h.  This  is in line  with  the observations   of  Binder   et al., who found
                                                                                                         found the
                                                                                                                 the
highest amounts    of ZEN   and   metabolites    were   excreted  during
highest amounts of ZEN and metabolites were excreted during 24–48 h [19].  24–48 h  [19].
Toxins 2019, 11, x FOR PEER REVIEW                                                                                      14 of 31
Toxins 2019, 11, 171                                                                                                      15 of 30

                                (A)                                                        (B)

                                (C)                                                       (D)
      Figure 8.
     Figure    8. (A)
                    (A)Concentration–time
                          Concentration–time  curvecurve
                                                     of zearalenone   (ZEN) in (ZEN)
                                                            of zearalenone      feces after
                                                                                         in intra-gastric
                                                                                              feces after administration
                                                                                                             intra-gastric
      of ZEN    (3  mg/kg    bw)   to  pigs (n  = 8).  The   mean  + SD   is shown.    (B) Concentration–time
     administration of ZEN (3 mg/kg bw) to pigs (n = 8). The mean + SD is shown. (B) Concentration–time              curves
      of α-zearalenol
     curves               (AZEL)
              of α-zearalenol        in feces
                                (AZEL)         afterafter
                                          in feces    intra-gastric administration
                                                          intra-gastric administration of of
                                                                                          ZENZEN (3(3mg/kg
                                                                                                      mg/kg bw) to  to pigs
                                                                                                                        pigs
      (n==8).
     (n    8).The
                Themean
                      mean+ +SDSDis is shown.
                                     shown.  (C) (C)   Concentration–time
                                                  Concentration–time     curvecurve   of β-zearalenol
                                                                                 of β-zearalenol        (BZEL)
                                                                                                   (BZEL)          in after
                                                                                                            in feces   feces
      after intra-gastric
     intra-gastric          administration
                     administration     of ZEN of (3
                                                  ZEN    (3 mg/kg
                                                      mg/kg   bw) tobw)pigsto(n
                                                                              pigs (n The
                                                                                = 8). = 8).mean
                                                                                             The mean
                                                                                                    + SD +is SD  is shown.
                                                                                                              shown.    (D)
      (D) Concentration–time        curve  zearalanone     (ZAN)  in feces  after intra-gastric  administration
     Concentration–time curve zearalanone (ZAN) in feces after intra-gastric administration of ZEN (3               of ZEN
      (3 mg/kg
     mg/kg    bw)bw)    to pigs
                   to pigs  (n =(n
                                 8).=The
                                      8). The
                                          meanmean
                                                 + SD+isSD  is shown.
                                                          shown.

       In pig
      In  pig urine,
               urine, DON,
                       DON, ZEN ZEN and
                                      and ZEN-GlcA
                                             ZEN-GlcA were were detected.
                                                                  detected. TheThe maximum
                                                                                     maximum concentrations
                                                                                                   concentrations were  were
 achieved after
achieved    after 4–8
                   4–8 h
                       h for
                          for ZEN,
                              ZEN, ZEN-GlcA
                                    ZEN-GlcA and   andDON.
                                                        DON.Nagl Nagletetal.
                                                                          al.also
                                                                              alsodemonstrated
                                                                                    demonstrateda afast  fastelimination
                                                                                                               elimination  of
 DON    in urine   with  a maximum     concentration     in  the first 4 h. DON     showed
of DON in urine with a maximum concentration in the first 4 h. DON showed to be the most      to be  the  most    important
 urinary metabolite
important                 [16]. Binder
             urinary metabolite     [16].et   al. also
                                           Binder        detected
                                                    et al.          ZEN and
                                                           also detected    ZENZEN-GlcA
                                                                                   and ZEN-GlcA in piginurine
                                                                                                          pig urineafterafter
                                                                                                                         oral
 administration
oral  administrationof ZEN,   with
                         of ZEN,    ZEN-GlcA
                                  with  ZEN-GlcA   as the  major
                                                      as the       metabolite.
                                                               major   metabolite.In In
                                                                                      this study,
                                                                                        this study,thethe
                                                                                                        response
                                                                                                           response  ratio  of
                                                                                                                        ratio
 ZEN-GlcA/IS       was   also much   higher    than the  area  ratio  of ZEN/IS,     indicating
of ZEN-GlcA/IS was also much higher than the area ratio of ZEN/IS, indicating ZEN-GlcA as a major ZEN-GlcA        as a major
 metabolite [19].
metabolite    [19]. The
                     The concentration
                          concentration (or(or HRMS
                                                HRMS response)–time
                                                        response)–timecurvescurvesofofthese
                                                                                        thesemolecules
                                                                                               moleculesare   aredepicted
                                                                                                                   depicted in
 Figure  9.
in Figure 9.
       Inall
      In  allfeces
              fecesand
                     andurine
                          urinesamples,
                                 samples,low lowconcentrations
                                                  concentrations(or  (orHRMS
                                                                          HRMSresponse
                                                                                   responseareas)
                                                                                               areas)were
                                                                                                       wereobserved
                                                                                                               observedat   at
 thetime
the   timeofofadministration
                administrationdue duetotothethe  presence
                                              presence   of of
                                                             lowlow  levels
                                                                  levels  DON DONandandZEN ZEN    in feed.
                                                                                             in the   the feed.     In urine,
                                                                                                             In urine,   this
 this concentration    was   negligible,  especially  when    compared     to the  concentration
concentration was negligible, especially when compared to the concentration after administration. Inafter  administration.
 In feces,
feces,  the the   effect
              effect  of of
                          thethe administration
                               administration     waswas   onlyseen
                                                         only     seenafter
                                                                         after1010h.h. Twelve
                                                                                         Twelvehours
                                                                                                   hours fasting
                                                                                                            fasting before
                                                                                                                      before
 administrationwas
administration      wasnotnotenough
                              enoughto toeliminate
                                           eliminatethetheconcentration
                                                            concentrationof   ofmycotoxins
                                                                                 mycotoxinsin   infeces
                                                                                                   fecesafter
                                                                                                          afterlong-term
                                                                                                                  long-term
 exposure    in  this study.   However,      blank  samples     were   obtained    in  previous
exposure in this study. However, blank samples were obtained in previous studies, as shown        studies,    as   shown in in
 FigureS3.
Figure   S3.
Toxins 2019,
       Toxins11, 17111, x FOR PEER REVIEW
             2019,                                                                                                          16 of 30
                                                                                                                      15 of 31

                                                                (A)

                                                                (B)

                                                                (C)

      FigureFigure
               9. (A)9. (A) Concentration–time curves
                         Concentration–time        curves ofof deoxynivalenol
                                                                deoxynivalenol (DON)
                                                                                   (DON)  in in
                                                                                              urine
                                                                                                 urineafter  intra-gastric
                                                                                                          after  intra-gastric
            administration
      administration        of DON
                        of DON   (36 (36
                                     µg/kgµg/kg bw)totopigs
                                               bw)      pigs(n
                                                             (n== 8).
                                                                  8). The
                                                                      Themean
                                                                           mean+ +
                                                                                 SDSD
                                                                                    is shown
                                                                                       is shown(B) (B)
                                                                                                   Concentration–time
                                                                                                        Concentration–time
      curvescurves  of zearalenone
              of zearalenone       (ZEN)
                                (ZEN)    in in urine
                                            urine    afterintra-gastric
                                                   after   intra-gastric administration
                                                                         administrationofof ZEN
                                                                                              ZEN (3 mg/kg
                                                                                                     (3 mg/kg bw) bw)
                                                                                                                   to pigs
                                                                                                                        to pigs
            (n = 8). The mean + SD is shown. (C) The HRMS response–time curves of zearalenone-glucuronide
      (n = 8). The mean + SD is shown. (C) The HRMS response–time curves of zearalenone-glucuronide
            (ZEN-GlcA) in urine after intra-gastric administration of ZEN (3 mg/kg bw) to pigs (n = 8). The mean
      (ZEN-GlcA) in urine after intra-gastric administration           of ZEN (3 mg/kg bw) to pigs (n = 8). The mean
            ratio of the HRMS peak areas of ZEN-GlcA/13C18-ZEN + SD is shown.
      ratio of the HRMS peak areas of ZEN-GlcA/13 C18 -ZEN + SD is shown.
      2.3.2. Broiler Chickens
2.3.2. Broiler Chickens
            AFB1 and OTA were detected in plasma, as well as in excreta samples. No other relevant
     AFB1   and OTA were detected in plasma, as well as in excreta samples. No other relevant
     metabolites were found by LC-HRMS. The concentration (response)–time curves are shown in Figure
metabolites
     10. OTA were
               andfound  by LC-HRMS.
                   AFB1 showed           The
                                  a second    concentration
                                            peak              (response)–time
                                                  in the plasma                 curves
                                                                 concentration–time     are around
                                                                                     curve  shown 4inhFigure
                                                                                                         p.a. 10.
OTA and
     This can be attributed to enterohepatic recirculation, which has previously been described for OTA can
          AFB1   showed   a second  peak  in the plasma   concentration–time   curve  around   4 h  p.a. This
be attributed   tomaximum
     [49,50]. The enterohepatic   recirculation,
                             concentration measuredwhich   has was
                                                      for AFB1  previously
                                                                    8.4 ng/mLbeen
                                                                               and described
                                                                                   for OTA was for50OTA   [49,50].
                                                                                                     ng/mL,
The maximum concentration measured for AFB1 was 8.4 ng/mL and for OTA was 50 ng/mL, for both
toxins observed after 15 min. After administration of DON, only DON-sulfate was found in plasma
and excreta due to the high conversion rate of DON to DON-sulfate in broiler chickens, confirming
previous literature reports [9,16]. The maximum response was achieved after 30 min.
You can also read