Mountain trails - Narrative mapping during the four weeks leading up to election day - US 2020 elections
←
→
Page content transcription
If your browser does not render page correctly, please read the page content below

Mountain trails - Narrative mapping during
the four weeks leading up to election day
US 2020 elections

botswatch Technologies
"Mountain trails - Narrative mapping during the four weeks leading up to election day"
is licensed under Attribution-NonCommercial-NoDerivatives 4.0 International

botswatch Technologies
Albrechtstrasse 16 | 10117 Berlin | Germany
350 Townsend Street 710 | San Francisco | CA 94107 | United States
www.botswatch.io

Berlin, March 2021
©Copyright 2021, botswatch Technologies
Contents
1 Context                                                                                                                                                               2

2 Executive summary                                                                                                                                                     3

3 Narrative landscape                                                                                                                                                   4

4 Narratives                                                                                                                                                             7
  4.1 Toxic Narratives . . . . . . . . . . . . . . . . . . . . . .                          .   .   .   .   .   .   .   .   .   .   .   .   .   .   .   .   .   .   .    7
  4.2 Leaks . . . . . . . . . . . . . . . . . . . . . . . . . . . .                         .   .   .   .   .   .   .   .   .   .   .   .   .   .   .   .   .   .   .    8
  4.3 Sensitive Content . . . . . . . . . . . . . . . . . . . . .                           .   .   .   .   .   .   .   .   .   .   .   .   .   .   .   .   .   .   .    9
  4.4 Conspiracy Theories and QAnon . . . . . . . . . . . .                                 .   .   .   .   .   .   .   .   .   .   .   .   .   .   .   .   .   .   .   10
  4.5 Voter Suppression and Fraudulent Electoral Process                                    .   .   .   .   .   .   .   .   .   .   .   .   .   .   .   .   .   .   .   12
  4.6 Narratives of 2020 . . . . . . . . . . . . . . . . . . . . .                          .   .   .   .   .   .   .   .   .   .   .   .   .   .   .   .   .   .   .   13
  4.7 Narratives used by the IRA in 2016 . . . . . . . . . . .                              .   .   .   .   .   .   .   .   .   .   .   .   .   .   .   .   .   .   .   13

5 Facebook                                                                                                                                                              15
  5.1 Top narratives . . . . . . . . . . . .    .   .   .   .   .   .   .   .   .   .   .   .   .   .   .   .   .   .   .   .   .   .   .   .   .   .   .   .   .   .   15
  5.2 Most promoted Facebook Pages .            .   .   .   .   .   .   .   .   .   .   .   .   .   .   .   .   .   .   .   .   .   .   .   .   .   .   .   .   .   .   16
  5.3 Most promoted Facebook content            .   .   .   .   .   .   .   .   .   .   .   .   .   .   .   .   .   .   .   .   .   .   .   .   .   .   .   .   .   .   16
  5.4 Selected narratives over time . . .       .   .   .   .   .   .   .   .   .   .   .   .   .   .   .   .   .   .   .   .   .   .   .   .   .   .   .   .   .   .   18

6 YouTube                                                                                                                                                               19
  6.1 Top narratives . . . . . . . . . . . . . . . . . . . . . . . . . . .                                  .   .   .   .   .   .   .   .   .   .   .   .   .   .   .   19
  6.2 Most promoted YouTube channels . . . . . . . . . . . . . . .                                          .   .   .   .   .   .   .   .   .   .   .   .   .   .   .   19
  6.3 Most promoted YouTube videos . . . . . . . . . . . . . . . .                                          .   .   .   .   .   .   .   .   .   .   .   .   .   .   .   20
  6.4 Fraudulent electoral process and related YouTube channels                                             .   .   .   .   .   .   .   .   .   .   .   .   .   .   .   21
  6.5 Narrative network mapping . . . . . . . . . . . . . . . . . . .                                       .   .   .   .   .   .   .   .   .   .   .   .   .   .   .   22
  6.6 Selected narratives over time . . . . . . . . . . . . . . . . . .                                     .   .   .   .   .   .   .   .   .   .   .   .   .   .   .   26

7 Instagram                                                                                                                                                             27
  7.1 Top narratives . . . . . . . . . . . . .      .   .   .   .   .   .   .   .   .   .   .   .   .   .   .   .   .   .   .   .   .   .   .   .   .   .   .   .   .   27
  7.2 Most promoted Instagram accounts              .   .   .   .   .   .   .   .   .   .   .   .   .   .   .   .   .   .   .   .   .   .   .   .   .   .   .   .   .   28
  7.3 Most promoted Instagram posts . .             .   .   .   .   .   .   .   .   .   .   .   .   .   .   .   .   .   .   .   .   .   .   .   .   .   .   .   .   .   28
  7.4 Selected narratives over time . . . .         .   .   .   .   .   .   .   .   .   .   .   .   .   .   .   .   .   .   .   .   .   .   .   .   .   .   .   .   .   29

A Appendix                                                                                                32
  A.1 Scope . . . . . . . . . . . . . . . . . . . . . . . . . . . . . . . . . . . . . . . . . . . . . . . 32
  A.2 Labeling and visualization methodology . . . . . . . . . . . . . . . . . . . . . . . . . . 32
  A.3 Details on narratives . . . . . . . . . . . . . . . . . . . . . . . . . . . . . . . . . . . . . . 32

1 Context
On September 10, 2020, Twitter announced to expand their Civic Integrity Policy to protect their
platform from content that suppresses the vote or spreads misinformation related to the election.
The new enforcement of labeling or removal of content applied for “information or false claims
on how to participate in civic processes”, “content that could intimidate or suppress participation”
and “false affiliation”. On August 19, 2020 Facebook announced taking action against Facebook
Pages, Groups and Instagram accounts “tied to offline anarchist groups that support violent acts”.
This action corresponds to their policy of “dangerous individuals and organizations to address
organizations and movements that have demonstrated significant risks to public safety”. On that
day, Facebook removed over 790 groups, 100 Pages and 1,500 ads tied to QAnon from Facebook
and blocked over 300 hashtags across Facebook and Instagram.In January 2019, YouTube began
rolling out a new AI system to better identify borderline content and conspiracy theories.

However, during the four weeks prior to election day 2020, narratives related to QAnon, conspiracy
theories, Toxic narratives and Leaks significantly spread on Twitter related to Facebook, Instagram
and YouTube content. On some platforms, certain narratives stood out more than on other
platforms. This raises the question of a general platform specific signature and whether some
narratives feel more home on certain platforms than on other platforms.

  Figure 1: Percentage of referrals to Conspiracy theories, Leaks, QAnon and Toxic narratives while sharing Facebook,
                 Instagram and YouTube content on Twitter between October 3 and November 3, 2020.

Twitter is one of the major hubs for a number of social media networks. What people see on
Twitter is also being shaped by the content of other platforms. But not only the content matters
people see on Twitter. It also matters how the content is framed. Narrative mapping provides a
bird perspective on the general state of a platform - what kind of content do people see, which
platform has the biggest traffic volume on Twitter, what are the prevailing narratives and how
prevailing are they?

This report introduces our automated narrative detection in a cross-platform setting as one feature
of our technology. It maps selected narratives related to Facebook, Instagram and YouTube content
on Twitter during the four weeks leading up to election day. Although tweets do not necessarily
reflect the narratives of off-platform content one hundred percent, they do reflect how the content

US 2020 ELECTIONS - NARRATIVE MAPPING                                                                                   2
is framed. Furthermore, automated sharing features provide useful additional information about
titles and key phrases. Looking at cross-platform traffic on Twitter does not only help to better
understand (1) the accessibility of certain narratives during the weeks leading up to election day
on Twitter and (2) the cross-platform promotion of Facebook, Instagram and YouTube content.
It also provides insights into (3) the narratives people on Twitter referred to when they shared
content related to Facebook, Instagram and YouTube.

The following sections focus on the last four weeks leading up to election day 2020. Across
the country, tens of millions of people voted early and tens of millions of people who planned
to vote on election day, thought about who to vote for. This time was shaped by a number
of events: The president leaving the hospital after a COVID treatment on October 5, the vice
presidential debate on October 7, the New York Post reporting on October 14 about emails from
Joe Biden’s son Hunter Biden alleging Joe Biden shaped American foreign policy in the Ukraine
as Vice President to benefit his son, the cancelled second debate and two separated presidential
town halls on October 15 instead and the final second presidential debate on October 22. In this
political roller coaster, platforms played an important role in providing information to voters,
journalists, campaigners, political commentators, and people watching from around the world.

2 Executive summary
During the four weeks leading up to election day 2020, people on Twitter saw significant traffic
coming from Facebook, Instagram and YouTube pertaining to the US 2020 elections. The most
prevailing narrative related to Facebook, Instagram and YouTube related content was COVID-19.
Besides COVID-19, content mostly referred to Leaks, driven by YouTube related content, Toxic
narratives, driven by Facebook related content and Conspiracy theories, driven by YouTube related
content. QAnon associated issues were on a low level at that time. However, on that low level,
QAnon narratives were shared with YouTube content the most. Content related to Voter suppression
or a Fraudulent electoral process were on a low level, too. On this low level, Instagram had the
highest percentage of references to such issues.

In total numbers, people saw a lot of YouTube content on Twitter in the weeks before election
day. Overall, 68,540 YouTube referrals were shared in thirtyone days on Twitter pertaining to
the US 2020 elections. This number is high compared to the total number of Facebook referrals
(3,428) and Instagram referrals (1,324) in the same period of time. Almost half of the fifteen most
promoted YouTube channels on Twitter are run by conservative or highly partisan news media
such as Fox News, Right Side Broadcasting Network, One America News Network or The Next
News Network. YouTube content was mostly shared with references to Leaks, Toxic narratives
and Conspiracy theories which were the three most frequented narratives related to YouTube
content on Twitter in that time. While Leaks was mainly boosted by certain campaigns such
as the Hunter Biden allegations, Toxic narratives and Conspiracy theories were constant with
YouTube content in that time.

Facebook content was different. Unlike YouTube or Instagram content that mostly referred to
COVID-19, more than half of all Facebook referrals (52.72%) were shared with Toxic narratives.
This made Toxic narratives the number one narrative related to Facebook content and the US

US 2020 ELECTIONS - NARRATIVE MAPPING                                                            3
2020 elections in that time. The most promoted Facebook Pages were conservative or highly
partisan political commentators or news media such as Tomi Lahren, Tucker Carlson, Mark Levin,
Huckabee or Newsmax. While the most promoted Facebook Page was Donald J Trump with 1,181
referrals in that time, Facebook Pages run by the Democratic candidate Joe Biden or supporting
PACs were shared on a rather low level over time.

Instagram had the highest percentage of referrals to the black community, but also pushed the
narratives of Voter suppression and Fraudulent electoral process as well as Toxic narratives. One
third of the fifteen most promoted Instagram posts shared on Twitter referred to the campaign
trail of Donald Trump. The most visible account was the political advisor Richard Grenell whose
account created a total Instagram traffic on Twitter of 1,623 referrals. Compared to other Instagram
accounts in that time, this number is high.

The most popular content type was video. Videos and live streaming that previously premiered
on YouTube, Facebook or Instagram were key types of the total traffic coming from those platforms.
We identified four major types of live streaming in that time: (1) Live streaming or commentating
parades and flotillas (mostly coming from Facebook and Instagram), (2) live streaming of rallies,
speeches and public service announcements (mostly coming from YouTube), (3) live streaming
and commentating policy issues or breaking news situations (mostly coming from YouTube) and
(4) live streaming and commentating news media or social media posts (mostly coming from
YouTube).

Comparing 2020 narratives with the narratives the IRA used back in 2016 to interfere in the US
presidential elections, some narratives reappeared, some did not and some were altered. The
two most prominent narratives that made their reappearance were Leaks, QAnon and Black
Community.

Overall, Democratic candidates being targeted with allegations referring to Leaks have become
a constant theme in American presidential election cycles. The same applies to accusations of
pedophilia and sexual scandals against both Democratic as well as Republican candidates.

One of the most surprising findings is that Sensitive content was remarkably present related
to traffic coming from Facebook, YouTube and Instagram, assuming that those platforms have
systems in place to prevent such content from being amplified or promoted. Sensitive content
includes references to sexual suggestive content, content that glorifies violence, issues related to
child safety or references to genocide or massacres. The highest percentage of Sensitive content
was related to YouTube content. They made 5.67% of all YouTube referrals in that time.

3 Narrative landscape
We analyzed 73,292 tweets related to Facebook, Instagram and YouTube related to the US 2020
elections in the time between October 3 and October 2020. In that time, YouTube had the highest
traffic volume on Twitter with 68,540 referrals. This number is high. YouTube was followed by
Facebook with 3,428 referrals and Instagram with 1,324 referrals.

US 2020 ELECTIONS - NARRATIVE MAPPING                                                             4
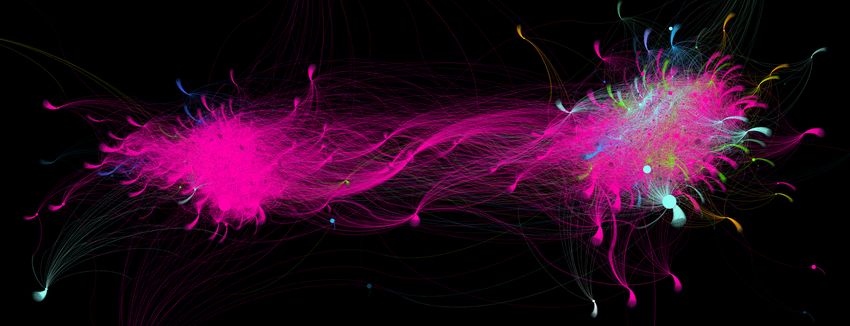
Figure 2: Total traffic referring to narratives and the US 2020 elections while sharing Facebook, Instagram and YouTube
                                content on Twitter between October 3 and November 3, 2020.

On a more granular level, most tweets related to YouTube content and to the US 2020 elections
referred to Leaks with 14,534 referrals. Compared to Facebook with 193 referrals to Leaks and
Instagram with 134 referrals to Leaks, this number is high. Leaks is followed by Toxic narratives
with 7,131 referrals, Conspiracy theories with 4,640 referrals and QAnon with 3,113 referrals.
Since the total numbers of referrals show such a significant span, the following sections mostly
display the percentage of referrals to this platform rather than the total numbers.

 Figure 3: Total traffic referring to the US 2020 elections, Conspiracy theories, Leaks, QAnon and Toxic narratives while
       sharing Facebook, Instagram and YouTube content on Twitter between October 3 and November 3, 2020.

The most popular narrative people referred to on Twitter while they shared off-platform content
related to the US 2020 elections in the four weeks prior to election day was COVID-19 by far. In

US 2020 ELECTIONS - NARRATIVE MAPPING                                                                                       5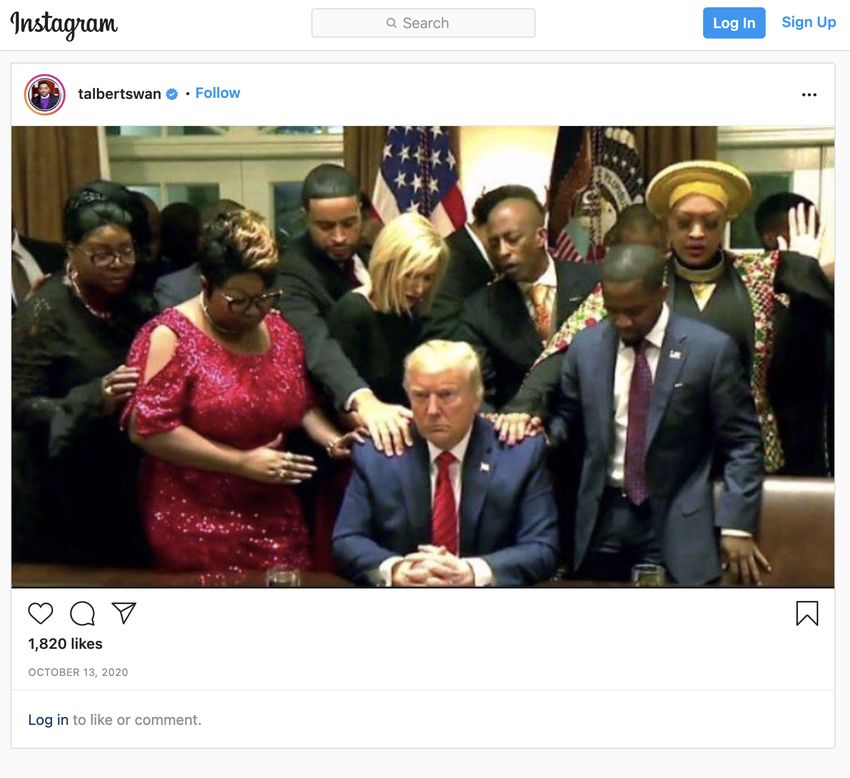
part, this traffic volume was related to the former president who tested positive for the coronavirus
on October 2, 2020 and was released from hospital on October 5.

With 29,145 referrals in total, the highest percentage of COVID-19 tweets pertaining to the US
2020 elections were Instagram related (48.11%), followed by YouTube (40.32%) and Facebook
(25.5%). COVID-19 was the number one narrative of all off-platform traffic on Twitter at that
time, except Facebook.

   Figure 4: Percentage of referrals to the US 2020 elections and COVID-19 while sharing Facebook, Instagram and
                       YouTube content on Twitter between October 3 and November 3, 2020.

Covid-19 (#1) was followed by Leaks (#2) with 14,861 total referrals to all of the three platforms.
Most referrals were related to YouTube content (learn more about traffic related to Leaks). Leaks
was followed by Toxic narratives (#3) with 9,010 referrals. This narrative was significantly boosted
by Facebook traffic (learn more about traffic related to Toxic Narratives). Conspiracy theories
(#4) with 4,769 referrals, Civil unrest 2020 (#5) with 4,649 referrals, Sensitive content (#6) with
4,030 referrals and QAnon (#7) with 3,215 referrals were on a medium level of traffic volume.
Black community (#8) with 1,553 referrals, Fraudulent electoral process (#9) with 784 referrals
and Climate change (#10) with 363 referrals were on a low level.

 Figure 5: Top 10 narratives related to Facebook, Instagram and YouTube content shared on Twitter between October 3
                                                 and Novemebr 3, 2020.

US 2020 ELECTIONS - NARRATIVE MAPPING                                                                              6
4 Narratives
4.1 Toxic Narratives
The results of the US 2020 presidential election reflect a deeply divided country. A margin of less
than 10 million votes decided the election (Joe Biden (D): 81,283,361 votes, Donald Trump (R):
74,222,960 votes). The division was not hard to spot on the platforms in the weeks leading up to
election day. For some people, the atmosphere on the platforms may not have been helpful to
support mutual understanding and for respecting other perspectives or different points of views.

 Figure 6: Percentage of referrals to the US 2020 elections and Toxic narratives while sharing Facebook, Instagram and
                        YouTube content on Twitter between October 3 and November 3, 2020.

In the four weeks leading up to election day, Toxic narratives spread on the platforms accusing
the other side of treason, bribery, political scandals being corrupt or to lie. Overall, more than half
of all Facebook-related tweets referred to toxic narratives (52.72%), followed by YouTube (10.40%)
and Instagram (8.01%). Toxic narratives were the most dominant narrative related to Facebook
content during the four weeks before election day.

        (a) Tweet referring to the US 2020 elections and Toxic     (b) Tweet referring to the US 2020 elections and Toxic
       narratives while sharing Facebook content (unavailable).   narratives while sharing YouTube content (unavailable).

US 2020 ELECTIONS - NARRATIVE MAPPING                                                                                       7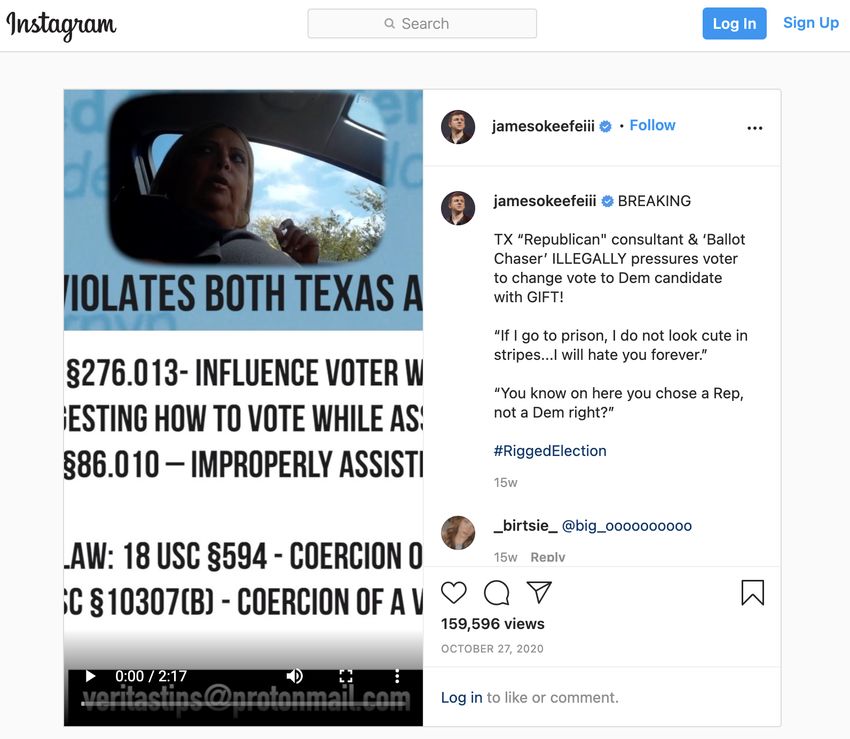
Figure 8: Tweet referring to the US 2020 elections and Toxic narratives while sharing Instagram content.

4.2 Leaks
Leaks are a standard instrument in the playbook of political opponents as well as of foreign
state-actors to shape public opinion about a candidate or a political party in the weeks before
a general election.1 It was one of the major techniques the foreign state-actor used the foreign to
interfere in the US 2016 elections.

  Figure 9: Percentage of referrals to the US 2020 elections and Leaks while sharing Facebook, Instagram and YouTube
                              content on Twitter between October 3 and November 3, 2020.

Overall, YouTube showed the highest percentage of referrals to Leaks with 21.21%, followed by
Instagram with 10.12% and Facebook with 5.63%.

Leaks mostly referred to two events between October 3 and November 3, 2020. One, the allegation
against Joe and Hunter Biden that was reported by the New York Post on October 14. The New
York Post referred to emails that have been recovered from a hard drive of Joe Biden’s son allegedly
proving that Joe Biden shaped American foreign policy in the Ukraine as Vice President to benefit
his son. The second major micro-narrative related to Leaks in this time was about Hillary Clinton’s
emails that have been the major subject in 2016. This issue came up after former Secretary of
State Mike Pompeo accounted to release her 2016 emails in mid-October 2020. 2
   1 Learn more about Hack-and-Leaks tactics in our White Paper Information Threats.
   2 Learn more about Leaks in 2020 and other narratives used by the IRA in 2016 in the section Narratives used by the
IRA in 2016.

US 2020 ELECTIONS - NARRATIVE MAPPING                                                                                  8
(a) Tweet referring to the US 2020 elections and Leaks while (b) Tweet referring to the US 2020 elections and Leaks while sharing
sharing Instagram content. Facebook content (unavailable).
(c) Tweet referring to the US 2020 elections and Leaks while
sharing YouTube content.
4.3 Sensitive Content
The highest percentage of Sensitive content was related to YouTube content with 5.67% of all
YouTube referrals in that time, followed by Instagram with 4.83% and Facebook with 2.33%. Although
those numbers are low compared to other narratives, those numbers are stark when taking into
consideration that each platform has their detection systems in place for such issues.
Figure 11: Percentage of referrals to the US 2020 elections and Sensitive content while sharing Facebook, Instagram and
YouTube content on Twitter between October 3 and November 3, 2020.
US 2020 ELECTIONS - NARRATIVE MAPPING 9Sensitive content includes sexual suggestive content, content that glorifies violence as well as
references to genocide and massacres. Related to the US 2020 elections and Facebook, Twitter
and YouTube in the weeks before election day, 4,030 tweets referred to this narrative in total.
Other than Leaks, Sensitive content is mostly driven by unrelated micro-narratives spread over
time that do not show significant coordinated behavior.
(a) Tweet referring to the US 2020 elections and Sensitive (b) Tweet referring to the US 2020 elections and Sensitive content
content while sharing Instagram content (unavailable). while sharing YouTube content (unavailable).
4.4 Conspiracy Theories and QAnon
QAnon is a conspiracy theory about a global elite, the cabal or deep state, that infiltrates and
controls governments and the financial industry all over the world and runs a pedophil network
of child trafficking. This conspiracy theory took off in 2016 with leaked emails of Hillary Clinton
(D) allegedly proving her connections to a child trafficking ring that operated in a Washington
D.C. Pizzaria.3 Since QAnon supporters look at Donald Trump as the person who will lead the
new civil war against the deep state with the help of the QArmy, QAnon evolved significantly and
became popular to a border audience in the past four years.
Figure 13: Percentage of referrals to the US 2020 elections, Conspiracy theories and QAnon while sharing Facebook,
Instagram and YouTube content on Twitter between October 3 and November 3, 2020.
3 Learn more about this narrative being used by foreign state actor in 2016 and the tactics of this influence operation
on social media platforms.
US 2020 ELECTIONS - NARRATIVE MAPPING 10Connected to QAnon are claims such as “take back our country”, “save America”, “1776” and “save
our children”. Some QAnon micro-narratives also overlap with narratives associated with White
Supremacy, the Boogaloo movement and the Proud Boys. Many of those claims were seen on the
“Save America March” and during the deadly storming of the Capitol on January 6, 2021.
In the four weeks leading up to election day 2020, QAnon-associated content was on a relatively
low level compared to other times in this election cycle. QAnon was mostly shared related to
YouTube content with 4.54% and Instagram content with 2.79%.
Other conspiracy theories related to Bill Gates, Barack Obama, Hillary Clinton, Julian Assange,
George Soros, the Illuminati, Nancy Pelosi, Satan, 5G and COVID19 and Antifa were mostly shared
related to YouTube content with 6.77%, followed by Instagram content with 4.53% and Facebook
content with 2.01%.
(a) Tweet referring to the US 2020 elections and Conspiracy theories while (b) Tweet referring to the US 2020 elections and Conspiracy
sharing Facebook content (unavailable). theories while sharing Facebook content (unavailable).
(c) Tweet referring to the US 2020 elections and Conspiracy
theories while sharing YouTube content.
US 2020 ELECTIONS - NARRATIVE MAPPING 114.5 Voter Suppression and Fraudulent Electoral Process
Voter suppression and false claims of a fraudulent electoral process were two of the many scenarios,
federal and state government officials were concerned about. Unlike in 2016, voter suppression
and claims of a fraudulent electoral process was not significantly conducted by a foreign state
actor in 2020, but by the US president himself.
Figure 15: Percentage of referrals to the US 2020 elections, Voter suppression and Fraudulent electoral process while
sharing Facebook, Instagram and YouTube content on Twitter between October 3 and November 3, 2020.
Overall, in the past four weeks leading up to election day, claims of a fraudulent electoral process
and voter suppression were generally very low compared to other times in this election cycle.
However, the highest percentage of Fraudulent electoral process was related to Instagram content
with 1.36%, followed by YouTube with 1.08% and Facebook with 0.82%. Voter suppression was
mostly shared with Instagram content with 0.3%, followed by YouTube with 0.25% and Facebook
with 0.12%.
(a) Tweet referring to the US 2020 elections and Fraudulent electoral (b) Tweet referring to the US 2020 elections and Fraudulent
process while sharing Instagram content. electoral process while sharing YouTube content.
US 2020 ELECTIONS - NARRATIVE MAPPING 124.6 Narratives of 2020
In 2020, the five major topics were the global pandemic caused by the coronavirus (1) COVID-19,
(2) the death of the African-American George Floyd after being handcuffed and pinned to the
ground by a police officer in Minneapolis on May 25, (3) the protests following the death of
George Floyd, against police brutality and systemic racism in America, (4) the black lives matter
movement and (5) the US Census 2020. Those narratives were also reflected on social media
networks between October 3 and November 3, 2020.
During the four weeks leading up to election day, COVID-19 was the most frequented narrative
with 29,145 total referrals to Facebook, Instagram and YouTube. The highest percentage of COVID-19
tweets had Instagram. Overall, 48.11% Instagram related tweets referred to COVID-19. Instagram
is followed by YouTube with 40.32% and Facebook with 25.5%.
COVID-19 (#1) was followed by Civil unrest 2020 (#2) with 4,649 referrals in total and most shares
related to Facebook content with 25.55 %, followed by Instagram with 8.91% and YouTube with
6.28%. Black community (#3) had 1,553 referrals in total and was mostly shared with Instagram
content (8.38%), followed by Faacebook with 2.07% and YouTube with 2%. The narratives of
George Floyd with 341 total referrals as well as Census 2020 with 18 total referrals made less than
1% of total referrals to the platforms.
Figure 17: Percentage of referrals to the US 2020 elections and to major issues of 2020 while sharing Facebook,
Instagram and YouTube content on Twitter between October 3 and November 3, 2020.
4.7 Narratives used by the IRA in 2016
In 2016, the state-backed Internet Research Agency (IRA) used and amplified several narratives
on social media platforms to target specific audiences and to influence the US 2016 presidential
election.4 In 2020, some of those narratives debuted, some did not. However, sexual behavior
towards minors and allegations of pedophelia was a common theme across narratives in 2016 as
well as in 2020. The following stats show the 2020 amplification of selected narratives the IRA
used back in 2016.
4 DiResta, R., Shaffer, K., Ruppel, B., Sullivan, D., Matney, R., Fox, R., Johnson, B. (2018): The Tactics & Tropes of the
Internet Research Agency. URL: https://cdn2.hubspot.net/hubfs/4326998/ira-report-rebrand_FinalJ14.pdf (February
2021)
US 2020 ELECTIONS - NARRATIVE MAPPING 13The most frequented narrative that reappeared in 2020 was Leaks. While in 2016, the IRA used
documents retrieved from a hacking attack on the Democratic National Committee (DNC) and
the servers of the Clinton campaign, 2020 Leaks mostly referred to alleged recovered emails from
Hunter Biden, which allegedly proved that Vice President Joe Biden shaped American foreign
policy in the Ukraine to benefit his son. But even Hillary Clinton’s emails reappeared in 2020. This
micro-narrative came up when former Secretary of State, Mike Pompeo, announced to release
her emails in mid-October 2020. In both years, Leaks were used to target the Democratic candidate
(Hillary Clinton in 2016, Joe Biden in 2020). In the four weeks leading up to election day 2020,
Leaks was mostly shared related to YouTube content with 21.21%, followed by Instagram with
10.12% and Facebook with 5.63%.
Figure 18: Percentage of referrals to the US 2020 elections and to narratives used by the IRA back in 2016 to interfere in
the presidential election while sharing Facebook, Instagram and YouTube content on Twitter between October 3 and
November 3, 2020.
The second most frequented 2016 narrative that reappeared in 2020 was Black community. While
the target audience looks similar, the micro-narratives were different in both years. In 2016,
the IRA targeted mostly religious members and leaders of the black community. In 2020, the
narrative was shaped by the black lives matter movement and issues about systemic racism in
America and police brutality in the aftermath of George Floyd’s death. In the four weeks leading
up to election day, Black Community was mostly shared related to Instagram content with 8.38%,
followed by Facebook with 2.07% and YouTube with 2%.
The third narrative the IRA used in 2016 and that reappeared in 2020 was QAnon. QAnon took
off in 2016 with a conspiracy theory about Hillary Clinton who allegedly ran a child trafficking
ring for the pedophile deep state (pizzagate). QAnon supporters look at Donald Trump as the
person who “drain the swamp” of Washington D.C. and will lead “the war” against the cabal. With
Donald Trump in office, the QAnon narrative evolved in the past years and became mainstream
in America. The Boogaloo movement that started in late 2019 and the Proud Boys who are
associated with the insurrection on January 6, 2021 share a significant number of the QAnon
micro-narratives. In the four weeks leading up to election day 2020, QAnon was mostly shared
related to YouTube content with 4.54%, followed by Instagram with 2.79% and Facebook with
1.90%.
US 2020 ELECTIONS - NARRATIVE MAPPING 14Although there have been new micro-narratives to certain 2016 narratives such as Secession,
other narratives used by the IRA in 2016 created only a low traffic volume with under 0.1% in the
four weeks leading up to election day 2020. This applies for example to Confederation/Southern
culture, Secession, Islamization, Gun Rights, Voter suppression and Distrust in the media.
5 Facebook
5.1 Top narratives
With 46%, Toxic Narratives was the most frequented narrative related to Facebook content of
all tweets referring to narratives and the US 2020 elections during the four weeks leading up to
election day. This number is high. Facebook is the only platform compared to Instagram and
YouTube that received more traffic from Twitter related to a narrative other than COVID-19. Toxic
Narratives is followed by COVID-19 with 22.7%, Leaks with 9.3%, Civil unrest 2020 with 6.7% and
Sensitive content with 3.7%. Less than 3% were related to Conspiracy theories and QAnon.
Figure 19: Top 10 narratives related to Facebook content on Twitter referring to the US 2020 elections between October 3
and November 3, 2020.
Figure 20: Narratives related to Facebook content on Twitter referring to the US 2020 elections between October 3 and
November 3, 2020.
US 2020 ELECTIONS - NARRATIVE MAPPING 155.2 Most promoted Facebook Pages
Donald J Trump was the most promoted Facebook Page during the four weeks prior to election
day with 1,504 referrals. The former president was followed by Mark Levin, the host of the conservative
radio talk show “The Mark Levin Show” on Westwood One with 1,414 referrals and Tomi Lahren,
a political commentator and host on Fox Nation with 490 referrals.
Of all promoted Facebook Pages in that time, three Fox News-related Facebook Pages are in the
#15: Tomi Lahren (#3), Fox News (#7), Tucker Carlson Tonight (#9). The Facebook Page Huckabee,
formerly on Fox News, is #15 of all off-platform promoted Facebook Pages. Facebook Pages of the
Democratic candidate Joe Biden, Biden-supporting super PACs or other than conservative news
networks have less than 100 referrals in that time. More than 550 highly promoted Facebook
referrals were unavailable as of February 2021.
No. Page Referrals
1 Donald J Trump 1,504
2 Mark Levin 1,414
3 Tomi Lahren 490
4 Bedros Keuilian 339
5 Marian Kamensky 243
6 Michael Moore 168
7 Fox News 154
8 Todd Coconato 153
9 Tucker Carlson Tonight 133
10 Guy Verhofstadt 132
11 Anna Terez Weinbaum Parrish 126
12 LEXIT 124
13 Oscar El Blue 112
14 Newsmax 105
15 Huckabee 100
Table 1: Most promoted Facebook Pages on Twitter pertaining to the US 2020 elections and the number of referrals
between October 3 and November 3, 2020.
5.3 Most promoted Facebook content
The three most promoted Facebook posts on Twitter were claims by Donald Trump about media
bias "Look at the bias, hatred and rudeness on behalf of 60 Minutes and CBS. Tonight’s anchor,
Kristen Welker, is far worse!" with 1,181 referrals between October 3 and November 3, 2020.
Second and third most promoted posts were by Mark Levin about an alleged sex scandal of
President Joe Biden ("THE BIDEN SEX SCANDAL NOBODY IS TALKING ABOUT. JOIN US FOR A
BRAND NEW LEVIN TV TONIGHT") with 807 referrals and a post questioning Russia’s involvement
in the alleged Hunter Biden leaks "There is ZERO evidence of Russia’s involvement in the Biden
lab top [!sic] scandal..." with 578 referrals.
Twelve of the fifteen posts were in favor to the former president, while three Posts were against
him or in favor to President Joe Biden such as the post by the documentary filmmaker Michael
Moore (#5), the former Prime Minister of Belgium, Guy Verhofstadt (#10) or by MeidasTouch
US 2020 ELECTIONS - NARRATIVE MAPPING 16(#14), a PAC that was founded to stop the reelection of Donald Trump.
Overall, most of the promoted Facebook posts were about rallies, alleged scandals related to Joe
Biden, the Mexican border and claims about biased news media reporting about Donald Trump.
Other issues mentioned in promoted Facebook posts were fracking, social security and child
trafficking. Many promoted posts were videos or live streams.
No. Page Post Referrals
1 Donald J Trump Look at the bias, hatred and rudeness on behalf of 60 1,181
Minutes and CBS. Tonight’s anchor, Kristen Welker, is
far worse!
2 Mark Levin THE BIDEN SEX SCANDAL NOBODY IS TALKING 807
ABOUT. JOIN US FOR A BRAND NEW LEVIN TV
TONIGHT.
3 Mark Levin There is ZERO evidence of Russia’s involvement in the 578
Biden lab top scandal....
4 Tomi Lahren Rapper and mogul 50 Cent tells his 26.2 MILLION 303
instagram followers, Vote Trump!
5 Michael Moore So Now Trump Has Earned Your Trust? A Note of 161
Covid Caution from Michael Moore
6 Todd Coconato Live from Trump Tower in New York City! 153
7 Anna Terez Weinbaum Downtown Vacaville right now! Soooo many Patriots 126
Parrish are here!! #Trump2020
8 Tomi Lahren California unveils a new set of bogus rules for holiday 124
gatherings.
9 Fox News Former Hunter Biden associate Tony Bobulinski 122
makes a statement ahead of the final presidential
debate. President Trump is expected to bring
Bobulinski as his guest to the debate.
10 Guy Verhofstadt Why for the EU too, it has to be Biden ! 112
11 LEXIT Massive Trump rally at Nigeria, Africa 84
12 Huckabee Joe Biden FINALLY gets fact checked, even NPR called 74
him out.
13 Wysiwyg Tv LIVE in Beverly Hills Sat. Oct. 10th 2020 Trump Rally 65
and counter
14 MeidasTouch It’s time to vote out the #TrumpCrimeFamily 56
15 Oscar El Blue Don’t lie Joe Biden, this is the truth about child 51
trafficking in the Mexican borders
Table 2: Most promoted Facebook Posts on Twitter pertaining to the US 2020 elections and the number of referrals
between October 3 and November 3, 2020.
US 2020 ELECTIONS - NARRATIVE MAPPING 175.4 Selected narratives over time
Figure 21: Narratives related to Facebook content on Twitter over time while referring to the US 2020 elections between
October 3 and November 3, 2020.
Looking at the amplification of narratives related to Facebook content over time, some narratives
showed a constant amplitude of amplification while other narratives had peaks. One of those
narratives was Toxic narratives (color: flamingo) that were boosted on three different days during
the four weeks leading up to election day: October 7, October 19 and October 20. On October 7,
the day of the Vice Presidential Debate with Kamala Harris (D) and Mike Pence (R), Mark Levin
posted about an alleged sex scandal of Joe Biden (#2 Facebook Post). The peaks on October 19
and October 20 were also related to Mark Levin. In his Facebook Post, he questioned Russia’s
involvement in the Hunter Biden allegations (#3 Facebook Post). Overall, tweets referring to
Toxic narratives related to Facebook content increased until October 19 and slowly decreased
until election day.
Most tweets referring to COVID-19, the US 2020 elections and Facebook content (color: green)
were posted on October 3. On this day, Michael Moore (#5 Facebook Post) shared his thoughts
about Donald Trump and his COVID-19 response. Referrals to the narrative QAnon (color: rose)
increased on a lower level after the Second Presidential Debate as well as the narrative Climate
change (color: purple) after President Biden announced a transition away from the oil industry
to renewable sources of energy.
Facebook content related to Black community (color: light green), Civil unrest 2020 (color: yellow)
and Leaks (color. gray) had a one-day peak. While the peaks related to Black community and
Civil unrest 2020 on October 6 mostly referred to a Facebook video by The Daily Caller, the
peak related to Leaks on October 30 is mostly caused by traffic of the account @stilbow3 which
was suspended as of February 2021: “https://t.co/YinseKg1gi Tell the world, the truth about the
Biden’s. It’s horrific and all true! #WalkAway #NeverBiden https://facebook.com/100000357800526
/posts/3669879933033897/?d=n”.
US 2020 ELECTIONS - NARRATIVE MAPPING 186 YouTube
6.1 Top narratives
COVID-19 was the most frequented narrative related to YouTube content with 40.3% of all YouTube
referrals in that time, followed by Leaks with 21.2%. This number is high. YouTube has the highest
percentage of referrals related to Leaks compared to Facebook with 5.63% and Instagram with
10.12%. Leaks is followed by Toxic narratives with 10.4%, Conspiracy theories with 6.8%, Civil
unrest with 6.3% and Sensitive content with 5.7%. Of all YouTube referrals, 4.5% were related to
QAnon.
Figure 22: Top 10 narratives related to YouTube content on Twitter referring to the US 2020 elections between October 3
and November 3, 2020.
Figure 23: Narratives related to YouTube content on Twitter referring to the US 2020 elections between October 3 and
November 3, 2020.
6.2 Most promoted YouTube channels
The conservative news network Fox News was the most promoted YouTube channel during the
four weeks four weeks prior to election day with 34,552 referrals. Fox News is followed by Right
Side Broadcasting Network with 32,218 referrals and Donald J Trump with 28,235 referrals.
US 2020 ELECTIONS - NARRATIVE MAPPING 19Of all fifteen most promoted YouTube channels in that time, almost half of them (46.6%) are run
by conservative or highly partisan news media or news networks such as Fox News (#1), Right
Side Broadcasting Network (#2), One America News Network (#5), The Next News Network (#6),
Sky News Australia (#7), Fox Business (#8) and BlazeTV (#14). Two of the #15 most promoted
YouTube channels are center or left leaning news media such as MSNBC (#9) or CNN (#10).
Overall, the channel of the Republican candidate Donald Trump had 19,085 more referrals on
Twitter than the Democratic candidate Joe Biden in the same period of time.
No. Channel Referrals
1 Fox News 34,552
2 Right Side Broadcasting Network 32,218
3 Donald J Trump 28,235
4 Rudy W. Giuliani 23,360
5 One America News Network 18,438
6 The Next News Network 16,124
7 Sky News Australia 14,593
8 Fox Business 14,149
9 MSNBC 11,401
10 CNN 11,116
11 GOP War Room 10,435
12 Bedros Keuilian 10,118
13 Joe Biden 9,150
14 BlazeTV 8,730
15 Timcast 8,104
Table 3: Most promoted YouTube channels and the number of referrals on Twitter referring to the US 2020 elections
between October 3 and November 3, 2020.
6.3 Most promoted YouTube videos
The most promoted YouTube video in the four weeks leading up to election day premiered on
the channel Rudy W. Giuliani (more than 570,000 subscribers) about alleged federal crimes and
the Hunter Biden allegations with 11,772 referrals. This video is followed by a video premiered
on the channel Bedros Keuilian (more than 170,000 subscribers) why he decided to vote for
Donald Trump with 10,118 referrals and a video by The Next News Network (more than 2 million
subscribers) about the Hunter Biden allegations with 9,224 referrals. This video has become
unavailable.
Eleven of the fifteen most promoted YouTube videos were either reporting or fueling alleged
scandals and conspiracy theories about Joe Biden or his family, claiming crimes, bribery and
ties to a foreign government. This is more than 73% of the #15 most promoted YouTube videos.
Five of those videos particularly referred to the Hunter Biden allegations (#1, #7-#10) creating
total traffic of more than 26,000 YouTube referrals in that time.
US 2020 ELECTIONS - NARRATIVE MAPPING 20No. Video name Channel Referrals
1 Federal Crimes Uncovered In Biden Hard Drive | Rudy Rudy W. Giuliani 11,772
Giuliani | Ep. 78
2 I was voting for Biden but this changed my mind to Trump Bedros Keuilian 10,118
3 BREAKING: Whistleblower Drops HARD Evidence, Biden, The Next News Network 9,224
Obama, Hillary EXECUTED Seal Team 6, Audio Proof
4 Trump calls for Biden, Obama to be indicted in ’greatest Fox Business 4,945
political crime in history’
5 Joe Biden Partnered With Chinese COMMUNISTS For Rudy W. Giuliani 4,824
$30M | Rudy Giuliani | Ep. 81
6 Report From The Field: Michigan Swing Districts Still Love The Federalist 3,965
Trump
7 EXCLUSIVE: Joe Biden’s son emailed shop owner about Sky News Australia 3,687
hard drive to "get it back": Former Trump chief
8 Tony Bobulinski held presser claiming Joe Biden knew Fox News 3,640
about Hunter’s business deals
9 Tucker exclusive: Tony Bobulinski, ex-Hunter Biden Fox News 3,594
associate, speaks out on Joe Biden
10 Hunter Biden associate reveals dealings with Russian One America News 3,325
oligarch Network
11 The BIDEN CRIME FAMILY’S Payoff Scheme | Rudy Rudy W. Giuliani 2,917
Giuliani’s EXCLUSIVE Reaction
12 BRUTAL: Resurfaced Video of Joe Biden Should Destroy His Dinesh D’Souza 2,764
Campaign
13 Trump 2020 A Man vs. A Movement American Greatness 2,345
14 RIDING THE DRAGON: The Bidens’ Chinese Secrets (Full BlazeTV 2,319
Documentary)
15 UNCOVERED: How Joe Biden Got Millions In Foreign Rudy W. Giuliani 2,304
Bribes | Rudy Giuliani | Ep. 80
Table 4: Most promoted YouTube videos and the number of referrals on Twitter referring to the US 2020 elections
between October 3 and November 3, 2020.
6.4 Fraudulent electoral process and related YouTube channels
The number of referrals to the narrative Fraudulent electoral process related to YouTube videos
during the four weeks prior to election day was mostly driven by one channel with 4,230 video
shares. This channel is run by the conservative activist organization Project Veritas. This number
is high.
The most promoted YouTube video by Project Veritas in that time was “RIGGED ELECTION: TX
’Ballot Chaser’ Illegally Pressures Voters To Change Votes; ‘I could go to jail’" with 2,153 referrals,
followed by “Ballot Chaser Reveals MASSIVE Vote Fraud Effort To Elect Joe Biden; ‘$55,000 for
5,000 votes’" with 1,608 referrals and “Project Veritas #RiggedElection Investigation Takes Over
Texas News Cycle” with 361 referrals.
US 2020 ELECTIONS - NARRATIVE MAPPING 21No. Channel Referrals
1 Project Veritas 4,230
2 Tim Pool 470
3 Donald J Trump 230
4 Timcast 162
5 Spitting Image 101
6 Lucas Warren 77
7 GOP War Room 75
8 John Talks 58
9 BlazeTV 56
10 Jimmy Kimmel Live 44
11 MR. OBVIOUS 44
12 Trump War Room 35
13 The Next News Network 34
14 NowThis News 28
15 TYT Investigates 24
Table 5: Most promoted YouTube channels related to the narrative Fraudulent electoral process and the number of
referrals on Twitter referring to the US 2020 elections between October 3 and November 3, 2020.
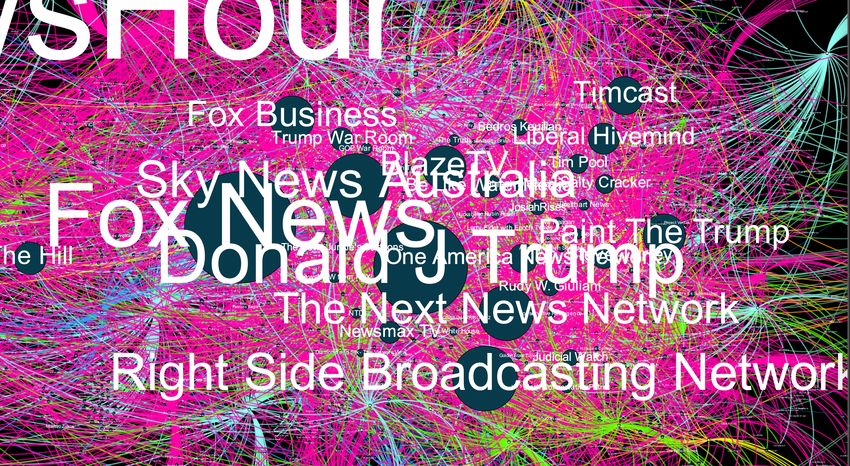
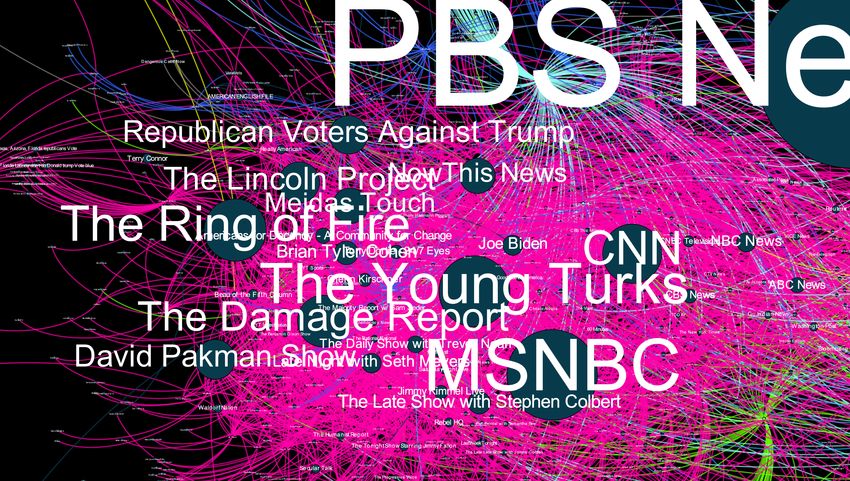
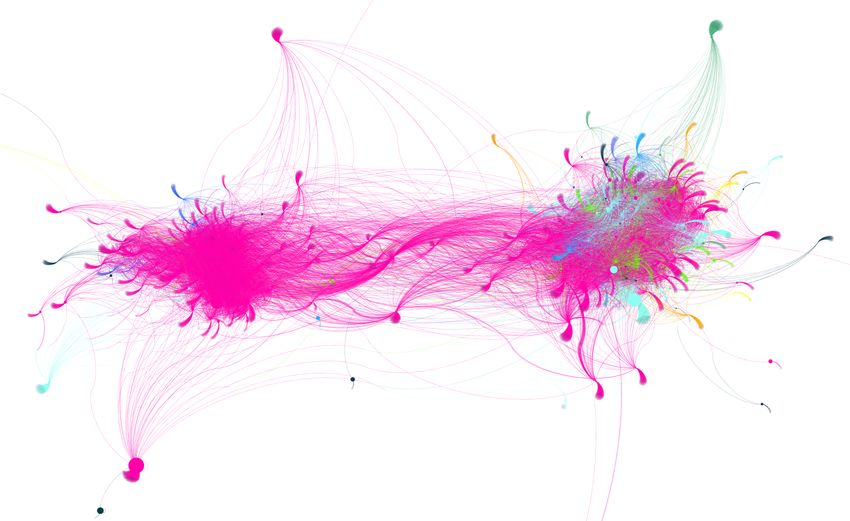
6.5 Narrative network mapping
Figure 24: Network graph of the 300 most active Twitter accounts and the YouTube videos they have shared while
referring to the US 2020 elections in the time between October 3 and November 3, 2020.Nodes represent Twitter
accounts and YouTube videos. They are colored according to the hashtags they referred to when they shared the
YouTube video. The sizes of the nodes reflect the number of referrals to YouTube videos.
Visualizing the relationship between Twitter accounts and YouTube videos, measured by retweets,
favs, quotes and replies and the content they have shared, shows a deeply polarized network.
This network is divided into two clusters: One cluster is formed by accounts mostly referring to
Joe Biden’s campaign (color: blue), policy issues (color: yellow), democratic processes (color:
purple) on the left side. The other cluster is formed by accounts mostly referring to Donald
Trump’s campaign (color: red), battleground states (color: green) and Conspiracy theories (color:
orange) on the right side (Learn more about this network graph in our report “US 2020 elections
- Mapping a divided country”).
US 2020 ELECTIONS - NARRATIVE MAPPING 22The polarization is also reflected in the narratives the accounts referred to when they shared a
YouTube video. The left cluster mostly shared YouTube videos related to the narrative COVID-19
(color: pink). The right cluster also shared YouTube videos related Toxic narratives (color: cyan),
Leaks (color: neon green), QAnon (color: blue), Fraudulent electoral process (color: violet) or
Conspiracy theories (color: orange).
Figure 25: Network graph of the 300 most active Twitter accounts and the YouTube videos they have shared while
referring to the US 2020 elections in the time between October 3 and November 3, 2020.Nodes represent Twitter
accounts and YouTube videos. They are colored according to the narratives they referred to when they shared the
YouTube video. The sizes of the nodes reflect the number of referrals to YouTube videos.
COVID-19 Toxic narratives Leaks Civil unrest 2020 Black community Conspiracy
theories
QAnon Sensitive content Fraudulent Voter suppression Distrust in the Gun rights
electoral process media
Table 6: Narratives and their colors.
Furthermore, the network graph shows how many YouTube videos the accounts shared. For
example, one of the most active accounts during the four weeks leading up to election day was
@DACisneros1. The account shared 2,421 YouTube referrals and 775 unique YouTube videos
related to Toxic narratives in that time. This account has been suspended.
US 2020 ELECTIONS - NARRATIVE MAPPING 23Figure 26: Right side of the network graph of the 300 most active Twitter accounts and the YouTube videos they have
shared while referring to the US 2020 elections in the time between October 3 and November 3, 2020.Nodes represent
Twitter accounts and YouTube videos. They are colored according to the narratives they referred to when they shared the
YouTube video. The sizes of the nodes reflect the number of referrals to YouTube videos.
Visualizing the relationship between Twitter accounts and YouTube channels, the network shows
a similar polarized structure. The YouTube channels on the left side are mostly connected to the
narrative COVID-19 (color: pink). The channels on the right side are also connected to other
narratives such as Toxic narratives (color: cyan), Leaks (color: neon green), QAnon (color: blue),
Fraudulent electoral process (color: violet) or Conspiracy theories (color: orange).
Figure 27: Network graph of the 300 most active Twitter accounts and the YouTube channels they have shared videos of
while referring to the US 2020 elections in the time between October 3 and November 3, 2020.Nodes represent Twitter
accounts and YouTube channels. They are colored according to the narratives they referred to when they shared a
YouTube video. The sizes of the nodes reflect the number of referrals to YouTube channels.
US 2020 ELECTIONS - NARRATIVE MAPPING 24Figure 28: Left side of the network graph of the 300 most active Twitter accounts and the YouTube channels they have
shared videos of while referring to the US 2020 elections in the time between October 3 and November 3, 2020.Nodes
represent Twitter accounts and YouTube channels. They are colored according to the narratives they referred to when
they shared a YouTube video. The sizes of the nodes reflect the number of referrals to YouTube channels.
Figure 29: Right side of the network graph of the 300 most active Twitter accounts and the YouTube channels they have
shared videos of while referring to the US 2020 elections in the time between October 3 and November 3, 2020.Nodes
represent Twitter accounts and YouTube channels. They are colored according to the narratives they referred to when
they shared a YouTube video. The sizes of the nodes reflect the number of referrals to YouTube channels.
US 2020 ELECTIONS - NARRATIVE MAPPING 256.6 Selected narratives over time
Figure 30: Narratives related to YouTube content on Twitter over time while referring to the US 2020 elections between
October 3 and November 3, 2020.
Looking at the amplification of narratives related to YouTube content over time, Toxic narratives
(color: flamingo) were constantly shared with YouTube content about 20% each day between
October 19 and October 26. The narrative peaked on the day after the second presidential debate,
October 23.
When people shared YouTube content on Twitter, most of them referred to issues associated with
COVID-19 (color: green). The major peak during the four weeks prior to election day was on
October 3 and decreased until October 14.
Two narratives had a one-day peak: Leaks (color: gray) and Fraudulent electoral process (color:
purple). The peak of Leaks on October 13 was mostly caused by a conspiracy theory about
President Barack Obama. The peak of Fraudulent electoral process on October 27 (46%) was
driven by the conservative activist organization Project Veritas reporting about alleged voter fraud
in Texas.
JamesOKeefeIII: Full 18 minute YouTube release Share it far and wide! #RiggedElection
https://t.co/Z4aDmyXh56
Sensitive content related to YouTube resources had a minor peak on October 12. This was mostly
caused by several unrelated stories, such as the death of a Trump supporter.
US 2020 ELECTIONS - NARRATIVE MAPPING 267 Instagram
7.1 Top narratives
COVID-19 was the most frequented narrative related to Instagram content with 37.7% of all tweets
referring to narratives and the US 2020 elections during the four weeks leading up to election day.
This narrative is followed by Black community with 11.9%. Instagram has the highest percentage
of referrals to Black community compared to Facebook (2.07%) and YouTube (2%).
Black Community is followed by Toxic narratives with 10.5%, Leaks with 10.5%, Civil unrest 2020
with 9.7% and Sensitive content with 5.6%. Conspiracy theories related to Instagram content was
3.6% and QAnon-related content was 3.5%. On a low level, Instagram had the highest percentage
of referrals to Fraudulent electoral process with 1.36% in that time compared to YouTube (1.08%)
and Facebook (0.82%).
Figure 31: Top 10 narratives related to Instagram content on Twitter referring to the US 2020 elections between October
3 and November 3, 2020.
Figure 32: Narratives related to Instagram content on Twitter referring to the US 2020 elections between October 3 and
November 3, 2020.
US 2020 ELECTIONS - NARRATIVE MAPPING 277.2 Most promoted Instagram accounts
The “Miami Official Page on Instagram” was the most promoted Instagram account during the
four weeks leading up to election day with 2,537 referrals overall. The account has become
unavailable as of February 2021. The Miami account on Instagram is followed by the account of
the political advisor and former US Ambassador to Germany, Richard Grenell with 1,623 referrals.
In the 15 most promoted Instagram accounts, Joyann Reid, host of MSNBC’s “The ReidOut” is #3
with 324 referrals, the account @realdonaldtrump is #6 with 177 referrals and the rapper Kanye
West who also ran for president in 2020 is #9 with 132 referrals. He is followed by the account
@teamtrump which is an account of the Save America leadership PAC, affiliated with Senator
James E. Risch.
No. Account Referrals
1 Miami Official Page 2,537
2 richardgrenell 1,623
3 sokrates_17 1,308
4 joyannreid 324
5 hydeparkwire 288
6 realdonaldtrump 177
7 juancarlossosaazpurua 146
8 showpiecent 132
9 kanyewest 132
10 teamtrump 104
11 titoortiz1999 95
12 blbuckley 85
13 White House 77
14 davidjharrisjr 48
15 sneakertigger 47
Table 7: Most promoted Instagram accounts and the number of referrals on Twitter referring to the US 2020 elections
and narratives between October 3 and November 2, 2020.
7.3 Most promoted Instagram posts
One third of the 15 most promoted Instagram posts were about Donald Trump’s campaign trail
(#2, #5, #8, #11, #14). Most of the content was posted by richardgrenell who created a total
Instagram traffic of 1,623 referrals. The posts of sokrates_17 were constantly promoted between
October 3 and November 3, 2020, almost on every day. The posts suggest analogies between
Donald Trump and the Chinese philosopher Sun Tzsu: The Art of Trump with 669 referrals or
The real reason they want you to hate Donald Trump.
The post of the Miami account with 2,526 referrals has become unavailable as of February 2021
as well as the post by Kanye West with 101 referrals. More than 308 highly promoted Instagram
posts have become unavailable as of February 2021.
US 2020 ELECTIONS - NARRATIVE MAPPING 28No. Account Post Referrals
1 Miami Official Page A the weekend 2,526
2 richardgrenell Pittsburgh Pride with tiffanytrump. #maga #4moreyears 876
3 sokrates_17 The Art of Trump 669
4 sokrates_17 The real reason they want you to hate Donald Trump 552
5 richardgrenell Minneapolis, see you Saturday! Come out and join us for 420
realdonaldtrump Pride.
6 joyannreid Searching for the Black Trump voter 324
7 hydeparkwire Sign of the march... 288
8 richardgrenell Final event - Philadelphia Pride. 231
9 showpiecent Chumoney : America 132
10 kanyewest Unavailable 101
11 richardgrenell Latrobe, Pennsylvania - getting ready to welcome VP Mike 96
Pence.
12 juancarlossosaazpurua Por que si me gusta donald trump (URL) 80
13 White House A message from President realdonaldtrump 77
14 realdonaldtrump I LOVE TEXAS! 69
15 blbuckley An open letter from me to realdonaldtrump & vp. Please 68
share if you’re with me. #voteblue2020
Table 8: Most promoted Instagram content and the number of referrals on Twitter referring to the US 2020 elections
between October 3 and November 2, 2020.
7.4 Selected narratives over time
Figure 33: Narratives related to Instagram content on Twitter over time while referring to the US 2020 elections between
October 3 and November 3, 2020.
Looking at the amplification of narratives related to Instagram content over time, Instagram
content was constantly related to COVID-19 (color: green). The most significant traffic related
to COVID-19 related to Instagram content was on October 6. On this day, Donald Trump left
Walter Reed Medical Center after a COVID-19 treatment. Until October 16, the traffic related to
COVID-19 decreased.
US 2020 ELECTIONS - NARRATIVE MAPPING 29The peak of the narrative Leaks (color: gray) on October 8 was mostly related to one post:
conserv34732269: @staymad____ This is Joe Biden calling black people the N word
https://t.co/4IznDA6NoL please share this and thank you
A significant number of Instagram referrals were related to Toxic narratives (color: flamingo)
on October 23, the day after the second Presidential Debate. This peak was caused by various
unrelated posts such as:
bat211: Lyin @JoeBiden https://t.co/KgkUyjxKim
ZEBASOLAR: @DonaldJTrumpJr Emerging Biden Scandal Pakistan https://t.co/uZUugdADl9
While Instagram content related to Black community (color: light green) and Civil unrest 2020
(color: yellow) were constantly shared over this period of time, both narratives had a peak. The
peak of Black community on election day, November 3, 2020 was caused by various accounts
referring to different Instagram posts:
CurvyEST:“Wake up folks! Today is important! #vote #vote2020 #biden2020 #blacklivesmatter
#cnn #news #getwoke #election https://t.co/Ev1QB73tZC”
DJDavidSerrano:“Not voting is not a protest. It is a surrender! #VOTE #democracy
#BLM #BlueWave #DumpTrump @ Washington D.C. https://t.co/ZJ0xn3UgMD”
The peak of Civil unrest 2020 on October 13 was mostly related to one tweet and Instagram post
by TalbertSwan: "NEWSFLASH: The exorcism didn’t work #RacistTrump #SonOfAKlansman via. . .
https://t.co/WgUvxserm5"
Figure 34: Instagram post by TalbertSwan.
US 2020 ELECTIONS - NARRATIVE MAPPING 30Two narratives had a minor one-day peak each: Sensitive content (color: brown) and Fraudulent
electoral process (color: purple). On October 14, most of the Instagram content referring to
Sensitive content was caused by a tweet of @CarlBotha2 which was significantly quoted by other
accounts:
CarlBotha2 : "Pedophile exposed! @JoeBiden @realDonaldTrump https://t.co/wkUPwNFiOP"
(The Instagram post has become unavailable as of February 2021)
The peak of Fraudulent electoral process on October 27 was caused by various different accounts
sharing one video by the conservative activist group Project Veritas claiming voter fraud, such as
ChicagoResell: "More Proof Democrats are committing voter Fraud. https://t.co/5llwAuyIq3".
Figure 35: Instagram post by jamesokeefeiii shared by ChicagoResell.
US 2020 ELECTIONS - NARRATIVE MAPPING 31A Appendix A.1 Scope This report presents and compares the traffic volume related to social media platforms measured by the number of tweets or referrals. This report shows the activity. This report does not include an assessment of the impact narratives may have had on the outcome of the US 2020 elections, on the voting process or on public opinion. A.2 Labeling and visualization methodology Narrative labels are determined by natural language processing analyzing hashtags, words, syntax and the hierarchy thereof. For example, if a tweet includes "mail-in", "ballot" and "fraud", the user is narrative labeled as "fraudulent electoral process". Network graph visualizations reflect the relationship between Twitter accounts determined by the engagement with one another, measured by retweets, favs, quotes and replies and the content they have shared. The more the accounts interact with each other and the more they have in common regarding their operational behaviors, the closer they are located to one another on the map. The sizes of the nodes reflect the number of referrals to YouTube videos or YouTube channels. A big node represents a Twitter account or a YouTube channel that had many referrals in that time, a small node represents a Twitter account or a YouTube channel that had a smaller number of referrals. The coloring convention of nodes is displayed under each and every graph visualization. Edges are colored according to the source node. Tweets, posts and videos that are displayed in this report, were available in February 2021. Content may become unavailable or re-available after the report is published. A.3 Details on narratives Black Community: This narrative includes but is not limited to the black lives matter movement including black pride and black excellence. Boogaloo: This narrative refers to the militia ideology that advocates violence against law enforcement and government officials and promotes a civil war on race. This narrative includes but is not limited to boogaloo boys, boojihadeen, a patriot wave and the violent collapse of modern society. Census 2020: This narrative refers to the US census 2020. Civil unrest 2020: This narrative refers to the protests, outrages and policy issues in the aftermath of George Floyds death on May 25, 2020. This narrative includes but is not limited to police brutality, defunding the police, antifascist movements and the government response to the protests. Climate change: This narrative refers to issues related to climate change. This narrative includes but is not limited to renewable energy, environmental issues and green tech. US 2020 ELECTIONS - NARRATIVE MAPPING 32
You can also read