Morphological differences in the calcaneus among extant great apes investigated by three dimensional geometric morphometrics
←
→
Page content transcription
If your browser does not render page correctly, please read the page content below
www.nature.com/scientificreports
OPEN Morphological differences
in the calcaneus among extant
great apes investigated
by three‑dimensional geometric
morphometrics
Shuhei Nozaki1*, Hideki Amano1, Motoharu Oishi2 & Naomichi Ogihara1*
Investigating the morphological differences of the calcaneus in humans and great apes is crucial
for reconstructing locomotor repertories of fossil hominins. However, morphological variations in
the calcaneus of the great apes (chimpanzees, gorillas, and orangutans) have not been sufficiently
studied. This study aims to clarify variations in calcaneal morphology among great apes based on
three-dimensional geometric morphometrics. A total of 556 landmarks and semilandmarks were
placed on the calcaneal surface to calculate the principal components of shape variations among
specimens. Clear interspecific differences in calcaneal morphology were extracted, corresponding to
the degree of arboreality of the three species. The most arboreal orangutans possessed comparatively
more slender calcaneal tuberosity and deeper pivot region of the cuboid articular surface than
chimpanzees and gorillas. However, the most terrestrial gorillas exhibited longer lever arm of the
triceps surae muscle, larger peroneal trochlea, more concave plantar surface, more inverted calcaneal
tuberosity, more everted cuboid articular surface, and more prominent plantar process than the
orangutans and chimpanzees. These interspecific differences possibly reflect the functional adaptation
of the calcaneus to locomotor behavior in great apes. Such information might be useful for inferring
foot functions and reconstructing the locomotion of fossil hominoids and hominids.
The human foot possesses a calcaneus, the tuberosity of which points posteriorly and inferiorly, allowing a
prominent heel strike during bipedal w alking1,2. African great apes also have plantigrade feet and can walk with
a heel strike1,3–7, but heel and midfoot often contact the ground at the same time6, and the heel strike in African
great apes is not as prominent as that in humans. Old world monkeys, such as Japanese macaques, usually touch
down with the fore- and midfoot but do not walk with a heel strike1,8,9.
Reflecting these differences in foot–ground contact between humans and African great apes during loco-
motion, the calcaneus morphology differs largely among species. Previous studies noted that: (1) the human
calcaneus is more robust, mediolaterally wider, and longitudinally straighter than that of the African apes1,2,10;
(2) the human calcaneus possesses a large, robust tuberosity and plantarly located lateral plantar process2,11;
(3) the human calcaneus possesses a peroneal trochlea that is smaller than that of the African apes12,13; (4) the
calcaneocuboid articular surface is more acutely angled with respect to the longitudinal axis of the calcaneus in
humans than in African apes in lateral view due to the longitudinally arched structure of the human foot14; (5)
the calcaneocuboid articular surface is more flat and asymmetrical, constricting rotatory movement at the joint
in humans than in African apes15,16; and (6) the posterior talar facet is flatter in the human calcaneus than in
that of the African apes, reflecting more constricted subtalar joint in humans17. These morphological differences
distinguishing the human calcaneus from those of African apes are considered as morphological adaptations
to obligatory bipedal locomotion, and are used to reconstruct the locomotor repertories of early hominins to
understand the origin and evolution of habitual bipedal locomotion in the human l ineage1,2,11,17,18.
1
Laboratory of Human Evolutionary Biomechanics, Department of Biological Sciences, Graduate School of
Science, The University of Tokyo, 7‑3‑1 Hongo, Bunkyo, Tokyo 113‑0033, Japan. 2Laboratory of Anatomy, School
of Veterinary Medicine, Azabu University, Kanagawa 252‑0206, Japan. *email: s_nozaki@bs.s.u-tokyo.ac.jp;
ogihara@bs.s.u-tokyo.ac.jp
Scientific Reports | (2021) 11:20889 | https://doi.org/10.1038/s41598-021-99942-1 1
Vol.:(0123456789)
www.nature.com/scientificreports/
These studies focused on documenting the calcaneus morphological variation between humans and African
apes, assuming it to be relatively minor among chimpanzees and gorillas. However, there exist calcaneal mor-
phological differences among great apes that may be correlated with differences in their locomotor b ehavior2,19.
Great apes (African great apes plus orangutans) utilize a versatile locomotor repertoire such as suspensory
locomotion (brachiation), vertical climbing, quadrumanous climbing, and terrestrial quadrupedal locomotion
(knuckle walking)20–25. Therefore, a detailed analysis of the morphological variations of the calcaneus among
great apes would provide opportunities to clarify the form-function relationships in the calcaneus critical for
predicting the foot function of fossil hominoids and hominids.
Using three-dimensional (3D) geometric morphometrics, DeSilva et al.26 conducted a morphological analysis
of hominin fossil calcanei, including human and great ape samples, based on a relatively small number of ana-
tomical landmarks (20), and no explicit comparisons among the great ape calcanei were made, as the aim was
to identify the overall morphological affinity of the fossil calcanei in the calcanei of humans and great a pes18,26.
Harcourt-Smith27 analyzed the patterns of morphological variations of human and great ape calcanei based on
20 landmarks, but only crude comparisons were possible because of the small number of landmarks. Harper
et al.28 has recently clarified the calcaneal morphological variations among the three subspecies of gorilla taxa
with differences in the degree of arboreality based on geometric morphometrics of approximately a thousand
landmarks and demonstrated that the calcaneus is anteroposteriorly more elongated and possesses more concave
cuboid and flatter posterior talar articular surfaces. However, only these studies have explored morphological
variations among great apes calcanei using geometric morphometrics. Therefore, this present study aimed to
quantify detailed variations in calcaneal morphology among great apes based on 3D morphometrics using a
sufficiently large number of landmarks (> 500). Specifically, we investigated whether the differences in the calca-
neal morphology, particularly the differences in the shapes of the calcaneal tuberosity and the articular surfaces
of the calcaneus among great apes possibly corresponded to the differences in their locomotor behaviors and
degree of arboreality.
Materials and methods
Sample. Computed tomography (CT) scans of calcanei from 20 chimpanzees (10 P. troglodytes troglodytes,
5 P. troglodytes schweinfurthii, 4 P. troglodytes verus, and 1 P. troglodytes hybrid), 20 gorillas (14 G. gorilla gorilla
and 6 G. beringei beringei), and 20 orangutans (19 P. pygmaeus and 1 P. abelii) were used for the analysis. Speci-
mens of seven chimpanzees, five gorillas, and four orangutans were captive cadaver feet donated to the Primate
Research Institute, Kyoto University, Japan. Wild specimens of 10 chimpanzees, 15 gorillas, and 14 orangu-
tans were obtained from MorphoSource (https://www.morphosource.org, Media ID: 101819; 101887; 101912;
101994; 102264; 102393; 102599; 102710; 102915; 103083; 2136; 2139; 2142; 51600; 51836; 51869; 84188; 84195;
85860; 86050; 86054; 101836; 102164; 102220; 103649; 2148; 2344; 102540; 102672; 102822; 102921; 102966;
103119; 103220; 103477; 103526; 103580; 103586; 103645). Three dry bone specimens of chimpanzees were wild
individuals from the Mahale Mountain National Park, Tanzania. Two orangutans dry bone specimens were col-
lected at the Laboratory of Physical Anthropology, Kyoto University. In addition, calcanei from 10 humans and
7 Japanese macaques (Macaca fuscata) were also included in this analysis as outgroups. The human specimens
were dry bone specimens housed at the University Museum, University of Tokyo. The Japanese macaque samples
were captive dry bone specimens housed at the Laboratory of Physical Anthropology, Kyoto University, except
for one cadaver specimen studied by Ogihara et al.29. All samples were adults and were free of obvious pathology.
All calcanei were segmented from the CT scans, and 3D bone models of the calcanei were generated in Mimics
22.0 (Materialise Inc., Leuven, Belgium). The left calcanei were mirrored and analyzed as right-sided specimens.
Pixel size and slice interval of the CT scans were < 1 mm for great apes, and < 0.2 mm for humans and Japanese
macaques.
Three‑dimensional geometric morphometrics. Calcaneal shape variations were analyzed using slid-
ing-semilandmark-based 3D geometric morphometrics. A total of 22 anatomical landmarks were digitized on
the 3D surface of the calcaneus (Fig. 1, Table 1). In addition, we manually defined 534 sliding semilandmarks on
one chimpanzee specimen chosen as a template specimen (Fig. 1), to fully represent the entire calcaneal bone
and articular surfaces. The semilandmark configuration of the template was mapped to all other specimens
in the sample using a thin-plate spline function30 and subsequently allowed to slide to minimize the bending
energy between each specimen and the t emplate31,32. The shape variation of the calcanei among species were ana-
lyzed using geometric morphometrics33–35. The coordinates of the 556 landmarks were normalized by centroid
size and registered using the generalized Procrustes m ethod36–38 to remove variance associated with size, transla-
tion, and orientation. Principal component analysis (PCA) was then conducted using the variance–covariance
matrix of the Procrustes residuals to obtain the principal components (PCs) of shape variations among the
specimens. In this study, we analyzed the morphological variations of the calcanei using PCA in two ways: (1)
a whole-sample analysis using all samples, including human and macaque samples, to grasp a broader picture
of the shape variations of the great ape calcaneus; and (2) an ape-only analysis using only chimpanzee, gorilla,
and orangutan samples to illustrate the differences in the calcaneal morphology among the three. The calcaneal
shape variations along the PCs were represented by warping either the wireframe connecting the primary land-
marks (Fig. 1) or the surface model of the template calcaneus. The mean calcaneal shapes of the chimpanzee,
gorilla and orangutan were also calculated and presented in the same manner for interspecific comparisons (See
Supplementary Information).
Statistical analyses. Inter-specific shape differences were analyzed for the PCs using analysis of variance
(ANOVA). If the ANOVA was significant, a post-hoc Tukey’s HSD test was performed. The statistical signifi-
Scientific Reports | (2021) 11:20889 | https://doi.org/10.1038/s41598-021-99942-1 2
Vol:.(1234567890)
www.nature.com/scientificreports/
a 20 22 d 7
20
16 15 21 14
3 13
11 8
12
10
6
4
13 17
5 9 5
6 20
b 18
19 e
8 21
2 14
2
7
17
16 3
10
1
11 12 22 3
4
13 15 14
c 17
5
10
9 1
6
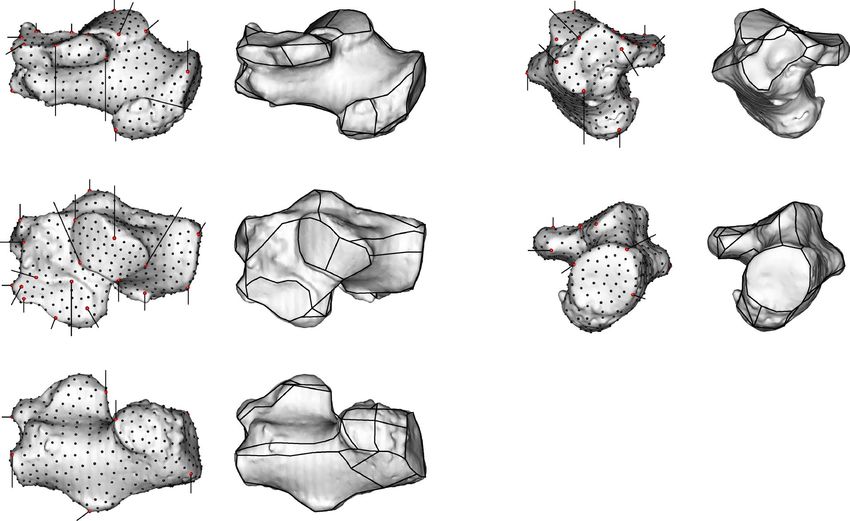
Figure 1. Landmarks used in the present study. Twenty-two anatomical landmarks (red) and 534 semi-
landmarks (black) were defined on a representative chimpanzee calcaneal specimen chosen as a template.
Wireframes connecting primary landmarks were drawn to visualize shape variations. (a) Medial view, (b)
Superior view, (c) Inferior view, (d) Anterior view, (e) Posterior view.
Number Description
1 Most lateral point of the calcaneal tuberosity
2 Most superior point of the calcaneal tuberosity
3 Most medial point of the calcaneal tuberosity
4 Midpoint between point 3 and 5 on the medial edge of the calcaneal tuberosity
5 Most anterior point of the medial plantar process
6 Apex of the peroneal trochlea
7 Most lateral point of the articular surface for cuboid
8 Most inferolateral point of the articular surface for cuboid
9 Most inferomedial point of the articular surface for cuboid
10 Most superomedial point of the articular surface for cuboid
11 Most anterior point of the anterior talar articular surface
12 Most medial point of the anterior talar articular surface
13 Most medial point of the middle talar articular surface
14 Most posterior point of the middle talar articular surface
15 Most lateral point of the middle talar articular surface
16 Most lateral point of the anterior talar articular surface
17 Most posteroinferior point of the sustentaculum tali
18 Most anterolateral point of the posterior talar articular surface
19 Most lateral point of the posterior talar articular surface
20 Most posterior point of the posterior talar articular surface
21 Most medial point of the posterior talar articular surface
22 Most anteromedial point of the posterior talar articular surface
Table 1. Description of landmarks used in this study.
Scientific Reports | (2021) 11:20889 | https://doi.org/10.1038/s41598-021-99942-1 3
Vol.:(0123456789)
www.nature.com/scientificreports/

                    a                               0.2        PC2 (21.7%)                                     b                          0.15       PC4 (11.1%)

                                                    0.15
                                                                                                                                          0.1

                                                    0.1

                                                                                                                                          0.05
                                                    0.05

                                                                                          PC1 (28.4%)                                                                        PC3 (11.3%)
                                                     0                                                                                     0
                     0.2    0.15      0.1    0.05          0      0.05   0.1       0.15      0.2               0.15   0.1
                                                                                                                        1          0.05          0         0.05      0.1        0.15

                                                    0.05
                                                                                                                                          0.05

                                                                                               Human
                                                     0
                                                     0.1
                                                                                               Chimpanzee
                                                                                               Gorilla                                     0.1
                                                    0.15
                                                                                               Orangutan
                                                                                               Macaque
                                                     0.2                                                                                  0.15

                                              Figure 2.  The results of the whole-sample analysis represented as scatter plots of the principal component PC1
                                              versus PC2 (a) and PC3 versus PC4 (b). The percentage of variance explained by each PC score is shown in
                                              parentheses.

                                               PC1 and PC2                   Human                 Chimpanzee          Gorilla              Orangutan              Macaque
                                               Human                                                < 0.0001            < 0.0001                < 0.0001            < 0.0001
                                               Chimpanzee                       0.006                                   < 0.0001                 0.0008              0.001
                                               Gorilla                          0.619                0.0001                                     < 0.0001             0.351
                                               Orangutan                       < 0.0001             < 0.0001            < 0.0001                                    < 0.0001
                                               Macaque                          0.0001              < 0.0001            < 0.0001                < 0.0001

                                              Table 2.  P-value of post-hoc tests for multiple comparisons in whole-sample analysis for PC1 and PC2. The
                                              right-upper cells represent the P-value for PC1, and the left-lower cells represent PC2. P-values < 0.05 are in
                                              bold for PC1, and P-values < 0.005 (0.05/10) are in bold for PC2 to indicate significant differences.

                                              cance level was set at P < 0.05. The Kruskal–Wallis test with a post-hoc Wilcoxon rank sum test for multiple
                                              comparisons, followed by Bonferroni correction with the adjusted P-value set at P < 0.005 (0.05/10), was used if
                                              normality or homogeneity of variance was violated. Data processing and analyses were implemented in R soft-
                                              ware, version 3.5.239, using the R package ‘geomorph’ and ‘Morpho’.
                                                  The present study included both wild and captive specimens for geometric morphometric analysis. To inves-
                                              tigate possible differences in the calcaneal morphology between the wild and captive specimens of the same
                                              species, we tested if the mean PC scores were significantly different between the wild and captive specimens in
                                              chimpanzees, gorillas and orangutans using two-tailed t-test or Wilcoxon rank-sum test.

                                              Results
                                              Whole‑sample analysis. The results of the whole-sample analysis are presented in Fig. 2 as scatter dia-
                                              grams of PC1 versus PC2 and PC3 versus PC4. Based on a threshold of 5% variance explained, the first four
                                              PCs were considered dominant in the whole-sample analysis. The first four PCs accounted for 72.5% of the total
                                              variance. ANOVA and the Kruskal–Wallis test indicated that there were significant differences in PC1 (F = 121.3,
                                              P < 0.0001), PC2 (x2 = 60.3, P < 0.0001), PC3 (F = 164.5, P < 0.0001), and PC4 (F = 39.0, P < 0.0001) among the
                                              species.
                                                  Along PC1, humans were separated (Fig. 2a) and exhibited significantly higher PC1 scores than those of
                                              great apes and macaques (Table 2). Humans possessed a relatively larger calcaneal tuberosity (Fig. 3a, b) with
                                              plantarly located lateral plantar process (Fig. 3d), relatively smaller peroneal trochlea (Fig. 3b), and flatter and
                                              more plantarly oriented cuboid articular surface with respect to its longitudinal axis (Fig. 3a and e), as indicated
                                              previously (see “Introduction”). Also, the cuboid articular surface in humans was observed to be more twisted
                                              in the inverting direction (Fig. 3c) and faced more medially than those in great apes (Fig. 3a). Furthermore, in
                                              humans, the sagittal angle between the anterior-middle and posterior articular surfaces was larger (Fig. 3a), and
                                              the posterior articular surface was less tilted medially in the coronal plane (Fig. 3c) than in great apes. Moreover,
                                              the outline of the cuboid articular surface in humans was wedged, but it was round in the great apes (Fig. 3c).

          Scientific Reports |     (2021) 11:20889 |                     https://doi.org/10.1038/s41598-021-99942-1                                                                    4

Vol:.(1234567890)
www.nature.com/scientificreports/

                       negative                           positive                            negative                              positive
                                            PC 1                                                                   PC 1
                        ( 0.08)                              (0.13)                             ( 0.08)                                (0.13)
         a                                                                          d

         b                                                                          e

         c

                                   Figure 3.  Shape variations represented by PC1 in the whole-sample analysis. Shape variations are visualized
                                   using the wireframe connecting primary landmarks and the template surface deformed using a thin-plate spline
                                   function. Black line and white surface: PC1 = 0.13. Red line and red surface: PC1 = − 0.08. Black arrows indicate
                                   characteristics of the positive score. The medial (a), superior (b), posterior views of the anterior (c) and posterior
                                   (d) parts, and anterolateral (e) views were presented.

                                       Along PC2, macaques were separated and exhibited significantly smaller PC2 scores than the other four spe-
                                   cies (Fig. 2a, Table 2). They had a less inferiorly prominent and mediolaterally narrower plantar process (Fig. 4a,
                                   c), more convex plantar surface of the calcaneus (Fig. 4a), smaller peroneal trochlea (Fig. 4b), less inverted cal-
                                   caneal tuberosity with more laterally shifted medial plantar process (Fig. 4e), and less everted cuboid articular
                                   surface (Fig. 4d) than great apes and humans.
                                       The PC3 and PC4 scores were also significantly different among the five species (Fig. 2b, Table 3), but since
                                   the present study focused on the calcaneal shape variations within the three great ape species, these scores were
                                   not considered.

                                   Ape‑only analysis. The results of the ape-only analysis are presented in Fig. 5 as scatter diagrams of PC1
                                   versus PC2 and PC3 versus PC4. Based on a threshold of 5% variance explained, the first three PCs were con-
                                   sidered dominant in the ape-only analysis. The first three PCs accounted for 64.0% of the total variance. We
                                   confirmed that there were no statistically significant differences in the PC scores between the wild and captive
                                   specimens, except for the PC3 score of orangutans (Supplementary Fig. 1 and Supplementary Table), suggesting
                                   that the use of captive specimens has only minor effect on the results of the present analysis.
                                       The PC1 versus PC2 plot demonstrated that plots of chimpanzees, gorillas, and orangutans were clearly
                                   separated from one another. The ANOVA indicated that there were significant differences in PC1 (F = 353.2,
                                   P < 0.0001) and PC2 (x2 = 37.4, P < 0.0001) scores among these species. Post-hoc tests showed that PC1 was sig-
                                   nificantly different among the three groups (Figs. 5a, 6). In particular, the mean PC1 score was arranged in the
                                   order of orangutans, chimpanzees, and gorillas in ascending order.
                                       With increasing PC1, the height of the calcaneal tuberosity decreased while its mediolateral width increased
                                   (Fig. 7a, c), indicating robust calcaneal tuberosity in African apes. The plantar surface of the calcaneus was
                                   more concave (Fig. 7a), the heel process was more prominent (Fig. 7a), and the peroneal trochlea became larger
                                   (Fig. 7b) with increasing PC1. In the coronal plane, the calcaneal tuberosity was more twisted in the inverting
                                   direction, and the medial plantar process was consequently shifted medially (Fig. 7e). In contrast, the cuboid
                                   articular surface was more twisted in the everting direction with increasing PC1 (Fig. 7d). Furthermore, the
                                   anterior-middle and posterior articular surfaces were located closer to each other, but the distance between the
                                   posterior articular surface and the calcaneal tuberosity increased with increasing PC1 (Fig. 7b). The medial

Scientific Reports |    (2021) 11:20889 |               https://doi.org/10.1038/s41598-021-99942-1                                                     5

                                                                                                                                                  Vol.:(0123456789)
www.nature.com/scientificreports/

                                 negative                           positive                            negative                              positive
                                                      PC 2                                                                    PC 2
                                  ( 0.09)                              (0.08)                              ( 0.09)                               (0.08)
                    a                                                                            d

                    b                                                                            e

                    c

                                             Figure 4.  Shape variations represented by PC2 in the whole-sample analysis. Shape variations are visualized
                                             using the wireframe connecting primary landmarks and the template surface deformed using a thin-plate spline
                                             function. Black line and white surface: PC2 = 0.08. Red line and red surface: PC2 = − 0.09. Red arrows indicate
                                             characteristics of the negative score. The medial (a), superior (b), inferior (c), and posterior views of the anterior
                                             (d) and posterior (e) parts were presented.

                                              PC3 and PC4           Human            Chimpanzee          Gorilla          Orangutan           Macaque
                                              Human                                   < 0.0001             < 0.0001         < 0.0001           < 0.0001
                                              Chimpanzee             < 0.0001                               0.996           < 0.0001           < 0.0001
                                              Gorilla                 1.000           < 0.0001                              < 0.0001           < 0.0001
                                              Orangutan               0.468           < 0.0001              0.183                              < 0.0001
                                              Macaque                 0.020            0.0004               0.004            0.249

                                             Table 3.  P-value of post-hoc tests for multiple comparisons in whole-sample analysis for PC3 and PC4. The
                                             right-upper cells represent the P-value for PC3 and the left-lower cells represent PC4. P-values < 0.05 are in
                                             bold for PC3 and PC4 to indicate significant differences.

                                             and lateral cuboid articular surfaces were flatter with increasing PC1 (Fig. 7f), but they were more concave and
                                             convex with decreasing PC1 (Fig. 7c).
                                                 PC2 was significantly larger in chimpanzees than in orangutans and gorillas. With increasing PC2, the length
                                             of the posterior articular surface increased (Fig. 8b), the heel process was located more anteriorly (Fig. 8a, c),
                                             the peroneal trochlea was larger, and the calcaneal body was wider (Fig. 8b). However, the shape variations
                                             represented by PC2 were similar to those extracted in PC1, but the contribution was much smaller than that of
                                             PC1. Therefore, shape variations along PC2 will not be discussed further.

                                             Discussion
                                             Although the calcaneal shape of the extant great apes is generally similar to one another (Fig. 2a), the present
                                             study demonstrated that there is a clear, statistically significant shape difference in the calcaneus among the
                                             extant great apes (Fig. 5a). The extracted shape variation, represented by PC1 of the ape-only analysis, pos-
                                             sibly corresponds to locomotor behaviors and the degree of arboreality of the three species; the fundamental

          Scientific Reports |    (2021) 11:20889 |               https://doi.org/10.1038/s41598-021-99942-1                                                      6

Vol:.(1234567890)
www.nature.com/scientificreports/

          a                                0.2        PC2 (19.2%)                           b                       0.15       PC4 (4.4%)

                                           0.15
                                                                                                                    0.1

                                           0.1

                                                                                                                    0.05
                                           0.05

                                                                             PC1 (36.3%)                                                          PC3 (8.5%)
                                            0                                                                        0
           0.2     0.15      0.1    0.05          0      0.05   0.1   0.15      0.2           0.15   0.1     0.05          0        0.05    0.1      0.15

                                           0.05
                                                                                                                    0.05

                                            0.1
                                                                                  Chimpanzee
                                                                                  Gorilla                            0.1
                                           0.15
                                                                                  Orangutan

                                            0.2                                                                     0.15

                                     Figure 5.  The results of the ape-only analysis represented as scatter plots of the principal component (PC) 1
                                     versus PC2 (a) and PC3 versus PC4 (b). The percentage of variance explained by each PC score is shown in
                                     parentheses.

                                     Figure 6.  Interspecific differences in the mean principal component scores in the ape-only analysis. The
                                     asterisk indicates that there is significant difference in the PC scores among species (P < 0.05).

Scientific Reports |      (2021) 11:20889 |                     https://doi.org/10.1038/s41598-021-99942-1                                                  7

                                                                                                                                                      Vol.:(0123456789)
www.nature.com/scientificreports/
negative positive negative positive
PC 1 PC 1
0.09 0.08 0.09 0.08
a d
b e
c f
Figure 7. Shape variations represented by PC1 in the ape-only analysis. Shape variations are visualized using
the wireframe connecting primary landmarks and the template surface deformed using a thin-plate spline
function. Black line and white surface: PC1 = 0.08. Red line and red surface: PC1 = − 0.09. Black arrows indicate
characteristics of the positive score. The medial (a), superior (b), inferior (c), posterior views of anterior (d) and
posterior (e) parts, and anterolateral (f) views were presented.
quadrumanous climbers orangutans are the most arboreal among the extant great apes having the lowest mean
PC1 score, the gorillas are the most terrestrial great apes with the highest mean PC1 score, and the chimpanzees
fell between the two. The extracted shape variations along PC1 include the tendency of the medial and lateral
pivot regions of the cuboid facet to be more deeply concave and convex, respectively, with decreasing PC1 (in
orangutans) but flatter with increasing PC1 (in gorillas). The morphology of the cuboid facet pivot region is
linked to greater and lesser midfoot joint mobility, which is considered to reflect an adaptation for arboreal and
terrestrial locomotion, r espectively1,28.
The shape variation along PC1 also indicated that the distances between the anterior-middle and posterior
articular surfaces decreased, but the distance between the posterior articular surface and the calcaneal tuberosity
increased with increasing PC1, and vice versa (Fig. 7b) as previously suggested by Harcourt-Smith27. Therefore,
the longer moment arm length of the triceps surae muscle (the Achilles tendon) is related to more terrestrial
behaviors. In addition, the peroneal tubercle was more laterally protrudent with increasing PC1 and vice versa
(Fig. 7b), suggesting that the size of the peroneal tubercle is also related to the degree of terrestriality in great
apes. It must be noted, however, that the longer moment arm of the triceps surae muscle should be advantageous
during the propulsive phase not only in terrestrial quadrupedal locomotion but also in arboreal vertical climb-
ing. Furthermore, the large robust peroneal tubercle reportedly linked to a large force applied by the peroneal
muscles13, should also be advantageous to evert the foot during both terrestrial and arboreal locomotion. There-
fore, these morphological differences may not represent the difference in the degree of terrestriality or arboreality
in great apes. Therefore, care should be taken when making inferences about the locomotor behaviors of fossil
hominids based on the morphology of the peroneal tubercle.
The present study also demonstrated that the calcaneal tuberosity was more inverted with respect to the body
of the calcaneus with increasing PC1 and vice versa (Fig. 7e), indicating that the calcaneal tuberosity is inverted
and everted in relatively terrestrial and arboreal great apes, respectively. The feet of great apes are highly inverted
to facilitate positioning of the sole of the foot against the vertical substrate during climbing as an adaptation to
arboreal life40. However, the present study indicates the orientation of the calcaneal tuberosity did not necessarily
correspond to the inversion/eversion of the foot with respect to the shank in great apes. In addition, the cuboid
facet was more everted with increasing PC1, indicating that the more terrestrial species possessed more everted
Scientific Reports | (2021) 11:20889 | https://doi.org/10.1038/s41598-021-99942-1 8
Vol:.(1234567890)
www.nature.com/scientificreports/
negative positive
PC 2
0.05 0.06
a
b
c
Figure 8. Shape variations represented by PC2 in the ape-only analysis. Shape variations are visualized using
the wireframe connecting primary landmarks and the template surface deformed using a thin-plate spline
function. Black line and white surface: PC2 = 0.06. Red line and red surface: PC2 = − 0.05. Black arrows indicate
characteristics of the positive score. The medial (a), superior (b), and inferior (c) views were presented.
cuboid facets, possibly facilitating firm contact of the forefoot and digits of the inverted hindfoot to the ground
during terrestrial locomotion. Therefore, the greater inversion of the calcaneal tuberosity and eversion of the
cuboid facet might be related to terrestrial locomotion, and this morphological characteristic can possibly be
better utilized to infer the locomotor behavior of the fossil hominids. However, notably the calcaneal tuberos-
ity and the cuboid facet were less inverted and everted, respectively, in the calcaneus of habitually terrestrial
humans (Fig. 3c and d).
The present study observed that the plantar process of the calcaneal tuberosity was more inferiorly projected
and the plantar surface of the calcaneus was more concave (Fig. 7a) with increasing PC1, possibly indicating that
these morphological characteristics were related to the degree of terrestrial locomotion. However, S armiento41
previously proposed that this morphological feature is an adaptation to a strong hook-like grasp for hanging
and tree climbing because it provides a broader insertion site for the flexor digitorum brevis muscle (FDB). If
so, the plantar process in orangutans should have been the largest in great apes, but the present study indicated
the opposite. The reason behind this discrepancy is currently obscure, but a recent study indicated that the FDB
greatly contributed to the generation of an effective propulsive force during push-off in human walking42. In
addition, the plantar process is the attachment site of the plantar aponeurosis, which is mostly well developed
in gorillas among the extant great apes43 as an adaptation to terrestrial locomotion44. Sarmiento41 indicated that
the concave plantar surface of the calcaneus with the developed plantar process in humans and gorillas can be
seen as a specialization retained from a common ancestor that engaged in foot hanging and tree climbing, but
our study suggests that these could be regarded as an adaptation to terrestrial locomotion in extant great apes.
In addition, the present detailed geometric morphometric study revealed that the angle between the anterior-
middle and posterior articular surfaces was larger in the sagittal plane (Fig. 3a), and the posterior articular
surface was less tilted medially in the coronal plane (Fig. 3c) than in the great apes, indicating that the overall
talar articular surface was more planar in the human calcaneus. The flattening of the talar articular surfaces in
humans possibly facilitates the medial translation and internal rotation of the talus on the calcaneus and hence
the internal rotation of the tibia following calcaneal eversion after the heel strike during w alking45–48. This mor-
phological feature of the human calcaneus may enhance the coupling motion of the calcaneus and tibia during
walking, which is structurally embedded in the human foot as an adaptation to obligatory bipedal locomotion49.
In conclusion, the present study demonstrated that there are interspecific differences in the calcaneal shape
among chimpanzees, gorillas, and orangutans based on 3D geometric morphometrics, and suggested that the
Scientific Reports | (2021) 11:20889 | https://doi.org/10.1038/s41598-021-99942-1 9
Vol.:(0123456789)
www.nature.com/scientificreports/
extracted pattern of calcaneal shape variation possibly corresponds to the differences in the degree of terres-
triality/arboreality among the three species. A detailed understanding of the morphological variations of the
calcaneus among great apes would provide valuable opportunities to clarify the form-function relationships in
the calcaneus, which is critical for predicting the foot function of fossil hominoids and hominids.
Data availability
The data that support the findings of this study are available from the corresponding authors upon reasonable
request.
Received: 25 July 2021; Accepted: 5 October 2021
References
1. Gebo, D. L. Plantigrady and foot adaptation in African apes: Implications for hominid origins. Am. J. Phys. Anthropol. 89, 29–58.
https://doi.org/10.1002/ajpa.1330890105 (1992).
2. Latimer, B. & Lovejoy, C. O. The calcaneus of Australopithecus afarensis and its implications for the evolution of bipedality. Am. J.
Phys. Anthropol. 78, 369–386. https://doi.org/10.1002/ajpa.1330780306 (1989).
3. D’Aout, K., Aerts, P., De Clercq, D., De Meester, K. & Van Elsacker, L. Segment and joint angles of hind limb during bipedal and
quadrupedal walking of the bonobo (Pan paniscus). Am. J. Phys. Anthropol. 119, 37–51. https://d oi.o
rg/1 0.1 002/a jpa.1 0112 (2002).
4. D’Aout, K. et al. Locomotion in bonobos (Pan paniscus): Differences and similarities between bipedal and quadrupedal terrestrial
walking, and a comparison with other locomotor modes. J. Anat. 204, 353–361. https://doi.org/10.1 111/j.0021-8782.2004.00292.x
(2004).
5. Schmitt, D. & Larson, S. G. Heel contact as a function of substrate type and speed in primates. Am. J. Phys. Anthropol. 96, 39–50.
https://doi.org/10.1002/ajpa.1330960105 (1995).
6. Vereecke, E., D’Aout, K., De Clercq, D., Van Elsacker, L. & Aerts, P. Dynamic plantar pressure distribution during terrestrial loco-
motion of bonobos (Pan paniscus). Am. J. Phys. Anthropol. 120, 373–383. https://doi.org/10.1002/ajpa.10163 (2003).
7. Zeininger, A., Schmitt, D. & Wunderlich, R. E. Mechanics of heel-strike plantigrady in African apes. J. Hum. Evol. 145, 102840.
https://doi.org/10.1016/j.jhevol.2020.102840 (2020).
8. Meldrum, D. J. Kinematics of the cercopithecine foot on arboreal and terrestrial substrates with implications for the interpretation
of hominid terrestrial adaptations. Am. J. Phys. Anthropol. 84, 273–289. https://doi.org/10.1002/ajpa.1330840305 (1991).
9. Ogihara, N., Kikuchi, T., Ishiguro, Y., Makishima, H. & Nakatsukasa, M. Planar covariation of limb elevation angles during bipedal
walking in the Japanese macaque. J. R. Soc. Interface 9, 2181–2190. https://doi.org/10.1098/rsif.2012.0026 (2012).
10. Deloison, Y. Comparative study of calcanei of Primate and Pan-Australopithecus-Homo relationship in Hominid Evolution: Past,
Present, and Future (ed. Tobias, P. V.) 143–147 (Alan R. Liss, Inc., 1985).
11. Boyle, E. K. et al. A quantification of calcaneal lateral plantar process position with implications for bipedal locomotion in Aus-
tralopithecus. J. Hum. Evol. 123, 24–34. https://doi.org/10.1016/j.jhevol.2018.05.008 (2018).
12. Gebo, D. L. & Schwartz, G. T. Foot bones from Omo: Implications for hominid evolution. Am. J. Phys. Anthropol. 129, 499–511.
https://doi.org/10.1002/ajpa.20320 (2006).
13. Stern, J. T. & Susman, R. L. The locomotor anatomy of Australopithecus afarensis. Am. J. Phys. Anthropol. 60, 279–317. https://doi.
org/10.1002/ajpa.1330600302 (1983).
14. Morton, D. J. The Human Foot: Its Evolution, Physiology and Functional Disorders (Columbia University Press, 1935).
15. Bojsen-Møller, F. Calcaneocuboid joint and stability of the longitudinal arch of the foot at high and low gear push off. J. Anat. 129,
165–176 (1979) (Pubmed: 511760).
16. Elftman, H. & Manter, J. Chimpanzee and human feet in bipedal walking. Am. J. Phys. Anthropol. 20, 69–79. https://doi.org/10.
1002/ajpa.1330200109 (1935).
17. Prang, T. C. The subtalar joint complex of Australopithecus sediba. J. Hum. Evol. 90, 105–119. https://d oi.o rg/1 0.1 016/j.j hevol.2 015.
10.009 (2016).
18. McNutt, E. J., Zipfel, B. & DeSilva, J. M. The evolution of the human foot. Evol. Anthropol. 27, 197–217. https://doi.org/10.1002/
evan.21713 (2018).
19. Kidd, R. Evolution of the rearfoot. A model of adaptation with evidence from the fossil record. J. Am. Podiatr. Med. Assoc. 89,
2–17. https://doi.org/10.7547/87507315-89-1-2 (1999).
20. Cant, J. G. H. Positional behavior of female Bornean orangutans (Pongo pygmaeus). Am. J. Primatol. 12, 71–90. https://doi.org/10.
1002/ajp.1350120104 (1987).
21. Doran, D. M. Ontogeny of locomotion in mountain gorillas and chimpanzees. J. Hum. Evol. 32, 323–344. https://doi.org/10.1006/
jhev.1996.0095 (1997).
22. Hunt, K. D. Positional behavior of Pan troglodytes in the Mahale Mountains and Gombe Stream National Parks, Tanzania. Am. J.
Phys. Anthropol. 87, 83–105. https://doi.org/10.1002/ajpa.1330870108 (1992).
23. Remis, M. J. Feeding ecology and positional behavior of western lowland gorillas (Gorilla gorilla gorilla) in the Central African
Republic. PhD thesis (Yale University, 1994).
24. Thorpe, S. K. & Crompton, R. H. Locomotor ecology of wild orangutans (Pongo pygmaeus abelii) in the Gunung Leuser Ecosystem,
Sumatra, Indonesia: A multivariate analysis using log-linear modelling. Am. J. Phys. Anthropol. 127, 58–78. https://doi.org/10.
1002/ajpa.20151 (2005).
25. Thorpe, S. K. & Crompton, R. H. Orangutan positional behavior and the nature of arboreal locomotion in Hominoidea. Am. J.
Phys. Anthropol. 131, 384–401. https://doi.org/10.1002/ajpa.20422 (2006).
26. DeSilva, J. M. et al. Special issue. Australopithecus sediba: The anatomy of the lower limb skeleton of Australopithecus sediba.
PaleoAnthropology 2018, 357–405 (2018).
27. Harcourt-Smith, W. Form and function in the hominoid tarsal skeleton. PhD thesis (University College London, 2002).
28. Harper, C. M., Ruff, C. B. & Sylvester, A. D. Gorilla calcaneal morphological variation and ecological divergence. Am. J. Phys.
Anthropol. 174, 49–65. https://doi.org/10.1002/ajpa.24135 (2021).
29. Ogihara, N. et al. Development of an anatomically based whole-body musculoskeletal model of the Japanese macaque (Macaca
fuscata). Am. J. Phys. Anthropol. 139, 323–338. https://doi.org/10.1002/ajpa.20986 (2009).
30. Bookstein, F. L. Principal warps: thin-plate splines and the decomposition of deformations. IEEE Trans. Pattern Anal. Machine
Intell. 11, 567–585. https://doi.org/10.1109/34.24792 (1989).
31. Gunz, P., Mitteroecker, P. & Bookstein, F. L. Semilandmarks in three dimensions in Modern Morphometrics in Physical Anthropol-
ogy (ed. Slice, D. E.) 73–98 (Kluwer Academic/Plenum, 2005).
32. Gunz, P. & Mitteroecker, P. Semilandmarks: a method for quantifying curves and surfaces. Hystrix 24, 103–109. https://doi.org/
10.4404/hystrix-24.1-6292 (2013).
Scientific Reports | (2021) 11:20889 | https://doi.org/10.1038/s41598-021-99942-1 10
Vol:.(1234567890)www.nature.com/scientificreports/
33. Adams, D. C., Rohlf, F. J. & Slice, D. E. Geometric morphometrics: Ten years of progress following the ‘revolution’. Ital. J. Zool. 71,
5–16. https://doi.org/10.1080/11250000409356545 (2004).
34. O’Higgins, P. The study of morphological variation in the hominid fossil record: biology, landmarks and geometry. J. Anat. 197,
103–120. https://doi.org/10.1046/j.1469-7580.2000.19710103.x (2000).
35. Slice, D. E. Modern morphometrics in Modern Morphometrics in Physical Anthropology (ed. Slice, D. E.) 1–45 (Kluwer Academic/
Plenum, 2005).
36. Goodall, C. Procrustes methods in the statistical analysis of shape. J. R. Stat. Soc. Ser. B Methodol. 53, 285–321. https://doi.org/10.
1111/j.2517-6161.1991.tb01825.x (1991).
37. Gower, J. C. Generalized Procrustes analysis. Psychometrika 40, 33–51. https://doi.org/10.1007/BF02291478 (1975).
38. Rohlf, F. J. & Slice, D. Extensions of the Procrustes method for the optimal superimposition of landmarks. Syst. Zool. 39, 40–59.
https://doi.org/10.2307/2992207 (1990).
39. R Core Team. R: A Language and Environment for Statistical Computing (R Foundation for Statistical Computing, Vienna, Austria,
2016).
40. DeSilva, J. M. Functional morphology of the ankle and the likelihood of climbing in early hominins. Proc. Natl Acad. Sci. USA
106, 6567–6572. https://doi.org/10.1073/pnas.0900270106 (2009).
41. Sarmiento, E. E. The significance of the heel process in anthropoids. Int. J. Primatol. 4, 127–152. https://doi.org/10.1007/BF027
43754 (1983).
42. Farris, D. J., Kelly, L. A., Cresswell, A. G. & Lichtwark, G. A. The functional importance of human foot muscles for bipedal locomo-
tion. Proc. Natl Acad. Sci. USA 116, 1645–1650. https://doi.org/10.1073/pnas.1812820116 (2019).
43. Wareing, K. A. Adaptation of the non-human great ape lower limb in response to locomotor behaviour. PhD thesis (University of
Liverpool, 2016).
44. Sichting, F., Holowka, N. B., Ebrecht, F. & Lieberman, D. E. Evolutionary anatomy of the plantar aponeurosis in primates, including
humans. J. Anat. 237, 85–104. https://doi.org/10.1111/joa.13173 (2020).
45. Levens, A. S., Inman, V. T. & Blosser, J. A. Transverse rotation of the segments of the lower extremity in locomotion. J. Bone Joint
Surg. Am. 30A, 859–872. https://doi.org/10.2106/00004623-194830040-00006 (1948).
46. Pohl, M. B., Messenger, N. & Buckley, J. G. Forefoot, rearfoot and shank coupling: Effect of variations in speed and mode of gait.
Gait Posture 25, 295–302. https://doi.org/10.1016/j.gaitpost.2006.04.012 (2007).
47. Stacoff, A. et al. Movement coupling at the ankle during the stance phase of running. Foot Ankle Int. 21, 232–239. https://doi.org/
10.1177/107110070002100309 (2000).
48. Wright, D. G., Desai, S. M. & Henderson, W. H. Action of the subtalar and ankle-joint complex during the stance phase of walking.
J. Bone Joint Surg. Am. 46, 361–382. https://doi.org/10.2106/00004623-196446020-00010 (1964).
49. Ito, K. et al. Three-dimensional innate mobility of the human foot bones under axial loading using biplane X-ray fluoroscopy. R.
Soc. Open Sci. 4, 171086. https://doi.org/10.1098/rsos.171086 (2017).
Acknowledgements
The authors thank the staff of Himeji Central Park, Fukuoka City Zoological Garden, Kobe Oji Zoo, Yagiyama
Zoological Park, Higashiyama Zoo and Botanical Garden, Osaka Tennoji Zoo, Hamamatsu City Zoo, Tobe
Zoological Park of Ehime Pref., Komoro City Zoo, and Hitachi City Kamine Zoo, and the Great Ape Information
Network for the great apes. Permission to use the materials was obtained from the Primate Research Institute,
Kyoto University. CT scans of tali of three Mahale chimpanzees and 10 humans were provided for this analysis
by the University Museum, University of Tokyo. CT scans of tali of two orangutans and seven Japanese macaques
were provided for this analysis by the Laboratory of Physical Anthropology, Kyoto University. Permission to use
the data was also obtained from the respective institutions. The authors also thank MorphoSource for providing
the remaining gorilla and orangutan samples. This study was supported by Grants-in-Aid for Scientific Research
from the Japan Society for the Promotion of Science (Grant Nos. 20H05462, 19J00277) and the Cooperation
Research Program of the Primate Research Institute, Kyoto University.
Author contributions
S.N. and N.O. conceived and designed the study. M.O. corrected the data and S.N. and H.A. performed the data
analysis. S.N., H.A., and N.O. drafted the manuscript, and all authors edited and approved the manuscript prior
to submission.
Competing interests
The authors declare no competing interests.
Additional information
Supplementary Information The online version contains supplementary material available at https://doi.org/
10.1038/s41598-021-99942-1.
Correspondence and requests for materials should be addressed to S.N. or N.O.
Reprints and permissions information is available at www.nature.com/reprints.
Publisher’s note Springer Nature remains neutral with regard to jurisdictional claims in published maps and
institutional affiliations.
Scientific Reports | (2021) 11:20889 | https://doi.org/10.1038/s41598-021-99942-1 11
Vol.:(0123456789)www.nature.com/scientificreports/
Open Access This article is licensed under a Creative Commons Attribution 4.0 International
License, which permits use, sharing, adaptation, distribution and reproduction in any medium or
format, as long as you give appropriate credit to the original author(s) and the source, provide a link to the
Creative Commons licence, and indicate if changes were made. The images or other third party material in this
article are included in the article’s Creative Commons licence, unless indicated otherwise in a credit line to the
material. If material is not included in the article’s Creative Commons licence and your intended use is not
permitted by statutory regulation or exceeds the permitted use, you will need to obtain permission directly from
the copyright holder. To view a copy of this licence, visit http://creativecommons.org/licenses/by/4.0/.
© The Author(s) 2021
Scientific Reports | (2021) 11:20889 | https://doi.org/10.1038/s41598-021-99942-1 12
Vol:.(1234567890)You can also read