MEDSEA_ANALYSIS_FORECAST_PHYS_006_013 - Mediterranean Sea Production Centre
←
→
Page content transcription
If your browser does not render page correctly, please read the page content below

Mediterranean Sea Production Centre
         MEDSEA_ANALYSIS_FORECAST_PHYS_006_013

                                                                 Issue: 1.2

Contributors: E. Clementi, A. Grandi, R. Escudier, Vladyslav Lyubartsev

Approval date by the CMEMS product quality coordination team: 30/04/19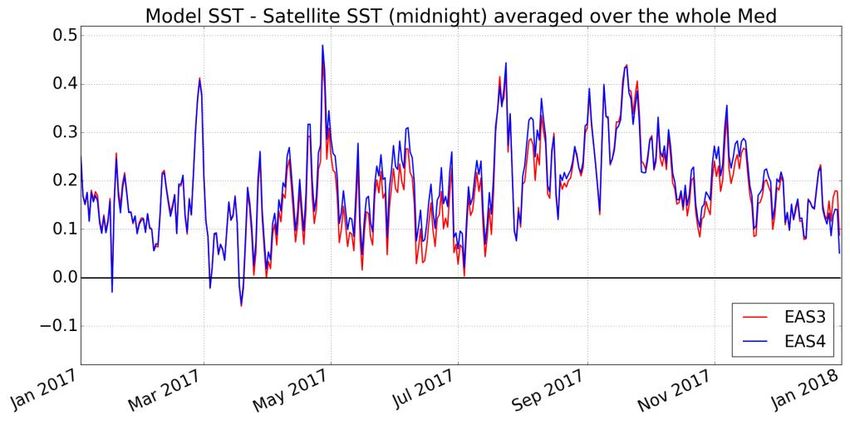
QUID for MED MFC Product                              Ref:      CMEMS-MED-QUID-006-013
  MEDSEA_ANALYSIS_FORECAST_PHY_006_013                       Date:      28 January 2019
                                                            Issue:      1.2

                                      CHANGE RECORD

 When the quality of the products changes, the QuID is updated and a row is added to this table. The
 third column specifies which sections or sub-sections have been updated. The fourth column should
 mention the version of the product to which the change applies.

Issue   Date         §     Description of Change        Author                   Validated By

1.0     25-09-2017   All   Release of EAS2 version of   E. Clementi , A.
                           the Med-Currents analysis    Grandi, P. DiPietro, ,
                           and forecast product at      J. Pistoia, D.
                           1/24° resolution             Delrosso, G. Mattia

1.1     18-01-2018   All   Release of EAS3 version of   E. Clementi , A.
                           the Med-Currents analysis    Grandi, P. DiPietro, ,
                           and forecast product at      J. Pistoia, D.
                           1/24° resolution             Delrosso, G. Mattia

1.2     28-01-2019   All   Release of EAS4 version of   E. Clementi , A.         Mercator Ocean
                           the Med-Currents analysis    Grandi, R. Escudier,
                           and forecast product at      Vladyslav Lyubartsev
                           1/24° resolution

                                                                                                  Page 2/ 58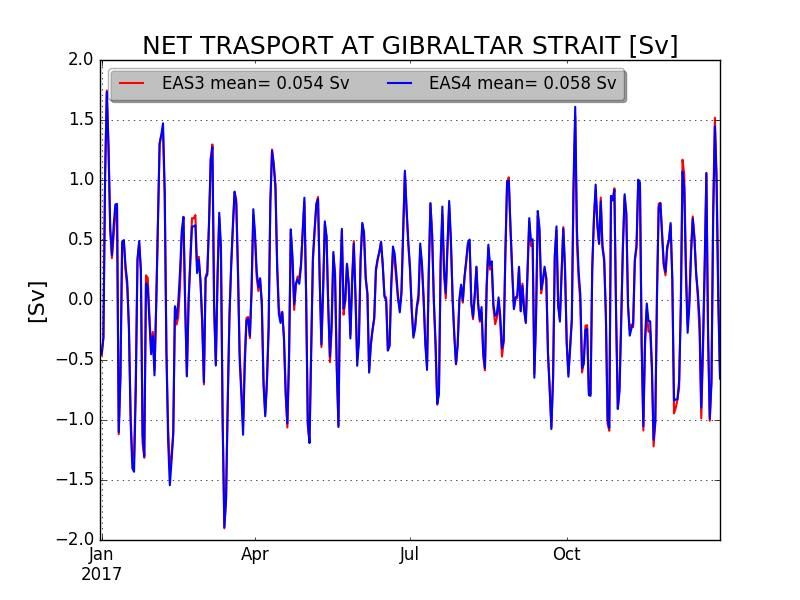
QUID for MED MFC Product                                                                    Ref:            CMEMS-MED-QUID-006-013
     MEDSEA_ANALYSIS_FORECAST_PHY_006_013                                                            Date:             28 January 2019
                                                                                                    Issue:             1.2

                                                             TABLE OF CONTENTS
I         Executive summary ..................................................................................................................................... 4
      I.1 Products covered by this document ........................................................................................................... 4
      I.2 Summary of the results .............................................................................................................................. 4
      I.3 Estimated Accuracy Numbers ..................................................................................................................... 5

II        Production system description .................................................................................................................. 10
      II.1 Description of the Med-Currents EAS4 model system ............................................................................. 11
      II.2 New features of the Med-Currents EAS4 system ..................................................................................... 14
      II.3 Upstream data and boundary condition of the NEMO-3DVAR system .................................................... 15

III       Validation framework ............................................................................................................................... 17

Validation results .............................................................................................................................................. 24
      III.1 Temperature .......................................................................................................................................... 24
      III.2 Seabed Temperature.............................................................................................................................. 32
      III.3 Salinity ................................................................................................................................................... 35
      III.4 Sea Level Anomaly ................................................................................................................................. 41
      III.5 Currents ................................................................................................................................................. 44
      III.6 Mixed Layer Depth ................................................................................................................................. 46

IV        System’s Noticeable events, outages or changes ...................................................................................... 49

V         Quality changes since previous version ..................................................................................................... 50

VI        References ................................................................................................................................................ 51

                                                                                                                                                                        Page 3/ 58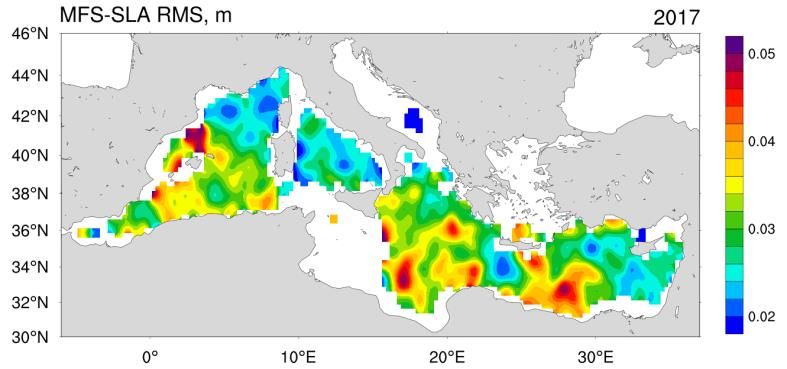
QUID for MED MFC Product Ref: CMEMS-MED-QUID-006-013
MEDSEA_ANALYSIS_FORECAST_PHY_006_013 Date: 28 January 2019
Issue: 1.2
I EXECUTIVE SUMMARY
I.1 Products covered by this document
The product covered by this document is the MEDSEA_ANALYSIS_FORECAST_PHY_006_013: the
analysis and forecast nominal product of the physical component of the Mediterranean Sea with 1/24°
(~4.5 km) horizontal resolution and 141 vertical levels.
The variables produced are:
3D daily, hourly and monthly mean fields of: Potential Temperature, Salinity, Zonal and Meridional
Velocity
2D daily, hourly and monthly mean fields of: Sea Surface Height, Mixed Layer Depth, Sea Bed
Temperature (temperature of the deepest layer or level)
Product reference:
Clementi E., Pistoia J., Escudier R., Delrosso D., Drudi M., Grandi A., Lecci R., Cretí S., Ciliberti S.,
Coppini, G. Masina S. & N. Pinardi (2019). Mediterranean Sea Analysis and Forecast (CMEMS MED-
Currents 2016-2019) (Version 1) [Data set]. Copernicus Monitoring Environment Marine Service
(CMEMS). https://doi.org/10.25423/CMCC/MEDSEA_ANALYSIS_FORECAST_PHY_006_013_EAS4
I.2 Summary of the results
The quality of the MEDSEA_ANALYSIS_FORECAST_PHY_006_013 analysis and forecast product
provided by the EAS4 modeling system, is assessed over 1 year period from 01/01/2017 to 31/12/2017
by means of temperature, salinity, sea level anomaly, sea surface height, currents, seabed
temperature and mixed layer depth using independent (for surface currents), quasi-independent
satellite and in-situ observations, climatological datasets as well as the inter-comparison with the
previous MEDSEA_ANALYSIS_FORECAST_PHY_006_013 product timeseries corresponding to the EAS3
modeling system.
The main results of the MEDSEA_ANALYSIS_FORECAST_PHY_006_013 quality assessment are
summarized below:
Sea Surface Height: the EAS4 system presents a similar accuracy in terms of sea surface height
representation with respect to the previous version. The quality of the predicted SLA has been
assessed by considering the RMS of misfits between the model and the satellite along track
observations. The new system presents a SLA skill similar to the one of the previous system with an
averaged RMS misfit of about 4cm.
Temperature: the temperature is accurate with an error below 0.8oC when comparing to vertical in-
situ observations at surface and below 0.7oC when comparing SST to satellite observations. The
accuracy of the temperature along the water column presents higher RMS differences at first layers,
which decreases below 60 m. Considering the SST, the RMS differences with respect to satellite
Page 4/ 58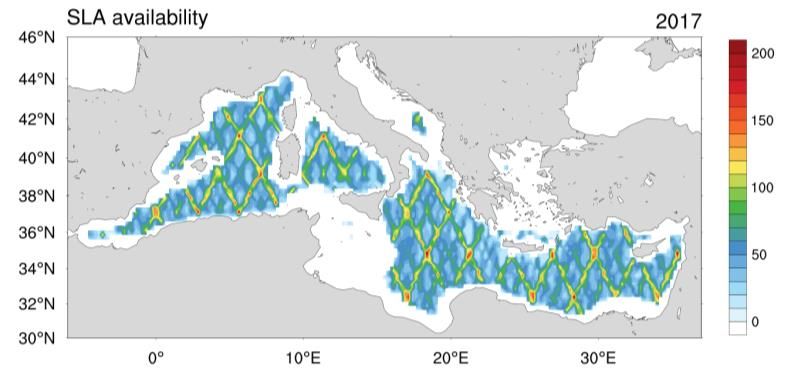
QUID for MED MFC Product Ref: CMEMS-MED-QUID-006-013
MEDSEA_ANALYSIS_FORECAST_PHY_006_013 Date: 28 January 2019
Issue: 1.2
observations vary according to the different areas of the basin, ranging from 0.5oC to 0.7oC. The MED-
Currents products usually have a warm SST bias. Med-Currents EAS3 and EAS4 systems exhibit similar
skill in terms of surface temperature when comparing with satellite.
Salinity: the salinity is accurate with RMS values lower than 0.19 PSU. The error is higher in the first
layers and decreases significantly below 150 m. The EAS3 and EAS4 systems present very similar skill in
predicting the salinity.
Currents: Surface currents RMS and bias are evaluated with respect to moored buoys in coastal areas
and due to the low number of observations mainly located in coastal areas the statistical relevance of
currents performance is poor. In addition to the surface currents validation assessment, a derived
validation assessment is provided in terms of transport at Straits including the net, eastward and
westward transport through the Strait of Gibraltar showing a good agreement with literature values.
Bottom temperature: the bottom temperature of EAS4 system has been compared to SeaDataNet
monthly climatologies showing a good skill in representing the seasonal variability of the temperature
at deepest level and a general overestimation with respect to the climatological dataset. The spatial
pattern of the seabed temperature is correctly represented by the system.
Mixed Layer Depth: the MLD predicted by EAS4 system has been compared to climatological values
from literature (Houpert at al., 2015) showing that the model is able to correctly represent the depth
of the mixed layer with spatial and seasonal differences. In general, it can be noticed that the main
differences could arise from the low resolution of the climatological dataset that moreover do not
cover the whole domain of the Mediterranean Sea.
I.3 Estimated Accuracy Numbers
Estimated Accuracy Numbers (EANs), that are the mean and the RMS of the difference between the
model and in-situ or satellite reference observations, are provided in the following table.
EAN are computed for:
Temperature;
Salinity;
Sea Surface Temperature (SST).
Sea Level Anomaly (SLA)
The observations used are:
vertical profiles of temperature and salinity from Argo, XBTs and Gliders floats:
INSITU_MED_TS_NRT_OBSERVATIONS_013_035
SST satellite data from Copernicus OSI-TAC product:
SST_MED_SST_L4_NRT_OBSERVATIONS_010_004
Satellite Sea Level along track data from Copernicus SL-TAC product:
SEALEVEL_MED_SLA_L3_NRT_OBSERVATIONS_008_019
SEALEVEL_MED_SLA_ASSIM_L3_NRT_OBSERVATIONS_008_021
Page 5/ 58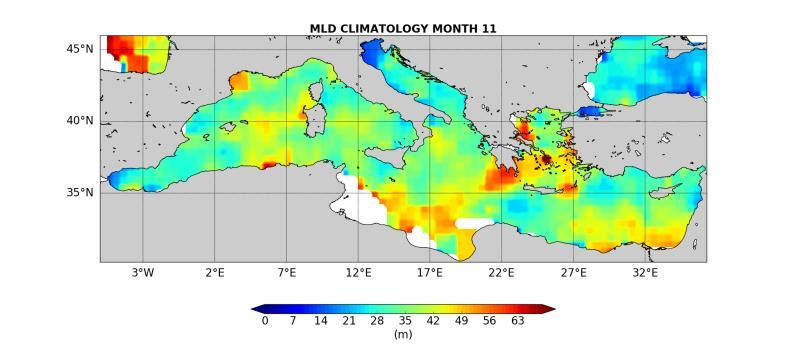
QUID for MED MFC Product                                   Ref:      CMEMS-MED-QUID-006-013
 MEDSEA_ANALYSIS_FORECAST_PHY_006_013                           Date:       28 January 2019
                                                                Issue:      1.2

The EANs are evaluated for the EAS3 and EAS4 systems over 1 year period from January to December
2017 and are computed over 9 vertical layers (for temperature and salinity) and for the Mediterranean
Sea and 16 sub-regions Figure 1: (1) Alboran Sea, (2) South West Med 1 (western part), (3) North West
Med, (4) South West Med 2 (eastern part), (5) Tyrrhenian Sea 2 (southern part), (6) Tyrrhenian Sea 1
(northern part), (7) Ionian Sea 1 (western part), (8) Ionian Sea 2 (south-eastern part), (9) Ionian Sea 2
(north-eastern part), (10) Adriatic Sea 2 (southern part), (11) Adriatic Sea 1 (northern part), (12)
Levantine Sea 1 (western part), (13) Aegean Sea, (14) Levantine Sea 2 (central-northern part), (15)
Levantine Sea 3 (central southern part), (16) Levantine Sea 4 (eastern part).

                Figure 1. The Mediterranean Sea sub-regions subdivision for validation metrics

EANs of temperature and salinity are then evaluated at 9 different layers: 0-10, 10-30, 30-60, 60-100,
100-150, 150-300, 300-600, 600-1000, 1000-2000 [m] in order to better verify the model ability to
represent the vertical structure of the temperature and salinity fields.
In the following tables the EANs (Mean and RMS Difference) for the EAS4 system are presented:

                                                                                                       Page 6/ 58
QUID for MED MFC Product                                           Ref:       CMEMS-MED-QUID-006-013
 MEDSEA_ANALYSIS_FORECAST_PHY_006_013                                    Date:       28 January 2019
                                                                         Issue:      1.2

           T prod - T ref [oC]                                    EAS4 system
                                                     Mean                                  RMSD
               Layer (m)               T-m-D-CLASS4-PROF-BIAS-           T-m-D-CLASS4-PROF-RMSD-
                                              Jan2017-Dec2017                        Jan2017-Dec2017
                  0-10                               0.04                                  0.54
                 10-30                               0.01                                  0.77
                 30-60                               0.08                                  0.72
                 60-100                              0.05                                  0.50
                100-150                              0.02                                  0.34
                150-300                              -0.01                                 0.28
                300-600                              -0.02                                 0.23
               600-1000                              0.01                                  0.10
               1000-2000                             -0.01                                 0.05
Table 1: EANs of temperature at different vertical layers evaluated for EAS4 system for the year 2017: T-m-
D-CLASS4-PROF-BIAS-Jan2017-Dec2017, T-m-D-CLASS4-PROF-RMSD-Jan2017-Dec2017 specified in Table 7:
     List of metrics for Med-Currents evaluation using in-situ and satellite observation (continues overleaf).

Name                    Description                   Ocean parameter     Supporting reference dataset                     Quantity

NRT evaluation of Med-MFC-Currents using semi-independent data: Estimate Accuracy Numbers
S-m-D-CLASS4-      Salinity vertical profiles    Salinity            Argo floats from the Copernicus INSITU TAC       Salinity daily me
PROF-BIAS-Jan2017-      comparison           with                         products:                                        observations avera
Dec2017                 Copernicus INSITU TAC                             INSITU_MED_NRT_OBSERVATIONS_013_035              Dec 2017).
                        data at 9 layers for the                                                                           This quantity is eva
                        Mediterranean basin.                                                                               The statistics are d
                                                                                                                           evaluated for 9 dif
                                                                                                                           150, 150-300, 300
SLA-D-CLASS4-ALT-       Sea level anomaly             Sea        Level    Satellite Sea Level along track data from        Sea level daily R
RMSD-Jan2017-           comparison           with     Anomaly             Copernicus Sea Level TAC product:                satellite observati
Dec2017                 Copernicus Sea Level                              SEALEVEL_MED_SLA_L3_NRT_OBSERVATIONS_            period (Jan-Dec 20
                        TAC (satellite along                              008_019                                          This quantity is eva
                        track) data for the                               SEALEVEL_MED_SLA_ASSIM_L3_NRT_OBSERV             The statistics are
                        Mediterranean       basin                         ATIONS_008_021                                   selected sub-basin
                        and      selected    sub-
                        basins.
SST-D-CLASS4-RAD-       Sea               Surface     Sea      Surface    SST satellite data from Copernicus OSI TAC L4    Sea surface tempe
RMSD-Jan2017-           Temperature                   Temperature         product:                                         model and satellit
Dec2017                 comparison with SST                               SST_MED_SST_L4_NRT_OBSERVATIONS_010_0            testing period (Jan
                        Copernicus OSI TAC L4                             04                                               This quantity is eva
                        (satellite) data for the                                                                           The statistics are
                        Mediterranean       basin                                                                          selected sub-basin
                        and      selected    sub-
                        basins.
SST-D-CLASS4-RAD-       Sea               Surface     Sea      Surface    SST satellite data from Copernicus OSI TAC L4    Sea surface tempe
BIAS-Jan2017-Dec2017    Temperature                   Temperature         product:                                         and satellite obser
                        comparison with SST                               SST_MED_SST_L4_NRT_OBSERVATIONS_010_0            period (Jan-Dec 20
                        Copernicus OSI TAC L4                             04                                               This quantity is eva
                        (satellite) data for the                                                                           The statistics are
                        Mediterranean       basin                                                                          selected sub-basin
                        and      selected    sub-

                                                                                                                          Page 7/ 58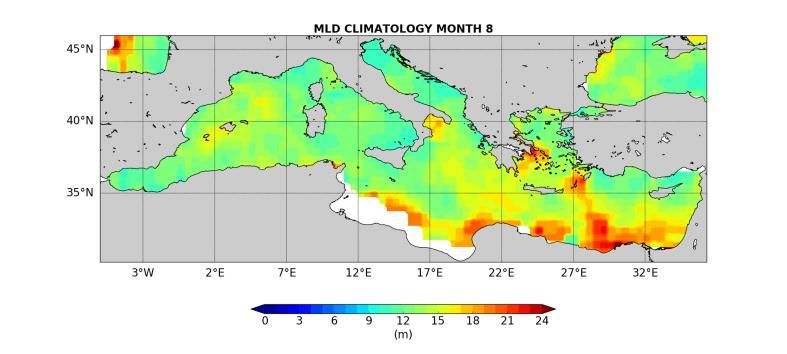
QUID for MED MFC Product                                                 Ref:       CMEMS-MED-QUID-006-013
 MEDSEA_ANALYSIS_FORECAST_PHY_006_013                                      Date:           28 January 2019
                                                                           Issue:          1.2

                         basins.

       Table 8: (continued) List of metrics for Med-Currents evaluation using in-situ and satellite observation.

Name                     Description                 Ocean parameter        Supporting reference dataset                    Quantity

                                                               .

           SST prod – SST ref [oC]      EAS4 system

                                                      Mean                                       RMSD
                   REGION
                                        SST-D-CLASS4-RAD-BIAS-Jan2017-Dec2017      SST-D-CLASS4-RAD-RMSD-Jan2017-Dec2017

                   MED SEA                              0.26                                      0.59
                  REGION 1                             0.02                                       0.64
                  REGION 2                             0.13                                       0.53
                  REGION 3                             0.06                                       0.59
                  REGION 4                             0.19                                       0.49
                  REGION 5                             0.41                                       0.62
                  REGION 6                             0.33                                       0.59
                  REGION 7                             0.39                                       0.59
                  REGION 8                             0.26                                       0.55
                  REGION 9                             0.32                                       0.58
                  REGION 10                            0.48                                       0.70
                  REGION 11                            0.38                                       0.70
                  REGION 12                            -0.03                                      0.52
                  REGION 13                            0.21                                       0.59
                  REGION 14                            0.43                                       0.72
                  REGION 15                            0.23                                       0.55
                  REGION 16                            0.42                                       0.63
 Table 2: EANs of Sea Surface Temperature evaluated for EAS4 system for the year 2017 for the Mediterranean
Sea and 16 regions (see Figure 1): SST-D-CLASS4-RAD-BIAS-Jan2017-Dec2017, SST-D-CLASS4-RAD-RMSD-Jan2017-
 Dec2017 specified in Table 7: List of metrics for Med-Currents evaluation using in-situ and satellite observation
                                                (continues overleaf).

Name                     Description                 Ocean parameter        Supporting reference dataset                    Quantity

NRT evaluation of Med-MFC-Currents using semi-independent data: Estimate Accuracy Numbers

                                                                                                                           Page 8/ 58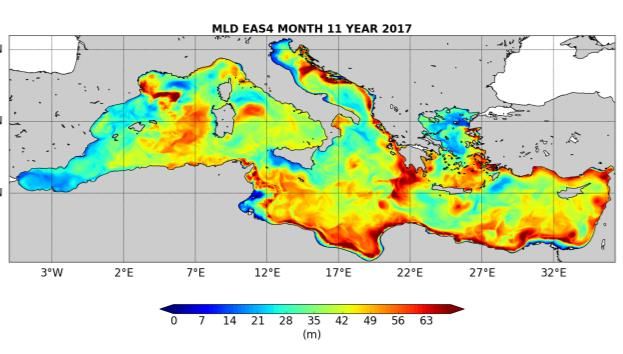
QUID for MED MFC Product                                                  Ref:        CMEMS-MED-QUID-006-013
 MEDSEA_ANALYSIS_FORECAST_PHY_006_013                                          Date:         28 January 2019
                                                                               Issue:        1.2

S-m-D-CLASS4-       Salinity vertical profiles   Salinity                  Argo floats from the Copernicus INSITU TAC       Salinity daily me
PROF-BIAS-Jan2017-       comparison           with                              products:                                        observations avera
Dec2017                  Copernicus INSITU TAC                                  INSITU_MED_NRT_OBSERVATIONS_013_035              Dec 2017).
                         data at 9 layers for the                                                                                This quantity is eva
                         Mediterranean basin.                                                                                    The statistics are d
                                                                                                                                 evaluated for 9 dif
                                                                                                                                 150, 150-300, 300
SLA-D-CLASS4-ALT-        Sea level anomaly            Sea              Level    Satellite Sea Level along track data from        Sea level daily R
RMSD-Jan2017-            comparison           with    Anomaly                   Copernicus Sea Level TAC product:                satellite observati
Dec2017                  Copernicus Sea Level                                   SEALEVEL_MED_SLA_L3_NRT_OBSERVATIONS_            period (Jan-Dec 20
                         TAC (satellite along                                   008_019                                          This quantity is eva
                         track) data for the                                    SEALEVEL_MED_SLA_ASSIM_L3_NRT_OBSERV             The statistics are
                         Mediterranean       basin                              ATIONS_008_021                                   selected sub-basin
                         and      selected    sub-
                         basins.
SST-D-CLASS4-RAD-        Sea               Surface    Sea      Surface          SST satellite data from Copernicus OSI TAC L4    Sea surface tempe
RMSD-Jan2017-            Temperature                  Temperature               product:                                         model and satellit
Dec2017                  comparison with SST                                    SST_MED_SST_L4_NRT_OBSERVATIONS_010_0            testing period (Jan
                         Copernicus OSI TAC L4                                  04                                               This quantity is eva
                         (satellite) data for the                                                                                The statistics are
                         Mediterranean       basin                                                                               selected sub-basin
                         and      selected    sub-
                         basins.
SST-D-CLASS4-RAD-        Sea               Surface    Sea      Surface          SST satellite data from Copernicus OSI TAC L4    Sea surface tempe
BIAS-Jan2017-Dec2017     Temperature                  Temperature               product:                                         and satellite obser
                         comparison with SST                                    SST_MED_SST_L4_NRT_OBSERVATIONS_010_0            period (Jan-Dec 20
                         Copernicus OSI TAC L4                                  04                                               This quantity is eva
                         (satellite) data for the                                                                                The statistics are
                         Mediterranean       basin                                                                               selected sub-basin
                         and      selected    sub-
                         basins.

       Table 8: (continued) List of metrics for Med-Currents evaluation using in-situ and satellite observation.

Name                     Description                  Ocean parameter           Supporting reference dataset                     Quantity

                                                                 .

                              S prod – S ref [PSU]                          EAS4 system
                                                                       Mean               RMSD
                                                                      S-m-D-         S-m-D-
                                       Layer (m)                     CLASS4-PROF-        CLASS4-PROF-
                                                                     BIAS-Jan2017-      RMSD-Jan2017-
                                                                        Dec2017             Dec2017

                                         0-10                          -0.01                0.2
                                        10-30                          -0.02                0.2
                                        30-60                          -0.02               0.19
                                        60-100                         -0.02               0.16
                                       100-150                         -0.01               0.13
                                       150-300                          0.00               0.07
                                       300-600                         -0.01               0.05
                                       600-1000                        -0.02               0.04

                                                                                                                                Page 9/ 58
QUID for MED MFC Product                                                  Ref:         CMEMS-MED-QUID-006-013
 MEDSEA_ANALYSIS_FORECAST_PHY_006_013                                        Date:            28 January 2019
                                                                             Issue:           1.2

                                       1000-2000                     -0.01                  0.03
Table 3: EANs of salinity at different vertical layers evaluated for EAS4 system for year 2017: S-m-D-CLASS4-
 PROF-BIAS-Jan2017-Dec 2017, S-m-D-CLASS4-PROF-RMSD-Jan2017-Dec 2017 specified in Table 7: List of
         metrics for Med-Currents evaluation using in-situ and satellite observation (continues overleaf).

Name                     Description                  Ocean parameter         Supporting reference dataset                     Quantity

NRT evaluation of Med-MFC-Currents using semi-independent data: Estimate Accuracy Numbers
S-m-D-CLASS4-       Salinity vertical profiles   Salinity                Argo floats from the Copernicus INSITU TAC       Salinity daily me
PROF-BIAS-Jan2017-       comparison           with                            products:                                        observations avera
Dec2017                  Copernicus INSITU TAC                                INSITU_MED_NRT_OBSERVATIONS_013_035              Dec 2017).
                         data at 9 layers for the                                                                              This quantity is eva
                         Mediterranean basin.                                                                                  The statistics are d
                                                                                                                               evaluated for 9 dif
                                                                                                                               150, 150-300, 300
SLA-D-CLASS4-ALT-        Sea level anomaly            Sea            Level    Satellite Sea Level along track data from        Sea level daily R
RMSD-Jan2017-            comparison           with    Anomaly                 Copernicus Sea Level TAC product:                satellite observati
Dec2017                  Copernicus Sea Level                                 SEALEVEL_MED_SLA_L3_NRT_OBSERVATIONS_            period (Jan-Dec 20
                         TAC (satellite along                                 008_019                                          This quantity is eva
                         track) data for the                                  SEALEVEL_MED_SLA_ASSIM_L3_NRT_OBSERV             The statistics are
                         Mediterranean       basin                            ATIONS_008_021                                   selected sub-basin
                         and      selected    sub-
                         basins.
SST-D-CLASS4-RAD-        Sea               Surface    Sea      Surface        SST satellite data from Copernicus OSI TAC L4    Sea surface tempe
RMSD-Jan2017-            Temperature                  Temperature             product:                                         model and satellit
Dec2017                  comparison with SST                                  SST_MED_SST_L4_NRT_OBSERVATIONS_010_0            testing period (Jan
                         Copernicus OSI TAC L4                                04                                               This quantity is eva
                         (satellite) data for the                                                                              The statistics are
                         Mediterranean       basin                                                                             selected sub-basin
                         and      selected    sub-
                         basins.
SST-D-CLASS4-RAD-        Sea               Surface    Sea      Surface        SST satellite data from Copernicus OSI TAC L4    Sea surface tempe
BIAS-Jan2017-Dec2017     Temperature                  Temperature             product:                                         and satellite obser
                         comparison with SST                                  SST_MED_SST_L4_NRT_OBSERVATIONS_010_0            period (Jan-Dec 20
                         Copernicus OSI TAC L4                                04                                               This quantity is eva
                         (satellite) data for the                                                                              The statistics are
                         Mediterranean       basin                                                                             selected sub-basin
                         and      selected    sub-
                         basins.

       Table 8: (continued) List of metrics for Med-Currents evaluation using in-situ and satellite observation.

Name                     Description                  Ocean parameter         Supporting reference dataset                     Quantity

                                                                 .

                  SLA prod – SLA ref                  EAS3 system                             EAS4 system
                        [cm]
                                                          RMSD                                      RMSD
                        REGION                  SLA-D-CLASS4-ALT-RMSD-Jan2017-          SLA-D-CLASS4-ALT-RMSD-Jan2017-
                                                           Dec2017                                 Dec2017

                                                                                                                              Page 10/ 58
QUID for MED MFC Product Ref: CMEMS-MED-QUID-006-013
MEDSEA_ANALYSIS_FORECAST_PHY_006_013 Date: 28 January 2019
Issue: 1.2
MED SEA 3.9 3.9
REGION 1 4.3 5.0
REGION 2 4.4 4.1
REGION 3 3.7 3.6
REGION 4 3.8 3.9
REGION 5 3.1 3.1
REGION 6 4.0 3.9
REGION 7 4.6 4.5
REGION 8 4.0 4.2
REGION 9 3.6 3.8
REGION 10 2.3 2.2
REGION 11 NA NA
REGION 12 4.3 4.4
REGION 13 3.7 3.6
REGION 14 3.6 3.5
REGION 15 4.7 4.7
REGION 16 3.4 3.4
Table 4: EANs of Sea Level evaluated for EAS3 and EAS4 systems for year 2017 for the Mediterranean Sea and 16
regions (see Figure 1): SLA-D-CLASS4-ALT-RMSD-Jan2017-Dec 2017 see Table 7: List of metrics for Med-Currents
evaluation using in-situ and satellite observation (continues overleaf).
Name Description Ocean parameter Supporting reference dataset Quantity
NRT evaluation of Med-MFC-Currents using semi-independent data: Estimate Accuracy Numbers
S-m-D-CLASS4- Salinity vertical profiles Salinity Argo floats from the Copernicus INSITU TAC Salinity daily me
PROF-BIAS-Jan2017- comparison with products: observations avera
Dec2017 Copernicus INSITU TAC INSITU_MED_NRT_OBSERVATIONS_013_035 Dec 2017).
data at 9 layers for the This quantity is eva
Mediterranean basin. The statistics are d
evaluated for 9 dif
150, 150-300, 300
SLA-D-CLASS4-ALT- Sea level anomaly Sea Level Satellite Sea Level along track data from Sea level daily R
RMSD-Jan2017- comparison with Anomaly Copernicus Sea Level TAC product: satellite observati
Dec2017 Copernicus Sea Level SEALEVEL_MED_SLA_L3_NRT_OBSERVATIONS_ period (Jan-Dec 20
TAC (satellite along 008_019 This quantity is eva
track) data for the SEALEVEL_MED_SLA_ASSIM_L3_NRT_OBSERV The statistics are
Mediterranean basin ATIONS_008_021 selected sub-basin
and selected sub-
basins.
SST-D-CLASS4-RAD- Sea Surface Sea Surface SST satellite data from Copernicus OSI TAC L4 Sea surface tempe
RMSD-Jan2017- Temperature Temperature product: model and satellit
Dec2017 comparison with SST SST_MED_SST_L4_NRT_OBSERVATIONS_010_0 testing period (Jan
Copernicus OSI TAC L4 04 This quantity is eva
(satellite) data for the The statistics are
Mediterranean basin selected sub-basin
and selected sub-
basins.
Page 11/ 58QUID for MED MFC Product Ref: CMEMS-MED-QUID-006-013
MEDSEA_ANALYSIS_FORECAST_PHY_006_013 Date: 28 January 2019
Issue: 1.2
SST-D-CLASS4-RAD- Sea Surface Sea Surface SST satellite data from Copernicus OSI TAC L4 Sea surface tempe
BIAS-Jan2017-Dec2017 Temperature Temperature product: and satellite obser
comparison with SST SST_MED_SST_L4_NRT_OBSERVATIONS_010_0 period (Jan-Dec 20
Copernicus OSI TAC L4 04 This quantity is eva
(satellite) data for the The statistics are
Mediterranean basin selected sub-basin
and selected sub-
basins.
Table 8: (continued) List of metrics for Med-Currents evaluation using in-situ and satellite observation.
Name Description Ocean parameter Supporting reference dataset Quantity
.
The metrics of Table 1 and Table 2 give indications about the accuracy of
MEDSEA_ANALYSIS_FORECAST_PHY_006_013 temperature variable along the water column and at
the surface for the Mediterranean Sea and 16 sub-regions. The values for all the vertical levels are
computed using Argo profiles while the SST is evaluated by comparing with satellite observations. The
temperature RMS and MEAN values are higher at the first levels and decrease significantly below the
fourth layer. The error is always lower than 0.8°C along the water column, while it ranges between
0.49 and 0.72°C considering the SST.
The statistics listed in Table 3 give indications about the accuracy of the
MEDSEA_ANALYSIS_FORECAST_PHY_006_013 salinity field. The values for all the levels are computed
using Argo profiles. The skill of the system presents a RMS difference always lower than 0.2 PSU with
higher error at surface which decreases below 150 m.
The metrics shown in Table 4 define the accuracy of MEDSEA_ANALYSIS_FORECAST_PHY_006_013 sea
level anomaly. The statistics are computed along the satellite tracks. The new system presents an
overall RMS difference lower than 4 cm in the whole region, while it ranges between 2.2 and 5.0 cm in
the different regions. Region 11 presents no data since the SLA data assimilation scheme (using the
dynamic height) prevents the assimilation of data in areas shallower than 1000 m.
Page 12/ 58QUID for MED MFC Product Ref: CMEMS-MED-QUID-006-013
MEDSEA_ANALYSIS_FORECAST_PHY_006_013 Date: 28 January 2019
Issue: 1.2
II PRODUCTION SYSTEM DESCRIPTION
Production centre name: CMCC
Production system name: Analysis and Forecast Med-Currents EAS4 system
CMEMS Product name: MEDSEA_ANALYSIS_FORECAST_PHY_006_013
External product: Temperature (3D), Salinity (3D), Meridional and Zonal Currents (3D), Sea Surface
Height (2D), Mixed Layer Depth (2D), Seabed Temperature (2D)
Frequency of model output: daily (24-hrs) averages, hourly (1-hr) averages, monthly averages
Geographical coverage: -17.2917°W 36.29167°E; 30.1875°N 45.97917°N (Gulf of Biscay is
excluded)
Horizontal resolution: 1/24°
Vertical coverage: From surface to 5754 m (141 vertical unevenly spaced levels).
Length of forecast: 10 days for the daily mean fields, 5 days for the hourly mean fields.
Frequency of forecast release: Daily.
Analyses: Yes.
Hindcast: Yes.
Frequency of analysis release: Weekly on Tuesday.
Frequency of hindcast release: Daily.
The Analyses and forecasts physical product of the Med-MFC is produced with two different cycles.
The analysis cycle is done weekly, on Tuesday, for the previous 15 days, because a shorter analysis
cycle would not allow getting enough observations into the assimilation, for both in situ and satellite
data. The forecast cycle is daily and it produces 10-day forecast fields starting each day at 12:00:00
UTC. The forecast is initialized by a background field every day except Tuesday, when an analysis is
used. The production chain is illustrated in Figure 2.
Page 13/ 58QUID for MED MFC Product Ref: CMEMS-MED-QUID-006-013
MEDSEA_ANALYSIS_FORECAST_PHY_006_013 Date: 28 January 2019
Issue: 1.2
Figure 2: Scheme of the analysis and forecast CMEMS Med-Currents processing chain.
The Med-Currents system run is composed by several steps:
1. Upstream Data Acquisition, Pre-Processing and Control of: ECMWF atmospheric forcing
(Numerical Weather Prediction), Satellite (SLA and SST) and in-situ (T and S) data.
2. Forecast/Hindcast: NEMO-WW3 modeling system is run to produce one day of hindcast and
10-day forecast.
3. Analysis/Hindcast (only on Tuesday): NEMO-WW3 modeling system is combined with a 3DVAR
assimilation scheme in order to produce the best estimation of the sea (i.e. analysis). The
NEMO+WW3+3DVar system is running for 15 days into the past in order to use the best
available along track SLA products. The latest day of the 15 days of analyses, produces the
initial condition for the 10-day forecast.
4. Post processing: the model output is processed in order to obtain the products for the CMEMS
catalogue.
5. Output Delivery.
II.1 Description of the Med-Currents EAS4 model system
The Mediterranean Forecasting System, MFS, (Pinardi et al., 2003, Pinardi and Coppini 2010, Tonani et
al., 2014) is providing, since year 2000, analysis and short-term forecast of the main physical
parameters in the Mediterranean Sea and it is the physical component of the Med-MFC called Med-
Currents.
The analysis and forecast Med-Currents system at CMEMS EAS4 is provided by means of a coupled
hydrodynamic-wave model implemented over the whole Mediterranean basin and extended into the
Atlantic Sea in order to better resolve the exchanges with the Atlantic Ocean at the Strait of Gibraltar.
The model horizontal grid resolution is 1/24˚ (ca. 4.5 km) and has 141 unevenly spaced vertical levels.
Page 14/ 58QUID for MED MFC Product Ref: CMEMS-MED-QUID-006-013
MEDSEA_ANALYSIS_FORECAST_PHY_006_013 Date: 28 January 2019
Issue: 1.2
The hydrodynamics are supplied by the Nucleous for European Modelling of the Ocean (NEMO v3.6)
while the wave component is provided by WaveWatch-III. The model solutions are corrected by the
variational assimilation (based on a 3DVAR scheme) of temperature and salinity vertical profiles and
along track satellite Sea Level Anomaly observations.
Circulation model component (NEMO)
The oceanic equations of motion of Med-currents system are solved by an Ocean General Circulation
Model (OGCM) based on NEMO (Nucleus for European Modelling of the Ocean) version 3.6 (Madec et
al., 2016). The code is developed and maintained by the NEMO-consortium.
NEMO has been implemented in the Mediterranean at 1/24° x 1/24° horizontal resolution and 141
unevenly spaced vertical levels (Clementi et al., 2017a) with time step of 300sec. The model covers the
whole Mediterranean Sea and also extends into the Atlantic in order to better resolve the exchanges
with the Atlantic Ocean at the Strait of Gibraltar.
The NEMO code solves the primitive equations using the time-splitting technique that is the external
gravity waves are explicitly resolved with non-linear free surface formulation and time-varying vertical
z-star coordinates.
The advection scheme for active tracers, temperature and salinity, is a mixed up-stream/MUSCL
(Monotonic Upwind Scheme for Conservation Laws; Van Leer, 1979), originally implemented by
Estubier and Lévy (2000) and modified by Oddo et al. (2009). The vertical diffusion and viscosity terms
are a function of the Richardson number as parameterized by Pacanowsky and Philander (1981).
The model interactively computes air-surface fluxes of momentum, mass, and heat. The bulk formulae
implemented are described in Pettenuzzo et al. (2010) and are currently used in the Mediterranean
operational system (Tonani et al., 2015). A detailed description of other specific features of the model
implementation can be found in Oddo et al. (2009, 2014).
The vertical background viscosity and diffusivity values are set to 1.2e-6 [m2/s] and 1.0e-7 [m2/s]
respectively, while the horizontal bilaplacian eddy diffusivity and viscosity are set respectively equal to
-1.2e8 [m4/s] and -2.e8 [m4/s]. A quadratic bottom drag coefficient with a logarithmic formulation has
been used according to Maraldi et al. (2013) and the model uses vertical partial cells to fit the bottom
depth shape.
The hydrodynamic model is nested in the Atlantic within the Global analysis and forecast system GLO-
MFC daily data set (1/12° horizontal resolution, 50 vertical levels) that is interpolated onto the Med-
Currents model grid. Details on the nesting technique and major impacts on the model results are in
Oddo et al., 2009.
The model is forced by momentum, water and heat fluxes interactively computed by bulk formulae
using the 6-hours (for the first 3 days of forecast a 3-hours temporal resolution is used), 1/8°
horizontal-resolution operational analysis and forecast fields from the European Centre for Medium-
Range Weather Forecasts (ECMWF) and the model predicted surface temperatures (details of the air-
sea physics are in Tonani et al., 2008). The water balance is computed as Evaporation minus
Precipitation and Runoff. The evaporation is derived from the latent heat flux, precipitation is provided
by ECMWF as daily averages, while the runoff of the 39 rivers implemented is provided by monthly
mean datasets: the Global Runoff Data Centre dataset (Fekete et al., 1999) for the Po, Ebro, Nile and
Page 15/ 58QUID for MED MFC Product Ref: CMEMS-MED-QUID-006-013
MEDSEA_ANALYSIS_FORECAST_PHY_006_013 Date: 28 January 2019
Issue: 1.2
Rho ne rivers; the dataset from Raicich (1996) for: Vjosë, Seman rivers; the UNEP-MAP dataset
(Implications of Climate Change for the Albanian Coast, Mediterranean Action Plan, MAP Technical
Reports Series No.98., 1996) for the Buna/Bojana river; the PERSEUS dataset for the following 32
rivers: Piave, Tagliamento, Soca/Isonzo, Livenza, Brenta-Bacchiglione, Adige, Lika, Reno, Krka, Arno,
Nerveta, Aude, Trebisjnica, Tevere/Tiber, Mati, Volturno, Shkumbini, Struma/Strymonas,
Meric/Evros/Maritsa, Axios/Vadar, Arachtos, Pinios, Acheloos, Gediz, Buyuk Menderes, Kopru,
Manavgat, Seyhan, Ceyhan, Gosku, Medjerda, Asi/Orontes.
The Dardanelles Strait is implemented as a lateral open boundary condition by using GLO-MFC daily
Analysis and Forecast product and daily climatology derived from a Marmara Sea box model (Maderich
et al., 2015); while in the previous modeling version EAS3, it was considered as volume input
(Kourafalou and Barbopoulos, 2003) through a river-like parameterization.
The topography is created starting from the GEBCO 30arc-second grid
(http://www.gebco.net/data_and_products/gridded_bathymetry_data/gebco_30_second_grid/),
filtered (using a Shapiro filter) and manually modified in critical areas such as: islands along the Eastern
Adriatic coasts, Gibraltar and Messina straits, Atlantic box edge.
Wave model component (WW3)
The Wave dynamic is solved by a Mediterranean implementation of the WaveWatch-III (WW3) code
version 3.14 (Tolman, 2009). WaveWatch covers the same domain and follows the same horizontal
discretization of the circulation model (1/24° x 1/24°) with a time step of 300 sec. The wave model
uses 24 directional bins (15° directional resolution) and 30 frequency bins (ranging between 0.05 Hz
and 0.7931 Hz) to represent the wave spectral distribution.
WW3 has been forced by the same 1/8° horizontal resolution ECMWF atmospheric forcings (the same
used to force the hydrodynamic model). The wind speed is then modified by considering a stability
parameter depending on the air-sea temperature difference according to Tolman (2002).
The wave model takes into consideration the surface currents for wave refraction but assumes no
interactions with the ocean bottom. WW3 model solves the wave action balance equation that
describes the evolution, in slowly varying depth domain and currents, of a 2D ocean wave spectrum
where individual spectral component satisfies locally the linear wave theory. In the present application
WW3 has been implemented following WAM cycle4 model physics (Gunther et al., 1993). Wind input
and dissipation terms are based on Janssen’s quasi-linear theory of wind-wave generation (Janssen,
1989, 1991). The dissipation term is based on Hasselmann (1974) whitecapping theory according to
Komen et al. (1984). The non-linear wave-wave interaction is modelled using the Discrete Interaction
Approximation (DIA, Hasselmann et al., 1985). No interactions with the ocean bottom are considered.
Model coupling (NEMO-WW3)
The coupling between the hydrodynamic model (NEMO) and the wave model (WW3) is achieved by an
online hourly two-way coupling and consists in exchanging the following fields: NEMO sends to WW3
the air-sea temperature difference and the surface currents, while WW3 sends to NEMO the neutral
drag coefficient used to evaluate the surface wind stress.
More details on the model coupling and on the impact of coupled system on both wave and circulation
fields can be found in Clementi et al. (2017b).
Page 16/ 58QUID for MED MFC Product Ref: CMEMS-MED-QUID-006-013
MEDSEA_ANALYSIS_FORECAST_PHY_006_013 Date: 28 January 2019
Issue: 1.2
Data Assimilation scheme
The data assimilation system is the 3DVAR scheme developed by Dobricic and Pinardi (2008) and
modified by Storto et al. (2015). The background error correlation matrices vary monthly for each grid
point in the discretized domain of the Mediterranean Sea. Observational error covariance matrix is
evaluated with Desroziers et al. (2005) relationship. EOFs have been evaluated from a three years
simulation run (in the future a new set of EOFs will be evaluated from an analysis run).
The assimilated data include: along track Sea Level Anomaly (a satellite product accounting for
atmospheric pressure effect is used, as specified in II.3) from CLS SL-TAC, and in-situ vertical
temperature and salinity profiles from VOS XBTs (Voluntary Observing Ship-eXpandable
Bathythermograph) and ARGO floats. Objective Analyses-Sea Surface Temperature (OA-SST) fields
from CNR-ISA OSI-TAC are used for the correction of surface heat fluxes with the relaxation constant of
110 W m-2 K-1 applied close to midnight (in the previous system EAS3 the relaxation was performed
during the whole day using a relaxation constant of 40 W m-2 K-1) since the observed dataset
corresponds to the foundation SST (~ SST at midnight).
II.2 New features of the Med-Currents EAS4 system
The main differences between the CMEMS Med-Currents EAS3 and EAS4 systems are summarized in
Table 5 and described hereafter.
CMEMS Med-Currents CMEMS Med-Currents
EAS3 EAS4
Closed using a river-like
Lateral open boundary
Dardanelles Strait parameterization with
forced with daily fields
climatological fields
Relaxation during the Relaxation close to
whole day with a midnight with a
SST nudging
relaxation constant of relaxation constant of
40 Wm-2K-1 110 Wm-2K-1
Table 5: Differences between CMEMS Med-Currents EAS3 and EAS4 systems.
The main differences between CMEMS EAS3 and CMEMS EAS4 are:
Improvement in the SST nudging: In the EAS3 previous modeling system an SST nudging
toward observed satellite SST was applied on the atmospheric heat flux at each timestep over
the whole day. However, the observed dataset corresponds to the foundation SST or the SST
at midnight, meaning that the model was relaxed toward midnight SST during the whole day.
This might reduce the daily cycle of SST, especially in summer when it is strong. Indeed, the
first layer of the model is 1 meter deep which is much shallower than the 5 meters depth of
the foundation SST. With low winds, this could mean 0.5-1°C difference (Donlon et al, 2002). A
modified SST relaxation has been implemented in EAS4 which is applied at the observation
Page 17/ 58QUID for MED MFC Product Ref: CMEMS-MED-QUID-006-013
MEDSEA_ANALYSIS_FORECAST_PHY_006_013 Date: 28 January 2019
Issue: 1.2
time (midnight for our observation of SST) with a modified relaxation coefficient (from 40 to
110 Wm-2K-1).
Implementation of the Dardanelles strait as a lateral open boundary condition: The
Mediterranean Sea ocean numerical model is forced by a water inflow from the Marmara Sea
through the Dardanelles strait which, until EAS3 modeling version, it was implemented as a
Surface Boundary Condition (SBC) through a river-like parameterization using climatological
inflow volume flux and a climatological inflow salinity, both from Kourafalou et al. (2003).
In order to better represent this crucial forcing of the Mediterranean Sea circulation a
modified implementation of the Dardanelles Strait as Later Open Boundary Condition (LOBC) is
provided and forced with CMEMS GLO-PHY Analysis and forecast daily fields (temperature and
sea level), and Maderich et al. (2015) daily climatological velocity and salinity dataset.
II.3 Upstream data and boundary condition of the NEMO-3DVAR system
The CMEMS MED-Currents system uses the following upstream data:
1. Atmospheric forcing (including precipitation): NWP 6-h (3-h for the first 3 days of forecast),
0.125° horizontal-resolution operational analysis and forecast fields from the European Centre
for Medium-Range Weather Forecasts (ECMWF) distributed by the Italian National Meteo
Service (USAM/CNMA)
2. Runoff: Global Runoff Data Centre dataset (Fekete et al., 1999) for Po, Ebro, Nile and Rhone,
the dataset from Raicich (Raicich, 1996) for the Adriatic rivers Vjosë and Seman; the UNEP-
MAP dataset (Implications of Climate Change for the Albanian Coast, Mediterranean Action
Plan, MAP Technical Reports Series No.98., 1996) for the Buna/Bojana river; the PERSEUS
project dataset for the new 32 rivers added.
3. Data assimilation:
o Temperature and Salinity vertical profiles from Copernicus INSITU TAC
INSITU_MED_NRT_OBSERVATIONS_013_035
o Satellite along track Sea Level Anomaly from Copernicus SL TAC:
SEALEVEL_MED_SLA_ASSIM_L3_NRT_OBSERVATIONS_008_021 (till 29th
March 2017)
SEALEVEL_MED_SLA_L3_NRT_OBSERVATIONS_008_019 (till 30th March 2017)
SEALEVEL_MED_PHY_ASSIM_L3_NRT_OBSERVATIONS_008_048 (from 1st June
2017).
SEALEVEL_EUR_PHY_ASSIM_L3_NRT_OBSERVATIONS_008_043 (from May
2019)
o Satellite SST from Copernicus OSI TAC (nudging):
SST_MED_SST_L4_NRT_OBSERVATIONS_010_004
Page 18/ 58QUID for MED MFC Product Ref: CMEMS-MED-QUID-006-013
MEDSEA_ANALYSIS_FORECAST_PHY_006_013 Date: 28 January 2019
Issue: 1.2
4. Initial conditions of temperature and salinity at 1/1/2016 are the winter climatological fields
from WOA13 V2 (World Ocean Atlas 2013 V2,
https://www.nodc.noaa.gov/OC5/woa13/woa13data.html)
5. Lateral boundary conditions from Copernicus Global Analysis and Forecast system:
GLOBAL_ANALYSIS_FORECAST_PHY_001_024 at 1/12° horizontal resolution, 50 vertical levels.
In particular for the lateral boundary conditions in the Atlantic Ocean, the following conditions
are considered:
1. The radiative phase velocity (Cx and Cy) is computed at the open boundaries using
Orlanski (NPO) formulation with adaptative nudging for baroclinic velocities and
tracers (Marchesiello et al., 2001).
2. The radiation algorithm is applied to zonal and meridional components of the open
boundary conditions velocities using the phase velocities computed at point 1
3. The Flather boundary condition (Flather, 1976) is applied to barotropic velocities at
open boundaries for the time-splitting free surface case
4. The total velocities are updated on the basis of point 2 and 3
5. For tracers the 2D radiation condition is applied using radiative phase velocity
computed at point 1
Page 19/ 58QUID for MED MFC Product Ref: CMEMS-MED-QUID-006-013
MEDSEA_ANALYSIS_FORECAST_PHY_006_013 Date: 28 January 2019
Issue: 1.2
III VALIDATION FRAMEWORK
In order to evaluate and assure the quality of the MEDSEA_ANALYSIS_FORECAST_PHY_006_013
product, an assimilation experiment has been performed using the system described in section II,
which is going to be operational starting in April 2019, and covering 3 years from January 2016 to
December 2018 (the period from January to December 2016 is considered as a spin-up time).
In particular the qualification task has been carried out over 1 year period, from January to December
2017, based on Class 1 and 4 diagnostics.
The performance of the Med-Currents EAS4 system has been assessed by using external products, i.e.
temperature, salinity, sea level anomaly using independent coastal moorings, quasi-independent
satellite and in-situ observations, moreover climatological datasets have been used to assess the
quality of the seabed temperature and mixed layer depth.
Quasi-independent data are all the observations (Satellite SLA and SST and in situ vertical profiles of
temperature and salinity from XBT and Argo) which are assimilated into the system. Diagnostic in
terms of RMS of the misfits and/or bias are computed.
The datasets of observations used for the qualification task are listed below in Table 6 presenting the
lists of the used quasi-independent data with the corresponding CMEMS product names.
QUASI-INDEPENDENT DATA
TYPE CMEMS PRODUCT NAME
ARGO, XBT
INSITU_MED_NRT_OBSERVATIONS_013_035
GLIDER
SEALEVEL_MED_SLA_ASSIM_L3_NRT_OBSERVATIONS_008_021 (till 29th March 2017)
SEALEVEL_MED_SLA_L3_NRT_OBSERVATIONS_008_019 (till 29th March 2017)
SLA
SEALEVEL_MED_PHY_ASSIM_L3_NRT_OBSERVATIONS_008_048 (from 30th March 2017)
SEALEVEL_EUR_PHY_ASSIM_L3_NRT_OBSERVATIONS_008_043 (from May 2019)
SST SST_MED_SST_L4_NRT_OBSERVATIONS_010_004_a
Table 6: list of the quasi-independent observations
The list of metrics used to provide an overall assessment of the product, to quantify the differences
with the available observations and to assess the improvements with respect to the previous system
(CMEMS EAS3) is presented in Table 7: List of metrics for Med-Currents evaluation using in-situ and satellite
observation (continues overleaf).
Page 20/ 58QUID for MED MFC Product Ref: CMEMS-MED-QUID-006-013
MEDSEA_ANALYSIS_FORECAST_PHY_006_013 Date: 28 January 2019
Issue: 1.2
Name Description Ocean parameter Supporting reference dataset Quantity
NRT evaluation of Med-MFC-Currents using semi-independent data: Estimate Accuracy Numbers
S-m-D-CLASS4- Salinity vertical profiles Salinity Argo floats from the Copernicus INSITU TAC Salinity daily me
PROF-BIAS-Jan2017- comparison with products: observations avera
Dec2017 Copernicus INSITU TAC INSITU_MED_NRT_OBSERVATIONS_013_035 Dec 2017).
data at 9 layers for the This quantity is eva
Mediterranean basin. The statistics are d
evaluated for 9 dif
150, 150-300, 300
SLA-D-CLASS4-ALT- Sea level anomaly Sea Level Satellite Sea Level along track data from Sea level daily R
RMSD-Jan2017- comparison with Anomaly Copernicus Sea Level TAC product: satellite observati
Dec2017 Copernicus Sea Level SEALEVEL_MED_SLA_L3_NRT_OBSERVATIONS_ period (Jan-Dec 20
TAC (satellite along 008_019 This quantity is eva
track) data for the SEALEVEL_MED_SLA_ASSIM_L3_NRT_OBSERV The statistics are
Mediterranean basin ATIONS_008_021 selected sub-basin
and selected sub-
basins.
SST-D-CLASS4-RAD- Sea Surface Sea Surface SST satellite data from Copernicus OSI TAC L4 Sea surface tempe
RMSD-Jan2017- Temperature Temperature product: model and satellit
Dec2017 comparison with SST SST_MED_SST_L4_NRT_OBSERVATIONS_010_0 testing period (Jan
Copernicus OSI TAC L4 04 This quantity is eva
(satellite) data for the The statistics are
Mediterranean basin selected sub-basin
and selected sub-
basins.
SST-D-CLASS4-RAD- Sea Surface Sea Surface SST satellite data from Copernicus OSI TAC L4 Sea surface tempe
BIAS-Jan2017-Dec2017 Temperature Temperature product: and satellite obser
comparison with SST SST_MED_SST_L4_NRT_OBSERVATIONS_010_0 period (Jan-Dec 20
Copernicus OSI TAC L4 04 This quantity is eva
(satellite) data for the The statistics are
Mediterranean basin selected sub-basin
and selected sub-
basins.
Table 8: (continued) List of metrics for Med-Currents evaluation using in-situ and satellite observation.
Name Description Ocean parameter Supporting reference dataset Quantity
.
Page 21/ 58QUID for MED MFC Product Ref: CMEMS-MED-QUID-006-013
MEDSEA_ANALYSIS_FORECAST_PHY_006_013 Date: 28 January 2019
Issue: 1.2
Name Description Ocean parameter Supporting reference dataset Quantity
NRT evaluation of Med-MFC-Currents using semi-independent data: Estimate Accuracy Numbers
T-m-D-CLASS4- Temperature vertical Temperature Argo floats from the Copernicus INSITU TAC Temperature daily RMSs of the difference between model and
PROF-RMSD-Jan2017- profiles comparison products: insitu observations averaged over the qualification testing
Dec2017 with Copernicus INSITU period (Jan-Dec 2017).
INSITU_MED_NRT_OBSERVATIONS_013_035
TAC data at 9 layers for
This quantity is evaluated on the model analysis.
the Mediterranean
basin. The statistics are defined for all the Mediterranean Sea and are
evaluated for 9 different layers (0-10, 10-30, 30-60, 60-100, 100-
150, 150-300, 300-600, 600-1000, 1000-2000 m)
T-m-D-CLASS4- Temperature vertical Temperature Argo floats from the Copernicus INSITU TAC Temperature daily mean differences between model and insitu
PROF-BIAS-Jan2017- profiles comparison products: observations averaged over the qualification testing period (Jan-
Dec2017 with Copernicus INSITU Dec 2017).
INSITU_MED_NRT_OBSERVATIONS_013_035
TAC data at 9 layers for
This quantity is evaluated on the model analysis.
the Mediterranean
basin. The statistics are defined for all the Mediterranean Sea and are
evaluated for 9 different layers (0-10, 10-30, 30-60, 60-100, 100-
150, 150-300, 300-600, 600-1000, 1000-2000 m)
S-m-D-CLASS4- Salinity vertical profiles Salinity Argo floats from the Copernicus INSITU TAC Salinity daily RMSs of the difference between model and insitu
PROF-RMSD-Jan2017- comparison with products: observations averaged over the qualification testing period (Jan-
Dec2017 Copernicus INSITU TAC Dec 2017).
INSITU_MED_NRT_OBSERVATIONS_013_035
data at 9 layers for the
This quantity is evaluated on the model analysis.
Mediterranean basin.
The statistics are defined for all the Mediterranean Sea and are
evaluated for 9 different layers (0-10, 10-30, 30-60, 60-100, 100-
150, 150-300, 300-600, 600-1000, 1000-2000 m)
Table 7: List of metrics for Med-Currents evaluation using in-situ and satellite observation (continues overleaf).
Page 22/ 58QUID for MED MFC Product Ref: CMEMS-MED-QUID-006-013
MEDSEA_ANALYSIS_FORECAST_PHY_006_013 Date: 28 January 2019
Issue: 1.2
Name Description Ocean parameter Supporting reference dataset Quantity
NRT evaluation of Med-MFC-Currents using semi-independent data: Estimate Accuracy Numbers
S-m-D-CLASS4- Salinity vertical profiles Salinity Argo floats from the Copernicus INSITU TAC Salinity daily mean differences between model and insitu
PROF-BIAS-Jan2017- comparison with products: observations averaged over the qualification testing period (Jan-
Dec2017 Copernicus INSITU TAC INSITU_MED_NRT_OBSERVATIONS_013_035 Dec 2017).
data at 9 layers for the This quantity is evaluated on the model analysis.
Mediterranean basin. The statistics are defined for all the Mediterranean Sea and are
evaluated for 9 different layers (0-10, 10-30, 30-60, 60-100, 100-
150, 150-300, 300-600, 600-1000, 1000-2000 m)
SLA-D-CLASS4-ALT- Sea level anomaly Sea Level Satellite Sea Level along track data from Sea level daily RMSs of the difference between model and
RMSD-Jan2017- comparison with Anomaly Copernicus Sea Level TAC product: satellite observations averaged over the qualification testing
Dec2017 Copernicus Sea Level SEALEVEL_MED_SLA_L3_NRT_OBSERVATIONS_ period (Jan-Dec 2017).
TAC (satellite along 008_019 This quantity is evaluated on the model analysis.
track) data for the SEALEVEL_MED_SLA_ASSIM_L3_NRT_OBSERV The statistics are defined for all the Mediterranean Sea and 16
Mediterranean basin ATIONS_008_021 selected sub-basins.
and selected sub-
basins.
SST-D-CLASS4-RAD- Sea Surface Sea Surface SST satellite data from Copernicus OSI TAC L4 Sea surface temperature daily RMSs of the difference between
RMSD-Jan2017- Temperature Temperature product: model and satellite observations averaged over the qualification
Dec2017 comparison with SST SST_MED_SST_L4_NRT_OBSERVATIONS_010_0 testing period (Jan-Dec 2017).
Copernicus OSI TAC L4 04 This quantity is evaluated on the model analysis.
(satellite) data for the The statistics are defined for all the Mediterranean Sea and 16
Mediterranean basin selected sub-basins.
and selected sub-
basins.
SST-D-CLASS4-RAD- Sea Surface Sea Surface SST satellite data from Copernicus OSI TAC L4 Sea surface temperature daily mean differences between model
BIAS-Jan2017-Dec2017 Temperature Temperature product: and satellite observations averaged over the qualification testing
comparison with SST SST_MED_SST_L4_NRT_OBSERVATIONS_010_0 period (Jan-Dec 2017).
Copernicus OSI TAC L4 04 This quantity is evaluated on the model analysis.
(satellite) data for the The statistics are defined for all the Mediterranean Sea and 16
Mediterranean basin selected sub-basins.
and selected sub-
basins.
Table 8: (continued) List of metrics for Med-Currents evaluation using in-situ and satellite observation.
Page 23/ 58QUID for MED MFC Product Ref: CMEMS-MED-QUID-006-013
MEDSEA_ANALYSIS_FORECAST_PHY_006_013 Date: 28 January 2019
Issue: 1.2
Name Description Ocean parameter Supporting reference dataset Quantity
NRT evaluation of Med-MFC-Currents using semi-independent data. Daily comparison
T-m-D-CLASS4- Temperature vertical Temperature Argo floats from the Copernicus INSITU TAC Time series of temperature daily RMSs of the difference
PROF-RMSD-Jan2017- profiles comparison products: between model and insitu observations evaluated over the
Dec2017 with Copernicus INSITU INSITU_MED_NRT_OBSERVATIONS_013_035 qualification testing period (2017).
TAC data at 9 layers for This quantity is evaluated on the model analysis.
the Mediterranean The statistics are defined for all the Mediterranean Sea and are
basin evaluated for seven different layers (0-10, 10-30, 30-60, 60-100,
100-150, 150-300, 300-600, 600-1000, 1000-2000 m)
S-m-D-CLASS4- Salinity vertical profiles Salinity Argo floats from the Copernicus INSITU TAC Time series of salinity daily RMSs of the difference between
PROF-RMSD-Jan2017- comparison with products: model and insitu observations evaluated over the qualification
Dec2017 Copernicus INSITU TAC INSITU_MED_NRT_OBSERVATIONS_013_035 testing period (2017).
data at 9 layers for the This quantity is evaluated on the model analysis.
Mediterranean basin The statistics are defined for all the Mediterranean Sea and are
evaluated for seven different layers (0-10, 10-30, 30-60, 60-100,
100-150, 150-300, 300-600, 600-1000, 1000-2000 m)
SLA-D-CLASS4-ALT- Sea level anomaly Sea Level Satellite Sea Level along track data from Time series of sea level anomaly daily RMSs of the difference
RMSD-Jan2017- comparison with Anomaly Copernicus Sea Level TAC product: between model and satellite observations evaluated over the
Dec2017 Copernicus Sea Level SEALEVEL_MED_SLA_L3_NRT_OBSERVATIONS_ qualification testing period (2017).
TAC (satellite along 008_019 This quantity is evaluated on the model analysis.
track) data for the SEALEVEL_MED_SLA_ASSIM_L3_NRT_OBSERV The statistics are defined for all the Mediterranean Sea.
Mediterranean basin ATIONS_008_021
SST-D-CLASS4-RAD- Sea Surface Sea Surface SST satellite data from Copernicus OSI TAC L4 Time series of sea surface temperature daily RMSs of the
RMSD-Jan2017- Temperature Temperature product: difference between model and satellite observations evaluated
Dec2017 comparison with SST SST_MED_SST_L4_NRT_OBSERVATIONS_010_0 over the qualification testing period (2017).
Copernicus OSI TAC L4 04 This quantity is evaluated on the model analysis.
(satellite) data for the The statistics are defined for all the Mediterranean Sea.
Mediterranean basin
SST-D-CLASS4-RAD- Sea Surface Sea Surface SST satellite data from Copernicus OSI TAC L4 Time series of sea surface temperature daily BIAS (difference
BIAS-Jan2017-Dec2017 Temperature Temperature product: between model and satellite observations) evaluated over the
comparison with SST SST_MED_SST_L4_NRT_OBSERVATIONS_010_0 qualification testing period (2017).
Copernicus OSI TAC L4 04 This quantity is evaluated on the model analysis.
(satellite) data for the The statistics are defined for all the Mediterranean Sea.
Mediterranean basin
Table 9: (continued) List of metrics for Med-Currents evaluation using in-situ and satellite observation.
Page 24/ 58QUID for MED MFC Product Ref: CMEMS-MED-QUID-006-013
MEDSEA_ANALYSIS_FORECAST_PHY_006_013 Date: 28 January 2019
Issue: 1.2
Name Description Ocean parameter Supporting reference dataset Quantity
NRT evaluation of Med-MFC-Currents using semi-independent data. Daily comparison
SST-D-CLASS4-RAD- Sea Surface Sea Surface SST satellite data from Copernicus OSI TAC L4 Time series of sea surface temperature daily RMSs of the
RMSD-Jan2017- Temperature Temperature product: difference between model and satellite observations evaluated
Dec2017 comparison with SST SST_MED_SST_L4_NRT_OBSERVATIONS_010_0 over the qualification testing period (2017).
Copernicus OSI TAC L4 04 This quantity is evaluated on the model analysis.
(satellite) data for the The statistics are defined for all the Mediterranean Sea.
Mediterranean basin
SST-D-CLASS4-RAD- Sea Surface Sea Surface SST satellite data from Copernicus OSI TAC L4 Time series of sea surface temperature daily BIAS (difference
BIAS-Jan2017-Dec2017 Temperature Temperature product: between model and satellite observations) evaluated over the
comparison with SST SST_MED_SST_L4_NRT_OBSERVATIONS_010_0 qualification testing period (2017).
Copernicus OSI TAC L4 04 This quantity is evaluated on the model analysis.
(satellite) data for the The statistics are defined for all the Mediterranean Sea.
Mediterranean basin
Table 10: (continued) List of metrics for Med-Currents evaluation using in-situ and satellite observation.
Page 25/ 58QUID for MED MFC Product Ref: CMEMS-MED-QUID-006-013
MEDSEA_ANALYSIS_FORECAST_PHY_006_013 Date: 28 January 2019
Issue: 1.2
Name Description Ocean parameter Supporting reference dataset Quantity
NRT evaluation of Med-MFC-Currents using semi-independent data. Weekly comparison of misfits
T-m-W-CLASS4– Temperature vertical Temperature Argo floats, Gliders and XBT from the Time series of weekly RMSs of temperature misfits (observation
PROF-RMSD-MED- profiles comparison Copernicus INSITU TAC products: minus model value transformed at the observation location and
Jan2017-Dec 2017 with assimilated INSITU_MED_NRT_OBSERVATIONS_013_035 time).
Copernicus INSITU TAC Together with the time series, the average value of weekly RMSs
data at 5 specified is evaluated over the qualification testing period (2017).
depths. This quantity is evaluated on the model analysis.
The statistics are defined for all the Mediterranean Sea and are
evaluated at five different depths: 8, 30, 150, 300 and 600 m.
S-m-W-CLASS4– Salinity vertical profiles Salinity Argo floats from the Copernicus INSITU TAC Time series of weekly RMSs of salinity misfits (observation minus
PROF-RMSD-MED- comparison with products: model value transformed at the observation location and time).
Jan2017-Dec 2017 assimilated Copernicus INSITU_MED_NRT_OBSERVATIONS_013_035 Together with the time series, the average value of weekly RMSs
INSITU TAC data at 5 is evaluated over the qualification testing period (2017).
specified depths. This quantity is evaluated on the model analysis.
The statistics are defined for all the Mediterranean Sea and are
evaluated at five different depths: 8, 30, 150, 300 and 600 m.
SLA-SURF-W-CLASS4- Sea level anomaly Sea Level Satellites (Jason2, Jason2N, Jason3, CryoSat-2, Time series of weekly RMSs of sea level anomaly misfits
ALT-RMSD-MED- comparison with Anomlay Saral/Altika) Sea Level along track data from (observation minus model value transformed at the observation
Jan2017-Dec 2017 assimilated Copernicus Copernicus Sea Level TAC products: location and time).
Sea Level TAC satellite SEALEVEL_MED_SLA_L3_NRT_OBSERVATIONS_ Together with the time series, the average value of weekly RMSs
along track data for the 008_019 is evaluated over the qualification testing period (2017).
Mediterranean basin. SEALEVEL_MED_SLA_ASSIM_L3_NRT_OBSERV This quantity is evaluated on the model analysis.
ATIONS_008_021 The statistics are defined for all the Mediterranean Sea and are
evaluated for the different assimilated satellites.
Table 11: (continued) List of metrics for Med-Currents evaluation using in-situ and satellite observation.
Page 26/ 58You can also read