Maryland Building Decarbonization Study - Early Results Presentation with Buildings Ad-hoc Group

Page created by Clifford Walsh
 
CONTINUE READING
Maryland Building Decarbonization Study - Early Results Presentation with Buildings Ad-hoc Group
Maryland Building
Decarbonization Study
Early Results Presentation with
Buildings Ad-hoc Group
July 13th, 2021

                                        Tory Clark
                                          Dan Aas
                                        Charles Li
                                    John de Villier
                                  Michaela Levine
                                  Jared Landsman
Maryland Building Decarbonization Study - Early Results Presentation with Buildings Ad-hoc Group
Today’s Presentation

 E3 is tasked by MDE and MCCC to conduct an analysis looking at potential pathways to
  decarbonize Maryland’s building stock by mid-century
 In May, E3 held a workshop with the Buildings Ad-hoc group to solicit feedback on the three
  scenarios for a deep-dive analysis
 Since the workshop, E3 has been working with MDE, US Climate Alliance and TNC on
  finalizing scenario design and input assumptions, and has completed a preliminary
  analysis of the three scenarios
 Today’s presentation focuses on EARLY and PRELMINARY results from E3’s analysis on
  the three scenarios
 Questions for today’s discussion:
   • What feedback and suggestion does this group have for E3 based on these early results?
   • Does this group feel comfortable with E3 presenting these results to the MWG on 7/20 with minor
     updates based on feedback from today?
   • If so, what messages does this group want to bring to MWG based on findings from today’s
     presentation?

                                    Early Results and Preliminary                                      2
Maryland Building Decarbonization Study - Early Results Presentation with Buildings Ad-hoc Group
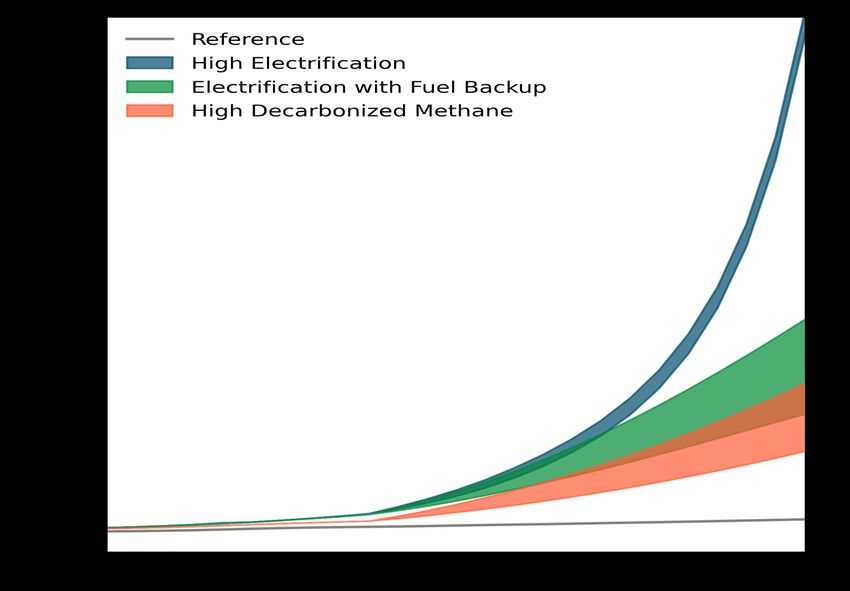
Content of E3’s Presentation

 Part I. Overview and key findings – Charles Li
 Part II. Energy consumption – John de Villier
 Part III. Electric system peak impact – Michaela Levine
 Part IV. System cost and rate impact – Charles Li
 (Given time) Part V. Consumer economics – Jared Landsman
 Conclusion

                                    Early Results and Preliminary   3
Overview and key findings
Project objective: a Maryland-specific pathway to achieve
      deep decarbonization of building end-uses by mid-century
 Based on the most recent Maryland GHG
  Inventory for 2017, building direct-use                   MD 2017 Gross GHG Emissions by Sector and Subsector
  emissions account for 13% of economywide
  GHG emissions in Maryland
   • 80% of direct building emissions are from
     space heating and water heating
 90% of the statewide electric load are from               13% of total
                                                               GHG
  buildings, which contribute to upstream                    emissions
  emissions in electricity generation
   • Currently, electricity generation accounts for
     30% of total GHG emissions, but will decrease
     as clean and renewable energy becomes a
     larger share
 Key questions of this project:
   • What are the potential pathways to achieve
     deep decarbonization of Maryland's building
     stock by mid-century?                                    90% of the
                                                             total electric
   • What are the costs and benefits of each               loads are from
     pathway from a total system cost perspective,             buildings
     as well as impacts on consumers?

                                       Early Results and Preliminary                                              5
This study investigates opportunities for building
         decarbonization through 3 scenarios
   E3 and MDE held a 4-hour workshop with the Buildings Ad-hoc Group, where we received feedback and input
    from stakeholders on scenario design that informed the selection of the following scenarios

                                                            Electrification with Gas       High Decarbonized
        Reference                High Electrification
                                                                     Back Up                    Methane

 Same as the Reference         Almost all buildings        Existing buildings         Buildings keep using
  scenario in the GGRA           switch to ASHPs and          keep using fuels for        fuels for heating while
  analysis reflecting            GSHPs. Heating is            heating and are             fossil fuels are gradually
  current policies               supplied by electricity      supplied with a heat        replaced by low-carbon
                                 throughout the entire        pump combined with          renewable fuels. Some
 Buildings keep using
                                 year                         existing furnace/boiler     features:
  existing devices with no
                                                              that serves as back up
  electrification and little    High efficiency                                            • RNG supplied by
                                                              in the coldest hours of
  efficiency improvement         through building                                             biomethane and
                                                              the year
                                 retrofits                                                    synthetic natural gas
 Building energy demand
                                                             All-electric for new          • 7% hydrogen blend
  grows at 0.6%/yr, same
                                                              construction
  as EIA’s projected                                                                        • High efficiency through
  annual growth rate of                                                                       building retrofits
  Maryland households

                                          Early Results and Preliminary                                               6
3 steps to analyze the impacts of building decarbonization
    scenarios

                                                Development of
                                           decarbonization scenarios,
                  Scenario Specification    heating equipment costs
                                           and renewable fuel supply
                                                     curve

                                             Analysis of incremental     Overview of
                  Assess Energy System
3 selected                                  equipment costs, electric   technical and
                    Impacts and Cost          system costs and fuel
scenarios                                                                 economic
                       Implications                  costs.
                                                                         implications

                                             Development of electric
                  Electric and Gas Rate         and gas revenue
                          Impacts            requirement models to
                                              estimate rate impacts

                        Early Results and Preliminary                                   7
All scenarios achieve zero direct building emissions by 2045
 All scenarios achieve zero direct building emissions by 2045 through electrification, efficiency improvement and use
  of low-carbon fuels
    • This is consistent with the MCCC-recommended economy-wide target of carbon neutrality by 2045

 Indirect emissions from upstream electricity generation still remain by 2045
    • Using GGRA assumptions that by 2045 all in-state generations are carbon-free but there are still GHG emissions associated with PJM imports

      Direct building GHG emissions trajectory                                                                                           Indirect building GHG emissions from upstream
      (MMtCO2e per year)                                                                                                                 electricity generation in 2045 (MMt CO2e per year)
                                    9.0
       Direct Building Emissions

                                    8.0
                                    7.0
           (Million MtCO2e)

                                    6.0
                                    5.0
                                    4.0
                                    3.0
                                    2.0
                                    1.0
                                      -
                                                                 2027

                                                                                                     2037
                                            2021
                                                   2023
                                                          2025

                                                                        2029
                                                                               2031
                                                                                      2033
                                                                                              2035

                                                                                                             2039
                                                                                                                    2041
                                                                                                                           2043
                                                                                                                                  2045

                                          High Electrification                               Electrification with Fuel Backup
                                          High Decarbonized Methane

                                                                                                            Early Results and Preliminary                                                     8
Summary of key findings

    Reducing direct building emissions to zero is feasible in all scenarios, but requires technology commercialization
    and accelerated implementation.

    High Decarbonized Methane requires large quantities of zero-carbon fuels, resulting in high incremental fuel
    costs with significant cost uncertainty
                  Level of fuel commodity cost increase is highly uncertain and dependent on the availability of and
                  competition for biomass, as well as learning rates of hydrogen and Synthetic Natural Gas (SNG).

    High Electrification causes a Summer to Winter peak-shift and significant increase in peak electricity demand,
    resulting in high incremental electricity system costs
                  Switch to heat pumps from electric resistance heating, which is currently used in about 25% of
                  Maryland households, has a much smaller impact on reducing peak demand than total load.

    Electrification with Fuel Backup has 80% less electricity system cost increase compared to the High
    Electrification scenario and shows lowest overall resource costs compared to the other scenarios.

                  At the same time, this scenario is more resilient to variance in fuel costs and equipment costs and
                  therefore shows benefits in risk mitigation compared to the other two scenarios.

    Costs of fuels increase in all scenarios as a result of zero-carbon fuels and higher delivery costs (due to lower
    consumption levels); emphasis on mitigating the energy burden with customers ‘staying behind’ is important.

                                 Early Results and Preliminary                                                           9
Energy consumption
Space heating end-uses are mostly electrified by 2045 in
               the two electrification scenarios
 Heat pumps become the major space heating equipment in the High Electrification scenario
 Dual-fuel heat pumps are added to most retrofit buildings in the Electrification with Fuel Backup
  scenario, pairing with existing fuel-based systems
 Electric resistance currently accounts for about 20% of space heating devices
       • Phase-out of the current EMPOWER program flattens Air Source HP adoption after 2023 with no further incentives
         for existing electric resistance customer to switch to HPs in High Decarbonized Methane and Electrification with
         Fuel Backup scenarios
  High Electrification                                                                            Electrification with Fuel Backup                                                                  High Decarbonized Methane
 3.0                                                                                              3.0                                                                                               3.0

 2.5                                                                                              2.5                                                                                               2.5

 2.0                                                                                              2.0                                                                                               2.0

 1.5                                                                                              1.5                                                                                               1.5

 1.0                                                                                              1.0                                                                                               1.0

                                                                                                                                                                                                                        Electric Resistance
 0.5                                                                                              0.5                                                                                               0.5
                                          Air Source HP
                                                                                                                             Air Source HP                                                                              Air Source HP
  -                                                                                                -                                                                                                 -

                                                                                                                                                                                                                                      2029

                                                                                                                                                                                                                                                           2035

                                                                                                                                                                                                                                                                                              2045
                                                                                                                                                                                                          2021

                                                                                                                                                                                                                 2023

                                                                                                                                                                                                                        2025

                                                                                                                                                                                                                               2027

                                                                                                                                                                                                                                             2031

                                                                                                                                                                                                                                                    2033

                                                                                                                                                                                                                                                                  2037

                                                                                                                                                                                                                                                                         2039

                                                                                                                                                                                                                                                                                2041

                                                                                                                                                                                                                                                                                       2043
                                   2029

                                                        2035

                                                                                           2045
       2021

              2023

                     2025

                            2027

                                          2031

                                                 2033

                                                               2037

                                                                      2039

                                                                             2041

                                                                                    2043

                                                                                                                                     2029

                                                                                                                                                          2035

                                                                                                                                                                                             2045
                                                                                                        2021

                                                                                                               2023

                                                                                                                      2025

                                                                                                                              2027

                                                                                                                                            2031

                                                                                                                                                   2033

                                                                                                                                                                 2037

                                                                                                                                                                        2039

                                                                                                                                                                               2041

                                                                                                                                                                                      2043
              * “Other” space heating devices mainly include fuel oil and LPG-based furnaces and boilers

                                                                                                  Early Results and Preliminary                                                                                                                                                                      11
Electricity demand in all scenarios are lower than
                           Reference due to energy efficiency gains
 Electricity demand increases in all scenarios due to growth in households
                       • High Electrification scenario has the highest load growth among the three scenarios due to new space heating,
                         water heating and other loads as a result of fuel switching
 Compared to Reference, all scenarios have lower electricity demand due to energy efficiency gains
                       • High Electrification scenario also has the largest reduction in existing loads due to higher levels of efficiency from
                         building shell improvement and efficient electric device adoption

                      High Electrification                                            Electrification with Fuel Backup                                High Decarbonized Methane
Electric Load (TWh)

                                                                Electric Load (TWh)

                                                                                                                                Electric Load (TWh)
                                                     +5 TWh                                                          +3 TWh                                                      +1 TWh
                                             relative to 2021                                                relative to 2021                                            relative to 2021

                                                                                      Early Results and Preliminary                                                                         12
Natural gas demand declines in all scenarios due to energy
          efficiency gains and fuel switching offsetting growth
 Natural gas use in buildings is expected to decline in all scenarios due to energy efficiency gains
  offsetting growth in households, and this decline is accelerated in scenarios with significant
  building electrification
    • High Electrification reduces gas demand by 96% by 2045 due to aggressive electrification of all building end-uses
    • Electrification with Fuel Backup scenario has lower reduction in gas demand by 2045 at 62%, as most customers
          adopt dual-fuel heat pumps that use gas with gas as a backup heating source during coldest hours of the year
    • High Decarbonized Methane scenario results in a 19% reduction in gas demand by 2045 due to efficient gas
      appliance adoption and building shell improvements

  High Electrification                                                                                Electrification with Fuel Backup                                                                   High Decarbonized Methane
    180                                                                                                 180                                                                                               180
                                                                                                                                                                                                                                                     -22% relative to reference
    160                                                                                                 160                                                                                               160
    140                                                                        -96%                     140                                                                       -64%                    140
    120
                                                                          relative to                   120                                                                  relative to                  120
                                                                          reference                                                                                          reference
    100                                                                                                 100                                                                                               100
     80                                                                                                  80                                                                                                80
     60                                                                                                  60                                                                                                60
     40                                                                                                  40                                                                                                40
     20                                                                                                  20                                                                                                20
     -                                                                                                   -                                                                                                 -
                                                                                                              2021
                                                                                                                     2023
                                                                                                                            2025
                                                                                                                                   2027
                                                                                                                                          2029
                                                                                                                                                 2031
                                                                                                                                                        2033
                                                                                                                                                               2035
                                                                                                                                                                      2037
                                                                                                                                                                             2039
                                                                                                                                                                                    2041
                                                                                                                                                                                           2043
                                                                                                                                                                                                  2045
           2021
                  2023
                         2025
                                2027
                                       2029
                                              2031
                                                     2033
                                                            2035
                                                                   2037
                                                                          2039
                                                                                 2041
                                                                                        2043
                                                                                               2045

                                                                                                                                                                                                                2021
                                                                                                                                                                                                                       2023
                                                                                                                                                                                                                              2025
                                                                                                                                                                                                                                     2027
                                                                                                                                                                                                                                            2029
                                                                                                                                                                                                                                                   2031
                                                                                                                                                                                                                                                          2033
                                                                                                                                                                                                                                                                 2035
                                                                                                                                                                                                                                                                        2037
                                                                                                                                                                                                                                                                               2039
                                                                                                                                                                                                                                                                                      2041
                                                                                                                                                                                                                                                                                             2043
                                                                                                                                                                                                                                                                                                    2045
                                                                                                      Early Results and Preliminary                                                                                                                                                                        13
The E3 Biofuels Module models two bookends for RNG
                      Supply
     RNG Supply Curve assumptions are developed                                                                                                          Conservative
      using E3 biofuels optimization module, which
      determines the most cost-effective way to convert
      biomass into biofuel across all sectors.
     Conservative and Optimistic scenarios modeled
      here represent two bookends for the supply of
      RNG towards 2045                                                                                                                                                                                      Present-day gas
                                                                                                                                                                                                            demand is ~160 TBTU
            Conservative scenario has heavy reliance on Synthetic
             Natural Gas (SNG); it assumes                                                                                                                                                                         160

                        MD only gets access in-state feedstocks
                                                                                                                                                             Optimistic
                        ALL cellulosic feedstocks would be more cost-effectively used
                         to produce liquid fuels - such as renewable diesel or jet fuel
                         (due to higher prices and carbon intensities for these fuels)

            Optimistic scenario has moderate reliance on SNG; it
             assumes
                        MD gets access to its population weighted-share of national
                         feedstocks                                                                                                                                                                         Present-day gas
                                                                                                                                                                                                            demand is ~160 TBTU
                        NO competition for renewable liquid fuels, meaning all
                         biomass feedstocks would be available for RNG production                                                                                                                                   160

Sources & assumptions: Biomass supply assumptions are developed from the 2016 Billion Ton Report (DOE, 2016), with supplemental landfill gas assumptions from the Renewable Sources of Natural Gas report (American Gas Foundation, 2019). The
conservative scenario assumes SNG is produced with CO2 from Direct Air Capture (DAC), the optimistic scenario assumes SNG is produced using waste bio-CO2 from biofuels. The 7% hydrogen blend is as a percentage of energy content. More
background on cost assumptions are included in the Appendix.

                                                                                         Early Results and Preliminary                                                                                                                           14
Gas composition transitions to RNG
Gas commodity blend in 2045 (Conservative)                  By 2045, all building scenarios have 100%
                                                             blend of RNG in the remaining gas demand
               -21%        -62%            -94%
                                                                • This helps all scenarios reach zero direct building
                                                                  emissions target by 2045
                                                                • Hydrogen blend in pipeline is assumed in all
                                                                  scenarios where it makes economic sense, up to
                                                                  7% in energy content (20% in volume) which is the
                                                                  maximum current natural gas pipelines can take
                                                                  without significant modification
                                                            In a conservative RNG scenario where
Gas commodity blend in 2045 (Optimistic)                     biomass supply is limited, SNG is the main
                                                             source of low-carbon gas in all scenarios
               -21%         -62%           -94%             In an optimistic RNG scenario where
                                                             biomass supply is relatively abundant,
                                                             biomethane becomes the main source of
                                                             low-carbon gas
                                                                • The High Electrification and Electrification with
                                                                  Fuel Backup scenarios do not need SNG due to
                                                                  their low gas demand
                                       Early Results and Preliminary                                                    15
All scenarios reduce total energy demand

 Overall energy demand decreases through 2045 in all scenarios
       • Deep electrification almost eliminates gas demand by 2045 under the High Electrification Scenario
       • Gas demand decreases ~62% in the fuel backup scenario due to adoption of dual-fuel heat pumps, while overall
         energy demand falls 32%
       • Efficiency gains from building shell improvements and efficient appliance adoption reduce overall demand by 13% in
         the High Decarbonized Methane Scenario

 High Electrification                                                                             Electrification with Fuel Backup                                                                 High Decarbonized Methane
 450                                                                                              450                                                                                              450
 400                                                                                              400                                                                                              400                                             -13% relative to reference
 350                                                                       -44%                   350                                                            -32% relative                     350
 300                                                                  relative to                 300                                                             to reference                     300
 250                                                                  reference                   250                                                                                              250
 200                                                                                              200                                                                                              200
 150                                                                                              150                                                                                              150
 100                                                                                              100                                                                                              100
 50                                                                                                50                                                                                              50
  -                                                                                                -                                                                                                -
       2021

              2023

                     2025

                            2027

                                   2029

                                          2031

                                                 2033

                                                        2035

                                                               2037

                                                                      2039

                                                                             2041

                                                                                    2043

                                                                                           2045

                                                                                                        2021

                                                                                                               2023

                                                                                                                      2025

                                                                                                                             2027

                                                                                                                                    2029

                                                                                                                                           2031

                                                                                                                                                  2033

                                                                                                                                                         2035

                                                                                                                                                                2037

                                                                                                                                                                       2039

                                                                                                                                                                              2041

                                                                                                                                                                                     2043

                                                                                                                                                                                            2045

                                                                                                                                                                                                         2021

                                                                                                                                                                                                                2023

                                                                                                                                                                                                                       2025

                                                                                                                                                                                                                              2027

                                                                                                                                                                                                                                     2029

                                                                                                                                                                                                                                            2031

                                                                                                                                                                                                                                                    2033

                                                                                                                                                                                                                                                           2035

                                                                                                                                                                                                                                                                  2037

                                                                                                                                                                                                                                                                         2039

                                                                                                                                                                                                                                                                                2041

                                                                                                                                                                                                                                                                                       2043

                                                                                                                                                                                                                                                                                              2045
  * Year 2021 will not perfectly match reference because electrification/efficiency adoption begins in model year 2017

                                                                                                  Early Results and Preliminary                                                                                                                                                                      16
Electric system peak impacts
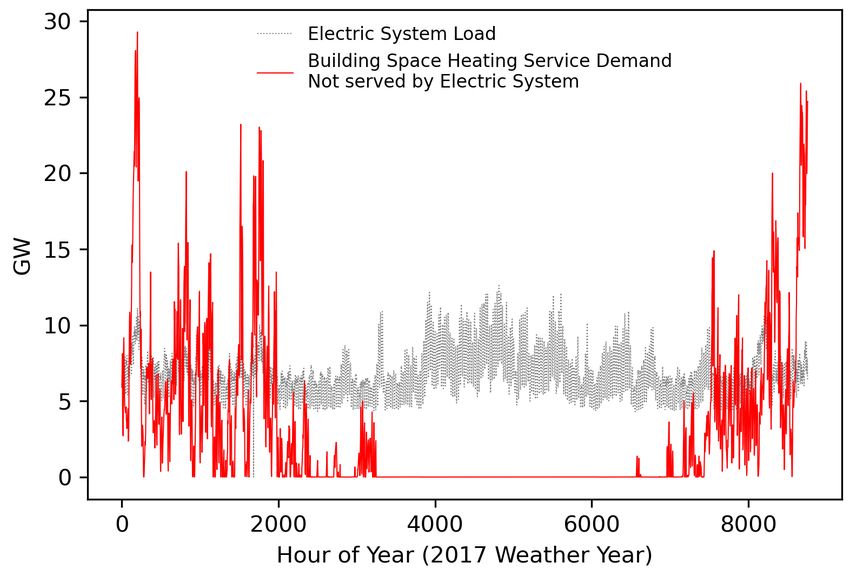
Maryland’s current electric system peaks in summer

                                                                                                                                                       Currently, Maryland’s electricity
                                                                                                                                                        system experiences peak load in
                                                                                                                                                        summer months
                                                                                                                                                               • Load peaks at around 13 GW, mainly as a
                                                                                                                                                                 result of residential and commercial air
                                                                                                                                                                 conditioning
                                                                                                                                                       Maryland’s building heat load,
                                                                                                                                                        however, currently mainly supplied by
                                                                                                                                                        gas, shows a large peak in winter as a
                                                                                                                                                        result of the state’s cold winter climate
                                                                                                                                                               • Building heat loads represent service
                                                                                                                                                                 demand of both space and water heating,
                                                                                                                                                                 i.e. total heating load if all supplied by
                                                                                                                                                                 electric resistance
                                                                                                                                                               • Moving the thermal load from gas to
                                                                                                                                                                 electric will result in a significant increase
                                                                                                                                                                 in electric peak in winter
       Electric system summer peak in 2017 was approximate 12.6 GW and the winter peak was approximately 11.1 GW.

Sources & assumptions: Building thermal load is based on PATHWAYS total space and water heating service. Shape of the thermal load is calculated using E3’s RESHAPE model. Note that the chart shows imputed system load for November and December as a
result of data gaps.

                                                                                           Early Results and Preliminary                                                                                                                        18
Maryland is expected to have little peak load growth in
                             the High Decarbonized Methane scenario

            In the High Decarbonized Methane scenario, the small peak load growth is due to growth of
             households and economy.

              Peak Load Projection 2021-2050                                                                                   Contribution to 1-in-2 System Peak by Sector
              High Decarbonized Methane                                                                                        High Decarbonized Methane

                                                                                                                                                  Time of Day
                                                                                                                                                  Peak Impact

                  *In 2045, the 1-in-10 and 1-in-40 summer peak is 0.6 and 0.7 GW higher than the 1-in-2
                  peak, respectively.
Sources & assumptions: Coincident peak load is based on a modeled hourly load for MD. The projected hourly load is calculated using incremental load in 2050 modeled from PATHWAYS and end-use shapes from RESHAPE based on 2017 weather added to the
2017 historical load.

                                                                                          Early Results and Preliminary                                                                                                                       19
Winter peak load is expected to grow by 15 GW by 2045 in
                             the High Electrification scenario
            In the High Electrification scenario, Maryland’s electricity system is expected to become winter peaking in
             the near future, and will more than double the current system peak by 2045
                    • Switching to heat pumps from electric resistance heating, which is currently used in about 25% of Maryland households, has a
                      much smaller impact on peak heating load than on annual total heating loads

    Peak Load Projection 2021-2045                                                                                            Contribution to 1-in-2 System Peak by Sector
    High Electrification                                                                                                      High Electrification – Current Installation Practice

       *In 2045, the 1-in-10 and 1-in-40 summer peak is 0.5 GW higher than the 1-in-2 peak
Sources & assumptions: Coincident peak load is based on a modeled hourly load for MD. The projected hourly load is calculated using incremental load in 2050 modeled from PATHWAYS and end-use shapes from RESHAPE based on 2017 weather added to the
2017 historical load.

                                                                                          Early Results and Preliminary                                                                                                                       20
Electrification with Fuel Backup scenario has much
                             smaller winter peak load growth
              Compared to the High Electrification scenario, Maryland’s electricity system becomes winter
               peaking about a decade later
              Peak load will be 2 GW higher by 2045 than the current system peak
              Peak Load Projection 2021-2045                                                                                   Contribution to 1-in-2 System Peak by Sector
              Electrification with Fuel Backup                                                                                 Electrification with Fuel Backup

                *In 2045, the 1-in-10 and 1-in-40 summer peak is 0.5 GW higher than the 1-in-2 peak

Sources & assumptions: Coincident peak load is based on a modeled hourly load for MD. The projected hourly load is calculated using incremental load in 2050 modeled from PATHWAYS and end-use shapes from RESHAPE based on 2017 weather added to the
2017 historical load.

                                                                                          Early Results and Preliminary                                                                                                                       21
System Cost Impact
Approach for system cost impact analysis

 The following four cost components are considered in the system cost impact analysis
 System costs of the three main scenarios are calculated as incremental to Reference

     Electric System             Gas System                     Equipment                 Other Fuels

  ❑Investment in             ❑Capital expenditure for     ❑Investment in efficient   ❑Fuel commodity costs
   additional transmission    reinvestment in the gas      or electric appliances     for bio-based liquid
   and distribution           system                       relative to a reference    fuels to replace fossil
   infrastructure            ❑Operating costs to           appliance                  fuels, mainly bio-diesel
  ❑Investment in              maintain the gas            ❑Investment in building     replacing fossil-based
   additional generating      system                       shell improvement          heating oil
   capacity to meet the      ❑Gas commodity costs
   peak electric demand       for RNG to replace
  ❑Generation cost to         natural gas
   meet the additional
   electricity demand

                                     Early Results and Preliminary                                               23
Meeting electric loads in the High Electrification scenario requires
                         around $2-3 billion of annual incremental system costs

    Annual Incremental Electric System Costs relative to Reference in 2045                                                      High levels of electrification
    (2021$ Billions per year)                                                                                                    significantly increase electricity
                                                                                                                                 system costs, mainly for meeting
                                                                                                                                 peak capacity needs.
                                                                                                                                  • Improving system installation
                                                                                                                                    practices would result in less
                                                                                                                                    increase in electric system costs,
                                                                                                                                    only ~60% of that in the High
                                                                                                                                    Electrification scenario
                                                                                                                                Pairing ASHPs with fuel systems
                                                                                                                                 can save more than 80% of the
                                                                                                                                 incremental costs, mainly by
                                                                                                                                 avoiding T&D infrastructure and
                                                                                                                                 generating capacities
                                                                                                                                  • System costs in the Electrification
                                                                                                                                    with Fuel Back Up scenario are $0.4
                                                                                                                                    billion in 2045 compared to $3.2
                                                                                                                                    billion for the High Electrification
                                                                                                                                    scenario
Sources & assumptions: Details of the electric sector cost assumptions are documented in the Appendix

                                                                                               Early Results and Preliminary                                             24
Gas system cost in all scenarios show wide ranges because of the
       large uncertainty associated with RNG commodity costs
                                                             High Decarbonized Methane scenario has the
Annual Incremental Gas System Costs relative to Reference     biggest range of incremental system costs due to
in 2045 ($2021 Billions per year)                             its high gas demand
                                                                 • Meeting all gas demand with RNG in the High
                                                                   Decarb Methane scenario can increase the annual
                                                                   gas system cost by up to $12B
                                                             Reduced throughput in the Electrification with
                                                              Fuel Backup scenario results in much lower
                                                              system costs and less wide cost ranges
                                                                 • The blend of RNG results in higher gas commodity
                                                                   costs and overall gas system costs relative to
                                                                   Reference even though throughput is less
                                                             High Electrification scenario has lower gas
                                                              system costs relative to Reference due to both
                                                              lower gas demand and lower infrastructure costs
                                                                 • We assume that reduced peak gas throughput in this
                                                                   scenario would require less capital reinvestment and
                                                                   O&M to maintain the gas system

                                       Early Results and Preliminary                                                25
The two book-end scenarios have relatively high incremental
         equipment costs due to building shell improvement

Levelized Total Incremental Equipment Costs in 2045
($2021 Billions per year)
                                                                                            High and low equipment cost profiles
                                                                                             creates uncertainty around future costs in
                  $9.7
                                                                                             the two book-end scenarios
                                                                                              • Building shell upgrades account for the majority
                                                                                 $6.4           of equipment costs
 $4.4                                                                                         • Current costs are based on deep shell retrofits
                                                                   $3.9
                                                                                                that include energy efficiency and heat recovery,
                                                  $2.4
                                                                                                and are highly uncertain and location-specific
                                 $0.6
                                                                                            Electrification with Fuel Backup is the
                                                                                             lowest-cost scenario because it does not
 Low             High            Low              High             Low          High
                                                                                             include building shell improvement
 High Electrification       Electrification with Fuel Backup   High Decarbonized Methane

               HVAC                                Water Heating

               Cooking & Clothes Drying            Building Shell Improvement

                                                               Early Results and Preliminary                                                        26
Electrification with Fuel Backup scenario is expected to be the
                            relatively low-cost and low-risk path among the three scenarios
        Incremental Total Resource Costs for Buildings (2045)
        ($2021 Billions per year)                                                                                                                        Building sector costs show large
                                                                                                                                                          variation across scenarios
                                                $17                                                                                                       depending on:
                                                                                                                                                           • Gas fuel costs (optimistic/conservative
                                                                                                                                                             supply curve)
                              High fuel costs

                                                                                                         $12
                                                                                                                                                           • Equipment costs (mainly building shell
                                                                                                                                                             upgrade costs)
                                                                          $7                                                                               • Installation practice for electric heating
                                                                                                                                                             systems
                                                                                                                                                         A hybrid scenario could potentially
                                                                                                                           Range of Total Incremental
                                                                                                                           Cost
                                                                                                                                                          “hedge” for this uncertainty given
                                                                                                                                                          its lower overall costs and narrow
                                                                                                                                                          cost ranges

      Total cost range reflects assumptions regarding fuel costs, equipment cost, and heat pump
      installation practices
Sources & assumptions: These charts show incremental resource costs of the scenarios compared to the reference scenario.

                                                                                             Early Results and Preliminary                                                                                27
Gas and Electric Rate Impact
Gas rates increase significantly across all scenarios

Residential gas rates (2021$/MMBtu)

                                                         High Electrification scenario experiences a rapid
                                                          rate increase driven by declining throughput despite
                                                          lower total delivery and commodity costs
                                                         Rate increases in the High Decarbonized Methane
                                                          scenario are driven primarily by the commodity cost
                                                          for zero carbon fuel
                                                         Electrification with Fuel Backup scenario has
                                                          higher gas rates than the High Decarbonized
                                                          Methane scenario, due to its lower throughput and
                                                          the resulting higher per MMBtu delivery cost

                                                       *Range shown in figure reflects the commodity cost forecast uncertainty

                                      Early Results and Preliminary                                                          29
High Electrification scenario shows a more rapid electric
          rate increase compared to Electrification with Gas Back Up
 The Electrification + Gas Back-up scenario is projected to have a lower rate increase because it has
  a smaller load factor and manages to avoid the expensive peak capacity investment.

Electric rates in the High Electrification Scenario                       Electric rates in the Electrification + Gas Back-up Scenario
(2021$/kWh)                                                               (2021$/kWh)

                                                      Early Results and Preliminary                                                      30
Consumer Economics
Illustrative customer bill impacts – residential single-family

                                        Across all scenarios, customers remaining on the gas system may experience a large increase in utility bills due
                                         to the blend of expensive RNG to decarbonize gas use
                                        CAVEAT: These are not predictions of customer bills, but a representation of the potential dynamics under the
                                         current ratemaking model. These results indicate the potential equity and affordability challenges that will
                                         require systemic changes to the current dynamics.

                                                      High Electrification
                                                                                            Electrification with Fuel Backup            Decarbonized Gas
                                       $1,000
Levelized Utility Bill [2021$/Month]

                                        $800
                                                                                                                                                                         Mixed Fuel

                                        $600
                                                                                                                                                                         All-Electric

                                        $400
                                                                                                                                                                         Electric SH
                                                                                                                                                                         and WH with
                                                                                                                                                                         fuel backup
                                        $200

                                          $0                                         2025     2030     2035     2040      2045   2025    2030    2035      2040   2045
                                            2025     2030    2035      2040   2045

                                                                                      Early Results and Preliminary                                                            32
Electrifying heating with fuel backup is expected to be the least
                                           expensive option when both capital and operating costs are considered

                                   “Hybrid” customers can save money by utilizing their existing fuel-based heating equipment to
                                    provide backup heating during coldest hours of a year, and by not having to upgrade building
                                    shells

                                            High Electrification                                  Electrification with Fuel Backup                  High Decarbonized Methane

                                  $10 K
Annual Consumer Cost [2021$/yr]

                                            $7.8 K
                                   $8 K
                                                                                                  $7.0 K
                                                                                                                                                   $6.2 K                                      Gas
                                   $6 K                     $5.7 K                                                $5.5 K                                        $5.5 K

                                                                                                                                                                                               Electricity
                                                                             $3.8 K
                                   $4 K                                                                                            $3.4 K
                                                                                                                                                                                 $3.1 K
                                                                                                                                                                                               O&M

                                   $2 K
                                                                                                                                                                                               Annualized
                                                                                                                                                                                               Capital Cost
                                   $0 K
                                          Mixed-Fuel      All-Electric   Electric SH and       Mixed-Fuel       All-Electric   Electric SH and   Mixed-Fuel   All-Electric   Electric SH and
                                                                          WH with fuel                                          WH with fuel                                  WH with fuel
                                                                             backup                                                backup                                        backup

                                           * Gas costs, electricity costs, and equipment costs are based on 2035 rates

                                                                                               Early Results and Preliminary                                                                                  33
All-electric design is expected to be the less expensive option

                                   All-electric new construction is cheaper than mixed-fuel new construction for single-family
                                    residential homes across all decarbonization scenarios due to both lower capital (with avoided gas
                                    connection) and operating costs

                                               High Electrification                             Electrification with Fuel Backup       High Decarbonized Methane
                                  $10 K
Annual Consumer Cost [2021$/yr]

                                   $8 K         $7.2 K
                                                                                                     $6.5 K                                                           Gas

                                   $6 K                                                                                                  $5.6 K
                                                                                                                                                                      Electricity
                                                                        $4.0 K                                            $3.8 K                         $3.8 K
                                   $4 K                                                                                                                               O&M

                                   $2 K                                                                                                                               Annualized
                                                                                                                                                                      Capital Cost

                                   $0 K
                                              Mixed-Fuel              All-Electric                 Mixed-Fuel           All-Electric   Mixed-Fuel      All-Electric

                                          * Gas costs, electricity costs, and equipment costs are based on 2035 rates

                                                                                                                                                                                     34
Conclusions
Conclusions
 All scenarios demonstrate technologically feasible pathways to achieve zero direct building emissions by
  2045.
   • Achieving this level of building decarbonization would require extensive technology deployment and commercialization
     efforts.
 The High Decarbonized Methane pathway requires high demand for zero-carbon fuels, resulting in high
  incremental fuel costs with significant cost uncertainty
 The High Electrification pathway results in a shift from a summer peak to a winter peak, mainly as a result
  of space heating loads in winter.
 The Electrification with Fuel Backup pathway shows lowest overall costs while also reducing reliance on
  technologies that have not yet been widely commercialized or that are uncertain in their scalability.
 Each scenario presents its own equity and affordability challenges
   • The average costs of the gas service are likely to increase in an electrification scenario as customers leave the system
     and infrastructure costs are spread over a smaller customer base.
   • Emphasis on mitigating the energy burden with customers ‘staying behind’ is important.
 Other factors including but not limited to health impact, job impact and methane leakage, which are beyond
  the scope of this study, need further investigation to provide a more complete evaluation of impact of the
  different pathways
                                          Early Results and Preliminary                                                    36
Appendix
Scenario parameters
Sector           Parameter                   Reference (2020 Reference Scenario            High Electrification                            Electrification with Fuel Backup                High Decarbonized Methane
                                             from the GGRA work)

                 Appliance efficiency        Current EMPOWER program                       Increased EE targets from utilities             Renewed EMPOWER through 2030                    Increased EE targets from gas utilities
                                             • 50% of new sales of electric                (consistent with GGRA Optimistic Sensitivity)   (consistent with 2030 GGRA Plan)                • 100% new sales of efficient natural gas
                                                appliances are assumed to be efficient     • 100% new sales of electric appliances         • 50% new sales of electric appliances             appliances by 2030
                                                through 2023                                  are assumed to be efficient through 2030        are assumed to be efficient through          • Electric appliance sales
                                                                                           • 25% new sales of natural gas appliances          2030
                                                                                              by 2030                                      • 25% new sales of natural gas
                                                                                                                                              appliances by 2030

                 Building shell efficiency   Improved building shell sales in all          Improved building shell sales in all new        Reference                                       Improved building shell sales in all new
                                             residential new construction by 2030          construction retrofit buildings by 2030                                                         construction and retrofit buildings by 2030

                                                                                           (An improved building shell reduces heating
  Buildings                                                                                demand of a residential home by 29% and
(residential +                                                                             that of a commercial building by 34% relative
commercial)                                                                                to a typical existing building)

                 Building electrification    Linear adoption trend from historical sales   50% sales of electric heat pumps by 2025        •   100% sales by 2035 of regular ASHP          •   Reference for electric HPs
                 (heat pump sales            of heat pumps (20% of space heater sales      (consistent with GGRA Optimistic                    with gas furnace backup for non-new         •   Gas in new construction
                 share)                      are heat pumps by 2045)                       Sensitivity), 100% sales by 2035                    construction natural replacements
                                                                                           • 90% ccASHP                                    •   All-electric new construction with 90%
                                                                                           • 10% GSHP (targeting medium/large rural            ccASHP and 10% GSHP
                                                                                              homes currently on non-NG heating and
                                                                                              campuses)
                                                                                           • Electric resistance back-up

                 Behavioral                  Consistent with 2020 Reference                                                                      Consistent with 2030 GGRA Plan
                 conservation and other
                 non-stock sectors

                 Fuel blend in 2050          100% natural gas and fuel oil                 100% RNG (used mainly for remaining gas         100% RNG (used mainly for gas backup):          100% RNG and renewable diesel:
                                                                                           customers):                                     • 93% RNG from biomass and Synthetic            • 93% RNG from biomass and Synthetic
Decarbonized
                                                                                           • 93% RNG from biomass and Synthetic               Natural Gas                                     Natural Gas
    fuels
                                                                                              Natural Gas                                  • 7% RNG with blended hydrogen                  • 7% RNG with blended hydrogen
                                                                                           • 7% RNG with blended hydrogen blend

                 Electricity sector          Consistent with 2020 Reference                Consistent with 2030 GGRA Plan
                 emission intensity                                                        (additional load will be met by a mix of renewable build and PJM imports; additional capacity need will be provided by a mix of renewables and
  Electricity
                                                                                           storage with their corresponding ELCC values with the rest covered by new CTs build; this study will not identify the specific location of the
                                                                                           new resource build, which could be in MD or other PJM states. For details, see the input assumptions deck)

                                                                                                                                                                                                                                  38
You can also read