Mapping India's Climate Vulnerability - A District Level Assessment Centre for Energy Finance - Hindustan Times
←
→
Page content transcription
If your browser does not render page correctly, please read the page content below
Centre for
                        Energy Finance

Mapping India’s
Climate Vulnerability
A District Level Assessment

Abinash Mohanty and Shreya Wadhawan
Report   October 2021
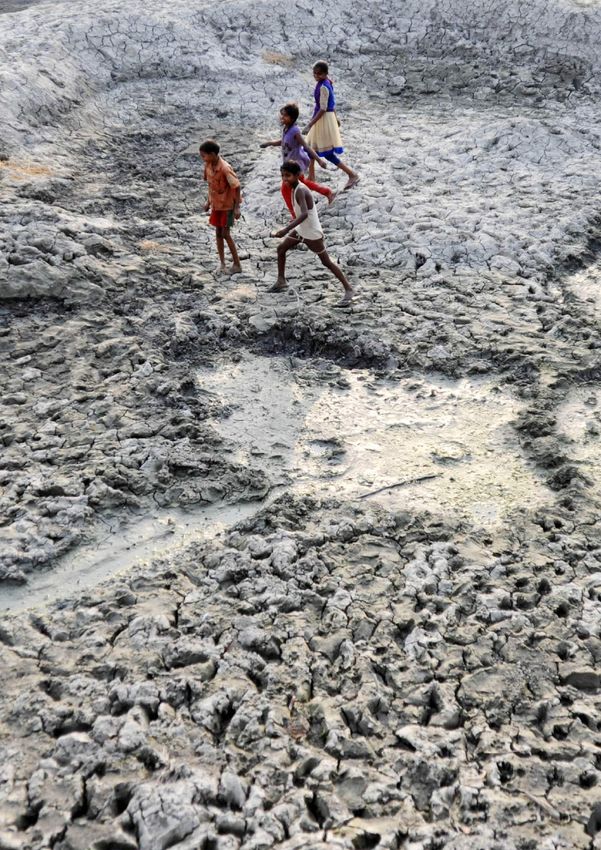
Mapping India’s Climate Vulnerability: A District Level Assessment

CEEW analysis indicates that implementing robust
risk mitigation mechanisms and investing in better
disaster preparedness alone could have saved India
over Rs 6.76 trillion (USD 89.7 billion) in the past
two decades.

Image: Shawn Sebastian
Centre for
       Energy Finance

   Mapping India’s
Climate Vulnerability
  A District Level Assessment

 Abinash Mohanty and Shreya Wadhawan

                Report
             October 2021
               ceew.in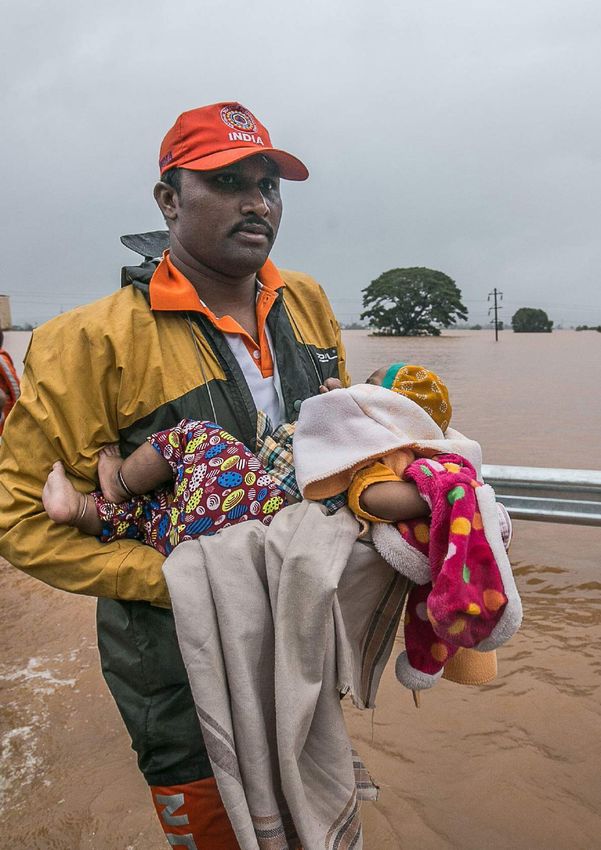
Mapping India’s Climate Vulnerability: A District Level Assessment

                                   Copyright © 2021 Council on Energy, Environment and Water (CEEW).

                                   Open access. Some rights reserved. This work is licensed under the Creative Commons Attribution-
                                   Noncommercial 4.0. International (CC BY-NC 4.0) license. To view the full license, visit: www.
                                   creativecommons.org/licenses/by-nc/4.0/legalcode.

Suggested citation:                Mohanty, Abinash, and Shreya Wadhawan. 2021. Mapping India’s Climate Vulnerability – A District Level
                                   Assessment. New Delhi: Council on Energy, Environment and Water.

Disclaimer:                        The views expressed in this issue brief are those of the authors and do not necessarily reflect the views
                                   and policies of the Council on Energy, Environment and Water or The Climate Collaborative, or the
                                   EdelGive Foundation.

Cover image:                       Alamy.

Peer reviewers:                    Dr Majorie Mcquirk, Subject Matter Expert-WMO & President-CASE; Dr Carmine Gallasso, Professor, UCL
                                   Institute for Risk and Disaster Reduction; Dr Roxy Mathew Koll, Scientist, Centre for Climate Change
                                   Research, IITM, under the aegis of the Ministry of Earth Sciences; Lead Author, Intergovernmental Panel
                                   on Climate Change (IPCC) Special Report on the Ocean and Cryosphere in a Changing Climate; Vaibhav
                                   Chaturvedi, Fellow, CEEW, and Karthik Ganesan, Fellow and Director - Research Coordination, CEEW.

Publication team:                  Alina Sen (CEEW), Ganesh Radha-Udayakumar (CEEW), The Clean Copy, Twig Designs, and Friends
                                   Digital.

Organisation:                      The Council on Energy, Environment and Water (CEEW) is one of Asia’s leading not-for-profit policy
                                   research institutions. The Council uses data, integrated analysis, and strategic outreach to explain – and
                                   change – the use, reuse, and misuse of resources. It prides itself on the independence of its high-quality
                                   research, develops partnerships with public and private institutions, and engages with the wider public.
                                   In 2021, CEEW once again featured extensively across ten categories in the 2020 Global Go To Think
                                   Tank Index Report. The Council has also been consistently ranked among the world’s top climate change
                                   think tanks. CEEW is certified as a Great Place To Work®. Follow us on Twitter @CEEWIndia for the latest
                                   updates.

                                   Council on Energy, Environment and Water
                                   Sanskrit Bhawan, A-10 Qutab Institutional Area,
                                   Aruna Asaf Ali Marg, New Delhi - 110067, India
About CEEW
The Council on Energy, Environment and Water (CEEW) is one of Asia’s leading not-for-profit policy research
institutions. The Council uses data, integrated analysis, and strategic outreach to explain — and change —
the use, reuse, and misuse of resources. The Council addresses pressing global challenges through an integrated
and internationally focused approach. It prides itself on the independence of its high-quality research, develops
partnerships with public and private institutions, and engages with the wider public.

The Council’s illustrious Board comprises Mr Jamshyd Godrej (Chairperson), Mr Tarun Das, Dr Anil Kakodkar,
Mr S. Ramadorai, Mr Montek Singh Ahluwalia, Dr Naushad Forbes, Ambassador Nengcha Lhouvum Mukhopadhaya,
and Dr Janmejaya Sinha. The 120-plus executive team is led by Dr Arunabha Ghosh. CEEW is certified as a
Great Place To Work®.

In 2021, CEEW once again featured extensively across ten categories in the 2020 Global Go To Think Tank Index Report,
including being ranked as South Asia’s top think tank (15th globally) in our category for the eighth year in a row.
CEEW has also been ranked as South Asia’s top energy and resource policy think tank for the third year running.
It has consistently featured among the world’s best managed and independent think tanks, and twice among the
world’s 20 best climate think tanks.

In ten years of operations, The Council has engaged in 278 research projects, published 212 peer-reviewed books,
policy reports and papers, created 100+ new databases or improved access to data, advised governments around
the world nearly 700 times, promoted bilateral and multilateral initiatives on 80+ occasions, and organised 350+
seminars and conferences. In July 2019, Minister Dharmendra Pradhan and Dr Fatih Birol (IEA) launched the CEEW
Centre for Energy Finance. In August 2020, Powering Livelihoods — a CEEW and Villgro initiative for rural start-ups —
was launched by Minister Mr Piyush Goyal, Dr Rajiv Kumar (NITI Aayog), and H.E. Ms Damilola Ogunbiyi (SEforAll).

The Council’s major contributions include: The 584-page National Water Resources Framework Study for India’s
12th Five Year Plan; the first independent evaluation of the National Solar Mission; India’s first report on global
governance, submitted to the National Security Adviser; irrigation reform for Bihar; the birth of the Clean Energy
Access Network; work for the PMO on accelerated targets for renewables, power sector reforms, environmental
clearances, Swachh Bharat; pathbreaking work for the Paris Agreement, the HFC deal, the aviation emissions
agreement, and international climate technology cooperation; the concept and strategy for the International Solar
Alliance (ISA); the Common Risk Mitigation Mechanism (CRMM); critical minerals for Make in India; modelling
uncertainties across 200+ scenarios for India’s low-carbon pathways; India’s largest multidimensional energy access
survey (ACCESS); climate geoengineering governance; circular economy of water and waste; and the flagship event,
Energy Horizons. It recently published Jobs, Growth and Sustainability: A New Social Contract for India’s Recovery.

The Council’s current initiatives include: A go-to-market programme for decentralised renewable energy-
powered livelihood appliances; examining country-wide residential energy consumption patterns; raising consumer
engagement on power issues; piloting business models for solar rooftop adoption; developing a renewable energy
project performance dashboard; green hydrogen for industry decarbonisation; state-level modelling for energy and
climate policy; reallocating water for faster economic growth; creating a democratic demand for clean air; raising
consumer awareness on sustainable cooling; and supporting India’s electric vehicle and battery ambitions. It also
analyses the energy transition in emerging economies, including Indonesia, South Africa, Sri Lanka and Vietnam.

The Council has a footprint in 22 Indian states, working extensively with state governments and grassroots
NGOs. It is supporting power sector reforms in Uttar Pradesh and Tamil Nadu, scaling up solar-powered irrigation in
Chhattisgarh, supporting climate action plans in Gujarat and Madhya Pradesh, evaluating community-based natural
farming in Andhra Pradesh, examining crop residue burning in Punjab, promoting and deploying solar rooftops in
Delhi, Bihar and Meghalaya.

Mapping India’s Climate Vulnerability: A District Level Assessment

Acknowledgments
We would like to thank Mr Kamal Kishore, Member Secretary, National Disaster Management Authority (NDMA),
Government of India, for sharing his time and knowledge and motivating us to undertake this study. We would
also like to express our gratitude to the members of High-Level Advisory Group on Climate Risk Atlas (Mr Sandeep
Poundrik, Chair and Director General, Coalition of Disaster Resilient Infrastructure (CDRI); Dr Osvaldo L L Moraes
Chair, BRICS Working Group on Climate Change and Director, CEMADEN, Brazil; Dr Dipak Gyawali, Former Minister
of Water Resources, Government of Nepal; Dr Marjorie McGuirk, Subject Matter Expert, World Meteorological
Organization (WMO); Ms Iria Tourzan, Knowledge Management Officer, UNDRR Asia Pacific; Prof Carmine Gallaso
Professor, UCL Institute for Risk and Disaster Reduction; Ms Shloka Nath, Executive Director, India Climate
Collaborative (ICC); Ms Laura Schafer, Senior Advisor, Germanwatch; and Dr Arunabha Ghosh, CEO, CEEW) for their
continued guidance, support, and feedback and for sharing many of their insightful perspectives with us.

We thank Dr A. V. P. Prasad, Deputy Director, Indian Space Research Organisation (ISRO), Government of India, and
Dr T. Ravi Sankar, Deputy Director and Group Head, National Remote Sensing Centre (NRSC), ISRO, for supporting us
with their valuable comments and providing us access to base-level maps of the Indian subcontinent. We would like
to thank Ms Edel Monteiro, Programme Lead at the India Climate Collaborative, for sharing insightful perspectives
and for the support. We would also like thank the India Climate Collaborative and the EdelGive Foundation for
funding support.

We acknowledge the insights and feedback of domain experts at various national, international, and
intergovernmental organisations who participated in various expert consultations panned across the tenure of the
project. We also acknowledge the contributions of Ms Anuva Chowdhury, Research Analyst; Ms Shweta Rathore,
former consultant; and our research interns, Ms Aditi Kumari, Mr Ginlal Siam, and Ms Ashmita Biswas.

Our reviewers, Dr Majorie Mcquirk, Subject Matter Expert, World Meteorological Organisation; Dr Carmine Gallaso,
Professor, UCL Institute for Risk and Disaster Reduction; and Dr Roxy Mathew Koll, Scientist, Centre for Climate
Change Research, IITM, Ministry of Earth Sciences; Lead Author, IPCC Special Report on the Ocean and Cryosphere
in a Changing Climate, provided thoughtful comments, critical insights, and valuable feedback, which helped us
improve this study. For this, we are incredibly thankful.

We are indebted to the CEEW team, particularly to Dr Vaibhav Chaturvedi and Mr Karthik Ganesan, for their insightful
comments as internal reviewers and to the CEEW Outreach team for their continued support through the process of
developing this document. We would like to thank Ms Shuva Raha for her timely insights and feedback. We would
also like to thank Mr Santosh Pal, Mr Gandhar G Ukidve, Ms Harsimran Kaur, and Dr Deepak Yadav for their support
in translating the regional DDMPs for the evaluation.

The authors

Abinash Mohanty                                     Shreya Wadhawan
abinash.mohanty@ceew.in                             shreya.wadhawan@ceew.in

Abinash is a Programme Lead with the                Shreya is a consultant with the Risks and
Risks and Adaptation research focus area            Adaptation team research focus area at
at CEEW. His work primarily involves                CEEW. Her work is focused at extreme
designing decision-making toolkits for              events spatio-temporal analysis that helps
effective policymaking around the intricacies       in designing decision making tools. This
of climate change risks, sustainability, and        includes intersecting science, policy and
environmental resources management. He has          practice to mainstream climate actions. She
more than a decade of experience in evidence-       holds a master’s degree in Environmental
based policy research on climate change risks       Management from the Guru Gobind Singh
and impacts, water management, climate              Indraprastha University, New Delhi.
change financing, and in managing projects.
He is also a reviewer of the IPCC’s sixth
assessment report on Impacts, Adaptation and
Vulnerability (AR6).

“The frequency and intensity of extreme climate     “Scaling up climate actions is intrinsic to
events in India have increased by almost 200%       tackle rapidly intensifying climate extremes.
since 2005. Our policymakers, industry leaders      The Climate Vulnerability Index (CVI) will
and citizens must use the district-level analysis   help decision-makers identify the changing
to make effective risk-informed decisions.          landscape of risks at a localised level and help
Climate-proofing of physical and ecosystem          take robust risk-informed decisions that can be
infrastructures should also now become a            tailor-made at the landscape level to mitigate
national imperative. Further, India must create     the scale of impacts of these extremes. While
a new Climate Risk Commission to coordinate         CVI maps the compounding impacts of these
the environmental de-risking mission. Finally,      extremes, it centres around the ability of the
with loss and damage rising exponentially due       communities, governance mechanisms to build
to the climate crisis, India must demand climate    back better by devising means and ways to
finance for adaptation-based climate actions at     enhance the resilient and adaptive capacity.”
COP26.”

Mapping India’s Climate Vulnerability: A District Level Assessment

In 2021, Himachal Pradesh alone witnessed
30 cloud burst incidences, of which 12 in the
pre-monsoon season and 18 during southwest
monsoon months (SANDRP 2021).

Image: Alamy

Contents

Executive summary                                                                                    i

Why does India need a climate vulnerability index?
Developing a climate vulnerability index (CVI) for India
Mapping India’s vulnerability: key findings
Building India’s climate resilience

1. Understanding the vulnerability landscape of India in a changing climate scenario                 1

  1.1 Identifying the climate risk landscape through a vulnerability assessment                      2
  1.2 Integrated vulnerability assessment                                                            6
  1.3 Research questions                                                                             7

2. Mapping India’s vulnerability: methodology                                                        9

  2.1 Introduction: spatial index–based vulnerability assessment framework for managing             10
      climate extremes
  2.2 Development of a composite index–based approach for vulnerability assessment                  11

3. State of vulnerability of Indian districts and states                                            29

  3.1 State of exposure                                                                             30
  3.2 State of sensitivity                                                                          35
  3.3 State of adaptive capacity                                                                    39
  3.4 State of vulnerability                                                                        42

4. Building a climate-resilient India: Recommendations                                              51
  4.1 Develop a Climate Risk Atlas                                                                  52
  4.2 Establish a climate risk commission                                                           52
  4.3 Climate sensitivity–led landscape restoration Climate sensitivity–led landscape restoration   52
  4.4 Climate risk profile–informed infrastructure planning                                         53
  4.5 Climate vulnerability index–based risk financing                                              53

References                                                                                          54

Annexure I                                                                                          61
Mapping India’s Climate Vulnerability: A District Level Assessment
Tables
Table ES1: Assam, Andhra Pradesh, and Maharashtra are the top three climate vulnerable
states in India
Table ES2: Southern-zone is the most vulnerable to all three extreme hydro-met disasters
Table ES3: North-eastern and eastern zones of India are highly exposed to extreme flood events
Table 1: Component-based shortlisted indicators for the vulnerability assessment
Table 2: Classification of extreme events considered in the study
Table 3: Pairwise comparison matrix for flood
Table 4: Comparison between AHP and PCA
Table 5: AHP prioritisation ranking for floods, cyclones, and droughts
Table 6: Correlation of adaptive capacity indicators
Table 7: Top 20 flood-exposed districts
Table 8: The top 20 drought-exposed districts
Table 9: Top 20 highly cyclone-exposed districts
Table 10: Flood hotspots in India
Table 11: Drought hotspots in India
Table 12: Cyclone hotspots in India
Table 13: Key findings on the state of adaptive capacity for hydro-met disasters
Table 14: Dhemaji, Khammam, Gajapati, Vizianagaram and Sangli are the 5 most vulnerable
districts of India
Table 15: Assam, Andhra Pradesh, and Maharashtra top India’s CVI
Table A1: List of hotspot districts, their vulnerability indices and ranks in the all-India
assessment
Table A2: Comparison of IPCC and DRR terminologies on vulnerability assessmentFigures
Figure ES1: 17 out of 20 people in India are vulnerable to extreme hydro-met disasters
Figure ES2: 27 of 35 states and UTs are highly vulnerable to extreme hydro-met disasters
Figure 1: 75 per cent of Indian districts are extreme event hotspots
Figure 2: Illustration of the IPCC SREX framework for components risk and vulnerability
Figure 3: Integrated vulnerability assessment framework
Figure 4: Hazard-specific vulnerability assessment
Figure 5: Detailed schematic representation of the approach and methodology (IVA)
Figure 6: Snapshot of CEEW consultation workshops
Figure 7: Approach and methodology for exposure assessment
Figure 8: Approach and methodology for mapping the sensitivity index
Figure 9: Gridded exposure spatial layer for drought sensitivity analysis
Figure 10: Correlation of landscape indicators with respect to hydro-met disasters
Figure 11: Adaptive capacity indicators considered in the study
Figure 12: Sub-indicators considered for evaluating DDMPs
Figure 13: The eastern and western coasts are highly exposed to all three hydro-met disasters
Figure 14: The north-eastern zone is only highly exposed to extreme flood events, but the central
and eastern zones are exposed to compounded flood events
Figure 15: The southern and central zones are most exposed to drought events
Figure 16: More than 70 per cent of hotspot districts are highly sensitive to extreme drought
events
Figure 17: The eastern zone has medium-range adaptive capacity compared to all other zones
Figure 18: Of the 35 states and UTs in India, 27 are extremely vulnerable to hydro-met disasters
Figure 19: Assam, Andhra Pradesh, and Maharashtra are the most vulnerable states in India
Figure 20: More than 80 per cent of Indian population is vulnerable to extreme hydro-met
disasters
Figure A1: Spatio-temporal analysis of landscape indicatorsMapping India’s Climate Vulnerability: A District Level Assessment Acronyms AHP Analytical hierarchy process AR-6 IPCC Sixth Assessment Report Prepared by the Intergovernmental Panel on Climate Change (IPCC) CRED Centre for Research on the Epidemiology of Disasters CGIAR Consultative Group on International Agricultural Research CR consistency ratio CRA Climate Risk Atlas CRI Climate Risk Index DDMA District Disaster Management Authority DDMP District Disaster Management Plan DEM Digital Elevation Model DM Disaster management DRI Disaster Risk Index DRR Disaster risk reduction DST Department of Science and Technology ECMWF European Centre for Medium-range Weather Forecasting EM-DAT Emergency Events Database ENSO El Niño Southern Oscillations EPSEAR Emergency preparedness in South-East Asian region ES Executive summary ETM Enhanced Thematic Mapper Plus FAO Food and Agriculture Organization GAR Global Assessment Report on Disaster Risk Reduction GDAL Geospatial Data Abstraction Library GDP Gross domestic product GDDP Gross district domestic product GGCA Global Gender and Climate Alliance GIS Geographical Information System GrADS Grid Analysis and Display System IGBP International Geosphere-Biosphere Programme IHCAP Indian Himalayas Climate Adaptation Programme IISD International Institute for Sustainable Development
IMD         India Meteorological Department

IPCC        Intergovernmental Panel on Climate Change

IRS         Indian remote-sensing satellites

IVA         Integrated vulnerability assessment framework

LULC        land use and land cover

MCDM        multi-criteria decision modelling

MEMP        Municipal Emergency Management Plan

ML          machine-learning

NDMA        National Disaster Management Authority

NGN         next-generation network

NOAA        National Oceanic Atmospheric Administration

NRSC        National Remote Sensing Centre, Indian Space Research Organisation

PCA         principal component analysis

PIB         Press Information Bureau

OECD        Organisation for Economic Co-operation and Development

RDM         Robust Decision Making

SFDRR       Sendai Framework for Disaster Risk Reduction

SREX1-IPCC Special Report on Managing the Risks of Extreme Events and Disasters to Advance Climate Change Adaptation,
           Prepared by the Intergovernmental Panel on Climate Change (IPCC)

SRTM        Shuttle Radar Topography Mission

TM          thematic mapper

TNSAPCC     Tamil Nadu State Action Plan on Climate Change

UNDP        United Nations Development Programme

UNDRR       United Nations Office for Disaster Risk Reduction

USGS        United States Geological Survey

WGI         Working Group Information

WHO         World Health Organization

WMO         World Meteorological Organization

WRIS        Water Resources Information System
Mapping India’s Climate Vulnerability: A District Level Assessment The International Labour Organisation (ILO) projects that inaction in the face of slow-onset events like heat waves will cost India 34 million jobs by 2030. Image: iStock
i

Executive summary

O    ur worst fears have been confirmed. Human-induced climate change is already
     causing severe weather events across the world, impacting the lives and livelihoods of
millions. The first tranche of the Intergovernmental Panel on Climate Change’s (IPCC) Sixth
Assessment Report is a grim reminder of the make-or-break choices that we need to make in a
1.5°C-breaching climate.

The IPCC report reiterates the dire consequences of this human-induced breach for the Indian
subcontinent: increased dry spells, intensification of extreme rainfall by more than 20 per         A Climate Vulnerability
cent, and an exponential surge in heatwaves and cyclonic events.                                    Index (CVI) will
                                                                                                    help map critical
As global warming reaches a tipping point, India’s growth is linked intricately with climate
risks. Such risks have a disproportionate impact on vulnerable communities with low
                                                                                                    vulnerabilities; plan
adaptive capacities and pose a critical threat to India’s sustainable development. Investments      strategies to enhance
in infrastructure such as housing, transport, and industries will be threatened, especially         resilience, and adapt
along the coasts. Further, with mounting weather-related insurance losses, climate change           by climate-proofing
could trigger the next financial crisis.                                                            communities, economies
                                                                                                    and infrastructure
This study undertakes a first-of-its-kind district-level vulnerability assessment of India, which
maps exposure, sensitivity, and adaptive capacity using spatio-temporal analysis. To do
this, we developed a climate vulnerability index (CVI) of Indian states and union territories
(UTs). A CVI will help Map critical vulnerabilities; Plan strategies to enhance resilience, and
Adapt by climate-proofing communities, economies and infrastructure. Instead of looking
at climate extremes in isolation, we map the combined risk of hydro-met disasters and their
compounded impacts on vulnerability. By doing so, we aim to inform policy goals in the
resource-constrained context of India.

Why does India need a climate vulnerability index?
India is the seventh-most vulnerable country with respect to climate extremes (Germanwatch
2020). Climate action needs to be scaled up both at the sub-national and district levels to
mitigate the impact of extreme events. An analysis by the Council on Energy, Environment
and Water (CEEW) suggests that three out of four districts in India are extreme event hotspots,
with 40 per cent of the districts exhibiting a swapping trend, i.e., traditionally flood-prone
areas are witnessing more frequent and intense droughts and vice-versa (Mohanty 2020).
Further, the IPCC states with high confidence that every degree rise in temperature will lead
to a three per cent increase in precipitation, causing increased intensification of cyclones and
floods.
ii Mapping India’s Climate Vulnerability: A District Level Assessment
This is especially concerning since global, regional, national, and subnational climate actions
are geared towards limiting the rise in Earth’s temperature to 2°C above pre-industrial levels.
However, storms are already intensifying into cyclones, droughts are affecting more than half
of the country, and floods of unprecedented scale are causing catastrophic loss and damage
(Mohanty 2020). These trends are the result of a mere 0.6–0.7°C rise in temperature in the last
100 years (IMD 2019). Thus, there is a pressing need to consider the consequences of a 2°C
target.
Various studies by the Food and Agriculture Organization of the United Nations (FAO), the India is estimated to
United Nations Office for Disaster Risk Reduction (UNDRR), the United Nations Development have suffered losses of
Programme (UNDP), and the Department of Science & Technology (DST) have highlighted almost USD 80 billion
the importance of robust micro-level vulnerability assessments. Given the absence of such
due to extreme climate
an assessment in India, this study undertakes an integrated mapping of exposure (the
nature and degree to which a system is exposed), sensitivity (the degree to which a system
events in the last two
is affected), and adaptive capacity (the ability of a system to adjust to climate change) using decades
spatio-temporal analysis. Equation ES1 enumerates the vulnerability function.
Managing climate risks requires an enhanced understanding of the underlying drivers
of hazards; the exposure of regions and populations; the sensitivity of regions and their
resulting vulnerability; and the interactions between these components, as highlighted by
the IPCC. While exposure to extreme events is linear, the impacts are non-linear, depending
on the sensitivity and adaptive capacity of the affected systems. For some, it may entail
adjustments and re-adjustments in livelihood options, but, for others, the impacts can be
catastrophic, compounding beyond existing vulnerability thresholds. Thus, identifying the
compounding impacts of risk and mapping the vulnerability of geographies and communities
is a national imperative.
Equation ES1 Vulnerability function
Exposure (E) x Sensitivity (S)
Vulnerability (f) =
Adaptive Capacity (AC)
V E S AC
Developing a climate vulnerability index (CVI) for India
This study is a first-of-its-kind micro-level vulnerability assessment that maps the climate
vulnerability of districts in India. To assess vulnerability, we designed a composite CVI for
Indian states and UTs that considers exposure, sensitivity, and adaptive capacity. The study
evaluates exposure at the micro-level, assessing sensitivity through spatio-temporal analysis
and analysing adaptive capacity by evaluating socio-economic and governance mechanisms.
The framework we developed is based on IPCC’s SREX framework, which was also used by
DST to map vulnerability to climate change.
As the CVI integrates spatial, temporal, and location-specific indicators, it enables the
mapping of critical communities, sectors, and assets. It is unique in that it computes the
vulnerability score of each district by taking into consideration all three components of the
vulnerability function: exposure, sensitivity, and adaptive capacity. Further, it explores the
differential importance of each vulnerability indicator in determining the total vulnerabilityExecutive summary iii
score using composite vulnerability indexing exclusively for hydro-met disasters. Table ES1
enumerates the state-wise vulnerability indexing of Indian states.
The spatial index–based assessment will help mainstream climate actions through a robust
decision-making (RDM)1 approach (Lambert, Sharma, & Ryckman 2019). Further, such a
composite assessment can help determine policy goals and reprioritise climate adaptation
actions in a resource-constrained country like India.
The assessment maps the frequency and intensity of exposure of Indian districts to hydro-met
extremes and associated events. Further, these data are integrated with a spatial mapping
of the sensitivity of landscape indicators (land-use-land-cover, soil moisture, groundwater,
slope, and elevation) to climate extremes. We also assess adaptive capacity by considering a
wide set of socio-economic indicators such as population density, GDDP, literacy ratio, sex
ratio, availability and accessibility of critical infrastructures, availability and accessibility
of shelters, and robustness of district disaster management plans (DDMPs). Extreme event
indicators were shortlisted through stakeholder consultations to capture the on-ground
consensus regarding the drivers of vulnerability at a micro-scale.
In line with the IPCC’s SREX framework and the DST common vulnerability assessment
approach (DST 2020; IPCC 2014), we propose that climate extremes should not be seen as
primary events; instead, the combined risk of associated events should be mapped. Thus, we
capture the combined risk of hydro-met disasters and their compounded impact on districts’
climate vulnerability.
State Overall Vulnerability Index Score Rank Table ES1
Assam 0.616 1
Assam, Andhra
Pradesh, and
Andhra Pradesh 0.483 2
Maharashtra are the
Maharashtra 0.478 3 top three climate
Karnataka 0.465 4 vulnerable states in
India
Bihar 0.448 5
Manipur 0.424 6 Source: Authors’ analysis
Rajasthan 0.423 7
Arunachal Pradesh 0.408 8
Sikkim 0.370 9
Odisha 0.368 10
Nagaland 0.365 11
Tamil Nadu 0.339 12
Himachal Pradesh 0.329 13
Jammu & Kashmir 0.328 14
NCT Delhi 0.290 15
Gujarat 0.280 16
Uttar Pradesh 0.269 17
West Bengal 0.257 18
Tripura 0.250 19
Kerala 0.226 20
1. The RDM approach applies spatial and temporal tools to contextualise accepted concepts, processes, and tools to
yield empirical evidence-based decisions.iv Mapping India’s Climate Vulnerability: A District Level Assessment
We find that the pattern of extreme events is changing across regions and that more than
40 per cent of Indian districts exhibit a swapping trend. Tackling these complex, varying
patterns requires concerted risk mitigation strategies at the sub-national level. Our analysis
suggests that the CVIs of Assam, Andhra Pradesh, Maharashtra, Karnataka, and Bihar are in
the high range, making them the five most vulnerable states in India (Table ES1). However,
there are marginal differences in the vulnerability of these states, so it is imperative to step up
climate action in all of them. The CVI also helps map the vulnerability of populations residing
in Indian districts. We find that more than 80 percent of India’s population lives in districts
highly vulnerable to extreme hydro-met disasters (Figure ES1).
5 out of 20 Indians are highly Figure ES1
vulnerable to all three extreme events 17 out of 20 people in
India are vulnerable
to extreme hydro-
met disasters
Source: Authors’ analysis
Source for icons: Weepeople
Mapping India’s vulnerability: key findings
As per our analysis, 27 of 35 states and UTs are highly vulnerable to extreme hydro-met
disasters2 and their compounded impacts (Figure ES2). Our analysis suggests that India’s
western and central zones are more vulnerable to drought-like conditions and their
compounding impacts. The northern and north-eastern zones are more vulnerable to extreme
flood events and their compounding impacts. Meanwhile, India’s eastern and southern zones
are highly vulnerable to extreme cyclonic events and their impacts. The eastern and southern
zones are also becoming extremely prone to cyclones, floods, and droughts combined.
2. Hydrological and meteorological (or “hydro-met”) hazards – weather, water, and climate extremes (GFDRR 2018).Executive summary v
Figure ES2 27 of 35 Indian states and UTs are highly vulnerable to extreme hydro-met disasters
Vulnerability Index
Very
Low Low Moderate High Very High
Flood
Drought
Cyclone
Flood & Drought
Flood & Cyclone
Drought & Cyclone
Flood, Drought & Cyclone
0.01 0.20 0.40 0.60 1.00
Less Vulnerable More Vulnerable
Source: Authors’ analysis
We find that the southern and western regions are the most vulnerable to extreme droughts
and are affected year on year. These regions are predominantly affected by agricultural
droughts. Since the 2000s, the northern, eastern, and central zones have been moderately
vulnerable and are predominantly affected by meteorological and agricultural droughts. The
north-eastern region is least vulnerable to extreme drought events.
Our composite indexing suggests that more than 59 per cent of districts located in the eastern
zone are highly vulnerable to extreme cyclone events. In the western zone, more than 41 per
cent of districts are cyclone hotspots. Our analysis shows that the western coast has become Only 63% of districts
increasingly vulnerable to cyclones in the last decade (2010–2019). India’s northern and have a DDMP, out of
north-eastern zones face very few extreme cyclone events and are therefore less vulnerable. which only 32% were
The central zone is the only zone in India with no hotspots for extreme cyclone events.
updated until 2019
Increased drought-like conditions across India trigger the cyclogenesis process by which
depressions turn into deep depressions, and deep depressions into cyclonic storms across
the rapidly warming Indian Ocean. Since these cyclones are accompanied by floods, several
districts across the eastern and western coasts are vulnerable to all three extremes. This
makes mitigation and adaptation in these regions a daunting task. Table ES2 enumerates
zone-wise vulnerability to extreme hydro-met disasters.vi Mapping India’s Climate Vulnerability: A District Level Assessment
Extreme
Table ES2
event
Southern-zone is the
Zone Flood Drought Cyclone
most vulnerable to all
Northern High Medium Low three extreme hydro-
Southern High High High met disasters
Eastern High Medium High Source: Authors’ analysis
North – Eastern Medium Low Low
Western Medium High Medium
Central Low Medium Low
High: (0.41-1) Medium: (0.21-0.40) Low: (0.00-0.20)
A surge in extreme events has been observed across India after 2005. Our sensitivity
analysis shows that this is primarily triggered by landscape disruptions. Various studies
have confirmed the impact of landscape changes on the incidence of extreme events (UNEP
2009). Other factors, such as the urban heat island effect, land subsidence, and microclimate
changes, are also triggering the intensification of extreme events in India. Table ES3 shows
how individual regions are affected by each component of vulnerability.
Table ES3 North-eastern and eastern zones of India are highly exposed to extreme flood events
Component Exposure Sensitivity Adaptive capacity3
of
vulnerability (People, livelihood, assets, etc. that (The degree to which a system is (The ability of a system to adjust
could be adversely affected) affected) to climate change or to cope
with the consequences)
Zone
Northern Medium Low Low High Medium Medium Low
Southern Medium High High High High High Low
Eastern High Medium High High Low High Medium
North – Eastern High Low Low Medium Low Low Low
Western Low Low Medium Medium High High Low
Central Medium High None Low Medium Low Low
High: (0.41-1) Medium: (0.21-0.40) Low: (0.00-0.20)
Source: Authors’ analysis
Building India’s climate resilience
In an increasingly volatile climate landscape, hyper-local strategies can minimise impacts
and avert or reduce loss and damage. The CVI intends to evaluate the vulnerability of Indian
districts in a comparable unified matrix and identify the major landscape and socio-economic
drivers of vulnerability. This will enable communities to map, plan and adapt against the
climate extremes.
3. Adaptive capacity is calculated for combined hydro-met disasters.Executive summary vii With less than a decade left to step up climate actions, our policies need a razor-sharp focus to curtail the compounded impacts of climate extremes. Principles of risk assessment should be at the core of India’s climate risk mitigation strategy. Identifying risk is the first and foremost step to building climate-proofed economies and societies that embrace climate- resilient pathways. Based on our analysis, we make the following recommendations: 1. Develop a high-resolution Climate Risk Atlas (CRA) to map critical vulnerabilities at the district level and better identify, assess, and project chronic and acute risks such as extreme climate events, heat and water stress, crop loss, vector-borne diseases and biodiversity collapse. A CRA can also support coastal monitoring and forecasting, which India is leading global are indispensable given the rapid intensification of cyclones and other extreme events. efforts on disaster risk 2. Establish a centralised climate-risk commission to coordinate the environmental de- reduction (DRR). It is a risking mission (Ghosh 2021). signatory to the SFDRR 3. Undertake climate-sensitivity-led landscape restoration focused on rehabilitating, and is also a permanent restoring, and reintegrating natural ecosystems as part of the developmental process. chair of the CDRI 4. Integrate climate risk profiling with infrastructure planning to increase adaptive capacity. 5. Provide for climate risk-interlinked adaptation financing by creating innovative CVI-based financing instruments that integrate climate risks for an effective risk transfer mechanism. India urgently needs national and sub-national strategies to climate-proof its population and economic growth. If a 1.5°C warmer future climate is inevitable, we must brace for its impacts and ensure that we have the means to build back better and faster when disaster strikes. If we fail, we could set our development story back by decades.
52
6    Mapping India’s Climate Vulnerability: A District Level Assessment

     ActionAid estimates that impact of climate
     change will force more than 45 million
     people in India to migrate by 2050.

     Image: iStock
1
1. Understanding the vulnerability landscape
of India in a changing climate scenario
C limate action needs to be scaled up at both the sub-national and district levels in India to
mitigate the impact of extreme events on the lives and livelihoods of millions. Further, the
threat of increased glacial melting looms large across the Hindu-Kush Himalayan region and
will have serious repercussions on communities, economies and infrastructure. The extent
of loss and damage from extreme climate events has risen exponentially in recent decades;
it is imperative to perform a comprehensive vulnerability assessment of Indian districts to
understand their exposure, sensitivity, and vulnerability to hydro-met disasters. Managing
climate risks requires an understanding of the drivers of hazards; exposure, sensitivity, and
vulnerability; and the interactions between these components, as highlighted by the IPCC.
This can be done by explicitly or implicitly analysing the components of risks across different
geographies.
In brief
In 2020, the Department of Science and Technology (DST), Government of India, published a study ranking Indian
states according to their vulnerability to climate risks. The study highlighted the need for a national-level climate
vulnerability assessment with a particular focus on hydro-met disasters. To address this gap, this study attempts
a first-of-its-kind micro-level vulnerability assessment based on composite indexing. We use a composite index–
based methodology to first map the exposure of Indian districts to extreme events and their associated events
and then map the sensitivity of landscape indicators through spatial indexing, which identifies the drivers of
extreme events. Extreme event stressors were shortlisted through a wide set of stakeholder consultations to
capture the on-ground consensus. The following definitions and terminologies are considered as per the IPCC’s
AR (6) categorisation:
1. Exposure is “the presence of people, livelihoods, species or ecosystems, environmental functions, services,
resources, infrastructure, or economic, social, or cultural assets in places and settings that could be adversely
affected” (IPCC 2014).
2. Sensitivity is “the degree to which a system is affected, either adversely or beneficially, by climate-related
stimuli. The effect may be direct (e.g., a change in crop yield in response to a change in the mean, range, or
variability of temperature) or indirect (e.g., damages caused by an increase in the frequency of coastal flooding
due to sea-level rise)” (IPCC 2001).
3. Adaptive capacity is “the ability of a system to adjust to climate change (including climate variability
and extremes), to moderate potential damages, to take advantage of opportunities, or to cope with the
consequences” (IPCC 2001).
The IPCC acknowledges these three components as key elements of vulnerability. Thus, a comprehensive
vulnerability assessment should consolidate the available temporal and spatial information about a particular
region (district), data confidence levels, knowledge gaps, and allied information. Further, it should combine the
specific elements of exposure, sensitivity, and adaptive capacity to enable more risk-informed decision-making.2 Mapping India’s Climate Vulnerability: A District Level Assessment
1.1 Identifying the climate risk landscape through a
vulnerability assessment
Climate change is poised to breach established thresholds on an unprecedented scale. It is
a lived reality for many, given the accelerating frequency and intensity with which extreme
events ravage lives and livelihoods. It has also altered the spatial extent, interval, and pattern
of weather and climate events (Zhai et al. 2018).
India is a tropical country with frequent cyclonic disturbances and monsoon-related extremes The frequency and
(IMD 2015). More than 300 extreme events have hit the country in recent decades, causing intensity of extreme
losses of more than INR 5,600 billion (5.6 lakh crore; Mohanty 2020). Though exposure to events in India have
extreme events is linear, the impacts are non-linear and depend on a region’s sensitivity
increased by almost
and adaptive capacity. For some, it may entail adjustments and re-adjustments of livelihood
options, but for others, the impacts can be catastrophic, compounding beyond existing 200% since 2005
vulnerability thresholds.
In the coming decades, climate change is likely to make rainfall erratic, cause sea level rise,
and accelerate the frequency and intensity of droughts, floods, and heatwaves (IPCC 2018).
CEEW estimates that over 75 per cent of Indian districts, including 95 per cent of coastal
districts, are extreme event hotspots (Figure 1). Given the circumstances, a comprehensive
vulnerability assessment of Indian districts is needed to identify the combined risks of hydro-
met disasters and their compounding impacts. The Global Risk Perception Survey (GRPS)
identifies climate-related issues as one of the major concerns that can disrupt economic
growth (WEF 2020). As the climate risk landscape evolves, our micro-level vulnerability
assessment will provide critical information on geographical susceptibility to hydro-met
disasters in diverse spatial and environmental settings.
The composite index–based vulnerability assessment method is quite robust, and different
organisations have recommended it (OECD 2008; DST 2020; IPCC 2014). However, the IPCC’s
Third Assessment Report has acknowledged the evolution of vulnerability assessments for
identifying and mapping climate impacts. The scope of such assessments has broadened
considerably given the non-linearity, complexity, and compounding impacts of climate
extremes. Additionally, the recalibration of the vulnerability function was acknowledged in
the Fifth Assessment Report (IPCC 2014). Box 1.1 illustrates the chronology of the vulnerability
assessment frameworks. Integrated vulnerability frameworks have often been criticised
for using the outcome as an indicator for the analysis (Brien et al. 2007). Thus, to maintain
consistency in the approach, we followed the IPCC’s SREX framework (Figure 2) and adhered
to the Department of Science and Technology’s (DST; Government of India) common
vulnerability assessment approach while developing the vulnerability indexing of Indian
districts to hydro-met disasters (DST 2020; IPCC 2014).Understanding the vulnerability landscape of India in a changing climate scenario 3
Figure 1
More than 95 per
cent of coastal Indian
districts are extreme
event hotspots
Source: Mohanty 2020
Cyclone Drought Flood Cyclone and Flood and Flood and
drought cyclone drought
Figure 2 Illustration of the IPCC SREX framework for components risk and vulnerability
Impacts
Vulnerability
Climate Socio-economic processes
Natural variability Socio-economic pathways
Anthropogenic climate
Risk Adaptation & mitigation
change activities
Hazard Exposure Governance
Emission & land use change
Source: IPCC 20144 Mapping India’s Climate Vulnerability: A District Level Assessment
BOX 1.1 Evolving definitions of vulnerability
‘Vulnerability’ is the extent to which
climate change may damage or harm a
system; it is a function of both sensitivity 1998
to climate and the ability to adapt to new
conditions.
(IPCC: Special Assessment Report 1998)
• Vulnerability is the degree to which a
system is susceptible to, or unable to cope
with, adverse effects of climate change,
including climate variability and extremes.
2001
• Vulnerability is a function of the character,
magnitude, and rate of climate change and
• Vulnerability is the degree to which a the variation to which a system is exposed,
system is susceptible to, and unable its sensitivity, and its adaptive capacity.
to cope with, the adverse effects of (IPCC: Third Assessment Report 2001)
climate change, including climate
variability and extremes.
• Vulnerability is a function of the 2004
character, magnitude, and rate of
climate change and variation to
which a system is exposed, the
sensitivity and adaptive capacity of
that system.
(IPCC: Fourth Assessment Report 2007) Vulnerability: The propensity or predisposition
2012 to be adversely affected.
(Special report of the IPCC 2012)
• Vulnerability: The propensity or
predisposition to be adversely
affected.
• Vulnerability encompasses a variety
of concepts and elements including 2014
sensitivity or susceptibility to harm
and lack of capacity to cope and
adapt.
(IPCC: Fifth Assessment Report 2014)
The Pan American Health Organization coined the term ‘vulnerability’ in the early 1980s (WHO). The
Intergovernmental Panel on Climate Change (IPCC) first introduced the term in a Special Assessment Report (SAR)
titled The Regional Impacts of Climate Change: An Assessment of Vulnerability, March 1998. The special report
on vulnerability assessment provided critical information on the potential impacts of climate change for various
sources, including ecological systems, coastal infrastructure, water supply, food production, and human health. The
report acknowledged the extent to which natural ecosystems globally are vulnerable to climate change and form a
key concern for governments worldwide.
The Third Assessment Report (TAR) by the IPCC, published in 2001, built upon the SAR. For the first time it
described vulnerability as a function of exposure, sensitivity, and adaptive capacity. The report also stated that the
vulnerability of a system varies spatially and temporally (IPCC 2001).
The Fifth Assessment Report (AR5) released by the IPCC in 2014 illustrated the core concepts related to risk
assessment. According to the report, risk results from the interaction of climate-related hazards with the
vulnerability and exposure of human and natural systems (IPCC 2014).Understanding the vulnerability landscape of India in a changing climate scenario 5
BOX 1.2 Types of vulnerability assessment frameworks
Hazard
Physical or biophysical Exposure
vulnerability assessment
Sensitivity
Social or inherent “Generic” determinants or
vulnerability assessment factors of social vulnerability
Types of vulnerability Socio-economic
Institutional vulnerabilities
assessments vulnerability assessment
Frequency
Hazard-specific
vulnerability assessment Intensity
Scale
Biophysical
Integrated vulnerability
assessment
Socio-economic/
institutional
1. Physical or biophysical vulnerability assessment: “Biophysical vulnerability is concerned with the ultimate
impacts of a hazard event, and is often viewed in terms of the amount of damage experienced by a system as a
result of an encounter with a hazard” ( Jones and Boer 2003).
2. Social vulnerability assessment: “Social vulnerability refers to the characteristics of a person or group in terms
of their capacity to anticipate, cope with, resist and recover from the impact of a natural hazard” (Wisner et al.
2004).
3. Socio-economic vulnerability assessment: “Socio-economic vulnerability is the endogenous inability of the unit
to face shocks. This endogenous inability is a function of risk exposure and other socio-economic factors” (FAO
2003).
4. Hazard-specific vulnerability: “A hazard vulnerability assessment (HVA) is a systematic approach to identify all
possible hazards that may affect a specific population, assess the risk associated with each hazard (e.g., the
probability of hazard occurrence and the consequences for the population), and study the findings to develop a
prioritized comparison of hazard vulnerabilities” (Du et al. 2015).
5. Integrated vulnerability assessment: Integrated vulnerability assessment is based on biophysical, socio-
economic, institutional, and infrastructure-related vulnerability indicators (DST 2020).6 Mapping India’s Climate Vulnerability: A District Level Assessment
1.2 Integrated vulnerability assessment
As illustrated in Box 1.2, integrated vulnerability assessment (IVA) combines biophysical and
socio-economic/institutional vulnerabilities. We performed an IVA to identify geographical
vulnerabilities to hydro-met disasters at the district level. For more on the scope of the method,
the selection of the vulnerability assessment framework, and the spatial extent of the indicators,
please see Chapter 2.
As confirmed by the IPCC, IVA is one of the most widely accepted frameworks for conducting
hazard-specific vulnerability assessments since it robustly captures anthropocentric stressors
(Sharma 2019). Beyond the IPCC, different regions across the globe have used IVA to map,
capture, and detail micro-level vulnerability as part of their national adaptation policies (IISD
2019). Pacific nations have acknowledged IVA as a key methodology for standardising hazard-
specific vulnerability assessments based on the IPCC’s revamped vulnerability framework. Figure
3 enumerates the salient components of the IVA framework.
The main advantage of IVA is that it addresses two key needs for risk-informed adaptation
planning: i) establishing a common point of reference through a baseline analysis that
incorporates hazard-specific information and ii) creating a base for monitoring and evaluating
adaptation outcomes. Further, it institutionalises an inclusive approach to resilient development
by placing climate-related interventions in an evolving risk landscape concurrent with national,
sub-national, and developmental priorities. It integrates both disaster risk reduction (DRR) and
climate-change-linked vulnerability assessments (Gero 2011).
Figure 3 Salient components of Integrated vulnerability assessment framework
Capacity & Sensitivity of Adaptive & Risk Reduction
General context Livelihood Assets Capacity of Institutions
Exposure status quo Assets a social unit has to adapt What a social unit does to adapt and
reduce risk and how
• Physical geography • Natural assets
• Institutional/ governmental
• Demographic trends • Physical assets
structure
• Development trends • Financial assets
• Adaptive and risk reduction
• Climate threats/hazards • Human asset capacities of institutions
(Governance Process)
Resilient development outcome Resilient development strategy
Guides investment to adaptation measures Guides investment to adaptation
measures
• Access to safe housing
• Good governance
• Access to adequate and health foods
• Knowledge management
• Access to adequate household income
• Sustainable resource management
• Decreased loss of life, injury and property from disaster and other hazards
• Water and food security
• Improved health knowledge and skills
• Disaster preparedness and management
Enhanced adaptive and risk reduction capacities of institutions
• Health education
• Increased participation by women and youth in decision making
• Development of resilient development plans
• Implementation of resilient development plans
• Monitoring and learning from resilient development planning and
implementation
• Increased collective action by local communities in resilient development
projects.
Source: GIZ & SPC (2016)Understanding the vulnerability landscape of India in a changing climate scenario 7
The IPCC’s Fifth Assessment Report defines vulnerability as the “propensity or predisposition
to be adversely affected, which includes ‘sensitivity or susceptibility to harm and lack
of capacity to cope and adapt” (IPCC 2007). The United Nations International Strategy
for Disaster Risk Reduction (UNISDR) specifies vulnerability as “characteristics and
circumstances of a community, system, or asset that make it susceptible to the damaging
effects of a hazard” (UNISDR 2011). Annexure-I (Table A2) illustrates the conceptual
framework of vulnerability as defined by the IPCC and UNISDR.
The IPCC acknowledges
The IVA framework provides broad information and inferences that can enhance countries’ that data on disasters
adaptive capacity and enable them to build back better against climate shocks. They also
and DRR is lacking at
integrate climate adaptation practices with disaster risk reduction (DRR) strategies, which
can have multi-faceted benefits including the mitigation of climate-related losses and the the local level,
enhancement of resource-use efficiency (Shamsuddoha et al. 2013a). Further, resilience constraining the
pathways identified through IVA frameworks can be integrated with developmental planning, enhancement of
policy monitoring, and evaluation. community resilience
1.3 Research questions
Sectoral and national-level assessments have been attempted in India to develop a robust
vulnerability index at various spatial scales and extents. However, to our knowledge, there
have been no micro-level vulnerability assessments with respect to hydro-met disasters.
The previous sections provide an overview of the conceptual framework of the vulnerability
assessment and why developing a robust vulnerability assessment framework is of utmost
importance for tackling climate change.
In this study, we use an integrated vulnerability assessment framework to derive, at a
micro-level, a vulnerability indexing of Indian districts with respect to their exposure to
hydro-met disasters and associated events. India does not have a hydro-met-disaster-focused
vulnerability assessment to enhance climate actions at a sub-national level. This study
attempts to bridge this gap by answering the following research questions.
How vulnerable are Indian districts to the non-linear patterns and
frequency of climate extremes?
Robust micro-level vulnerability assessments are intrinsic to risk-informed decisions.
India ranks seventh globally in terms of vulnerability to extreme events, making a robust
vulnerability assessment of its districts the need of the hour. The DST has highlighted the
importance of developing a common framework for vulnerability for building long-term
resilience. Based on the common vulnerability framework proposed by the DST (2020),
IPCC (2014), O’Brien (2007), and Kelly and Adger (2000), we used an endpoint/outcome
approach by drawing upon a pentad decadal multi-hazard assessment inclusive of associated
extreme events. While various states have developed vulnerability profiles, there has been
no unified common approach, making the comparison of vulnerable districts in terms of
varying patterns and frequency of climate extremes impossible. For example, two vulnerable
districts exposed to cyclones might have different sensitivities and adaptive capacities to
avert the extent of loss and damage. A unified common approach can help governments step
up climate actions at the sub-national level by strengthening state action plans on climate
change (SAPCCs) and localised district plans. Comparable unified indexing can also aid the
mapping of the climate extremes landscape and hence support risk-informed decisions to
climate-proof vulnerable regions.You can also read