Mach: A Pluggable Metrics Storage Engine for the Age of Observability
←
→
Page content transcription
If your browser does not render page correctly, please read the page content below
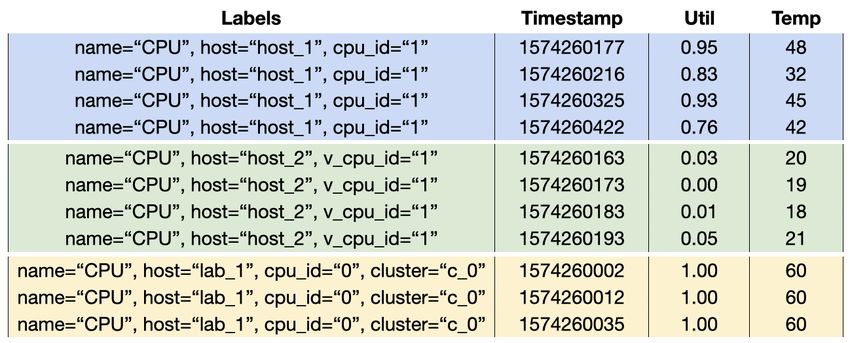
Mach: A Pluggable Metrics Storage Engine
 for the Age of Observability
 Franco Solleza1 , Andrew Crotty1,2 , Suman Karumuri3 , Nesime Tatbul4,5 , Stan Zdonik1
 1 Brown
 University, 2 CMU, 3 Slack Technologies, 4 Intel Labs, 5 MIT
 fsolleza@cs.brown.edu,andrewcr@cs.cmu.edu,skarumuri@slack-corp.com,tatbul@csail.mit.edu,sbz@cs.brown.edu

ABSTRACT
Observability is gaining traction as a key capability for under-
standing the internal behavior of large-scale system deployments.
Instrumenting these systems to report quantitative telemetry data
called metrics enables engineers to monitor and maintain services
that operate at an enormous scale so they can respond rapidly to
any issues that might arise. To be useful, metrics must be ingested,
stored, and queryable in real time, but many existing solutions
cannot keep up with the sheer volume of generated data.
 This paper describes Mach, a pluggable storage engine we are Figure 1: Metrics from a server monitoring use case.
building specifically to handle high-volume metrics data. Similar
to many popular libraries (e.g., Berkeley DB, LevelDB, RocksDB,
WiredTiger), Mach provides a simple API to store and retrieve have three distinct parts: (1) the set of labels or tags identifying the
data. Mach’s lean, loosely coordinated architecture aggressively sample’s source; (2) a timestamp denoting when the source gen-
leverages the characteristics of metrics data and observability work- erated the sample; and (3) one or more numeric values capturing
loads, yielding an order-of-magnitude improvement over existing quantitative measurements from the source, such as CPU utilization
approaches—especially those marketed as “time series database and temperature.
systems” (TSDBs). In fact, our preliminary results show that Mach Real-world use cases can produce huge volumes of metrics data
can achieve nearly 10× higher write throughput and 3× higher read from millions or billions of distinct sources. For example, Slack
throughput compared to several widely used alternatives. collects metrics from 4 billion unique sources per day at a rate of 12
 million samples per second, generating up to 12 TB of compressed
1 INTRODUCTION data every day [20]. Unfortunately, many off-the-shelf systems
On the afternoon of May 12, 2020, at 4:45pm PST, the cloud-based cannot scale to support these workloads, leading to a patchwork of
business communication platform Slack experienced a total service brittle, custom-built solutions [20, 21].
disruption [22]. For millions of users, this outage lasted for only To address these shortcomings, we are building a pluggable
48 minutes, but the cascade of events that led to the outage actu- storage engine called Mach that specifically targets observability
ally began roughly eight hours earlier. The incident prompted an use cases. Mach provides a simple API for users to store and retrieve
“all hands on deck” response, with engineers from multiple teams their data, similar to other popular libraries (e.g., Berkeley DB [24],
poring over petabytes of operational data available from Slack’s LevelDB [6], RocksDB [9], WiredTiger [14]). However, unlike these
internal monitoring infrastructure. Through swift action, they were storage engines, Mach has a lean, loosely coordinated architecture
able to fully restore service by 5:33pm PST, but diagnosing and cor- that is specialized for the unique characteristics of metrics data
recting the root cause of the outage under immense time pressure and observability workloads. These design decisions allow Mach
was not an easy task. to outperform several widely used alternatives, with nearly 10×
 This incident is a prime example of the growing importance higher write throughput and 3× higher read throughput.
of observability in large-scale system deployments. Observability
enables better understanding of the internal behavior of complex 2 BACKGROUND
systems in real time by collecting different types of telemetry data, In this section, we discuss the common characteristics of observ-
in particular quantitative measurements known as metrics. Metrics ability workloads, unique aspects of the metrics data model, and
are used in a variety of ways, including to populate dashboards, shortcomings of existing approaches.
generate alerts, and answer ad hoc analytical queries.
 Figure 1 shows a subset of a metrics dataset from a server moni- 2.1 Workload Characteristics
toring use case. Each row in the figure represents a sample, with Metrics span two dimensions: (1) the time dimension, which con-
samples from the same source grouped together by color. Samples sists of individual samples from a data source that arrive over time;
This paper is published under the Creative Commons Attribution 4.0 International and (2) the space dimension, which consists of samples from many
(CC-BY 4.0) license. Authors reserve their rights to disseminate the work on their different data sources. Figure 2 visualizes the example server moni-
personal and corporate Web sites with the appropriate attribution, provided that you toring dataset in the time and space dimensions. Each dot represents
attribute the original work to the authors and CIDR 2022. 12th Annual Conference on
Innovative Data Systems Research (CIDR ’22). January 9-12, 2022, Chaminade, USA. an individual sample (i.e., a row from Figure 1), and each row of
 dots represents the samples from a single data source.
CIDR’22, January 9-12, 2022, Chaminade, USA Franco Solleza, Andrew Crotty, Suman Karumuri, Nesime Tatbul, Stan Zdonik

 2.3 Existing Approaches
 Embedded key-value stores (e.g., Berkeley DB [24], LevelDB [6],
 RocksDB [9], WiredTiger [14]) are widely used for persisting data
 in a variety of applications. However, these libraries are designed
 to be general-purpose, and this flexibility imposes certain limita-
 tions (e.g., write amplification, single-threaded writes) that limit
 their ingestion throughput. Other popular embedded DBMSs (e.g.,
 SQLite [10], DuckDB [27], TileDB [25]) suffer from similar limita-
 tions that make them impractical for high-volume data ingestion
 Figure 2: The time and space dimensions of metrics data.
 in an observability setting.
 Many storage engines specialized for time series data (e.g., Go-
 rilla [26]/Beringei [2], BTrDB [17], Timon [18], ByteSeries [28])
 Sources exhibit a variety of write patterns in the time dimension. focus primarily on in-memory processing, whereas Mach is heav-
Some sources produce samples at regular intervals (rows 1, 3), ily optimized for persistent storage. On the other hand, most full-
whereas others have bursty or random write patterns (row 5). The fledged TSDBs (e.g., InfluxDB [4], ClickHouse [3], TimescaleDB [12],
space dimension also exhibits churn: sources can become inactive VictoriaMetrics [13]) are geared toward analytical queries rather
(row 6), start up (rows 2, 4), or stop then restart (row 7). than ingestion performance. Although TSDBs often provide rea-
 The inclination for most systems is to consider scalability in the sonably fast bulk loading, they are generally not designed for the
time dimension, since large volumes of data can accumulate over huge volume of small writes in observability workloads.
time. However, even if each source emits samples at a relatively Prometheus [8] is the most widely adopted system for metrics
low frequency (e.g., once per second), having millions or billions data and targets the same use case as Mach. Prometheus optimizes
of active sources poses a scalability challenge in the space dimen- for ingest, as is evident in our preliminary results where it out-
sion. Metrics storage engines must therefore consider both of these performs InfluxDB and RocksDB. However, it does not support
dimensions in their design. multivariate data, incurring unnecessary overhead for many com-
 Read queries are typically biased toward freshness. Analytical mon workloads. As we discuss in Section 3.1, it also suffers from
queries that look far back in time (the blue box in Figure 2) are coordination overheads unacceptable for metrics workloads. Hera-
much less frequent than queries that look at recent data across many cles [29] redesigns the Prometheus storage engine, gaining much
sources (the green box in Figure 2). For example, 95% of queries in of its performance by operating largely in memory.
Slack’s monitoring infrastructure are for metrics data from the past Thanos [11], M3 [7], and Monarch [15] are distributed metrics
hour, and almost 98% of metrics queries are for metrics data less and monitoring systems. They focus primarily on the distributed co-
than 4 hours old. ordination layer and rely on a lower-level storage engine under the
 hood. For example, Thanos and M3 are designed to manage many
 distributed Prometheus instances running in a cloud environment.
2.2 Data Model
As mentioned, samples in a metrics dataset consist of three parts: 3 MACH
(1) the set of labels or tags identifying the source; (2) a timestamp;
and (3) one or more data values. Metrics with a single value are We are designing Mach as a pluggable storage engine that specifi-
referred to as univariate, whereas metrics comprised of multiple cally targets metrics data. In the following, we begin with a high-
values are called multivariate. level overview of Mach’s design and discuss what makes it different
 Unfortunately, existing data models fail to neatly capture the from existing approaches. Then, we discuss Mach’s API, followed
unique aspects of metrics data. For example, the relational model by the corresponding write and read paths.
cannot easily handle the variable number of labels and values. Stor-
ing each one individually would result in many sparsely populated 3.1 System Overview
attributes, whereas storing them together as a complex type in a An overview of Mach’s architecture appears in Figure 3. Users
single attribute would preclude common optimizations (e.g., colum- interact with Mach through a simple API (Section 3.2) to store and
nar compression). Another alternative is to create a new relation for retrieve samples. As stated, Mach is specialized for the observability
each data source. However, this approach does not scale beyond a setting, which requires a storage engine to efficiently handle both
limited number of sources, and certain types of queries become un- massive write volume (i.e., ingestion) and low-latency reads (i.e.,
wieldy (e.g., retrieve all sources with the label name="CPU"). More- querying) in real time.
over, all of these alternatives require online schema modifications On the write side (Section 3.3), sources emit samples, routing
every time a new type of label or value must be added. them through an intermediary (e.g., Kafka [5], Prometheus scrapers)
 Other popular data models incorporate key assumptions that or inserting them directly via a protocol like HTTP. New samples
make them similarly ill-suited for metrics data. For instance, nearly are appended to a buffer that, when full, is compressed and written
all algorithms based on the time series data model assume samples to persistent storage. Eventually, old or infrequently used segments
at evenly spaced points in time, but data sources in the observability may be migrated to an OLAP system (e.g., ClickHouse [3]) for
setting often produce samples at irregular intervals corresponding analysis or remote storage (e.g., Amazon S3 Glacier [1]) for long-
to real-world events (e.g., an application crashing). term archival.
Mach: A Pluggable Metrics Storage Engine for the Age of Observability CIDR’22, January 9-12, 2022, Chaminade, USA

 loosely coordinated design. Without needing to worry about con-
 current writers, appends incur no synchronization overhead. Fur-
 thermore, this list-like behavior allows Mach to execute reads with-
 out blocking writes via a low-overhead snapshotting mechanism
 described in Section 3.4.
 Thread-Level Elasticity: Workload burstiness is typically handled
 in the application layer by scaling up the number of running storage
 instances as demand increases. This approach adds unnecessary
 complexity that muddles the actual application logic and often
 results in poor resource utilization. In fact, systems like Thanos and
 M3 were built partly to handle this problem.
 The core issue is that individual instances of these systems can-
 not scale in response to bursty workloads, since adding more writer
 threads simply increases contention. Mach’s loose coordination
 Figure 3: Mach’s high-level system architecture. model completely avoids this problem because each thread behaves
 like an independent storage engine. This approach allows Mach
 to scale in response to workload changes by adding or reducing
 writer threads without increasing write contention.
 On the read side (Section 3.4), the system receives a variety of
 3.2 API
concurrent queries for tasks like populating dashboards, alerting,
and ad-hoc analytics. These queries can leverage label and time Similar to other popular storage engines, Mach has a simple API
indexes constructed during ingestion to pinpoint the data sources to store and retrieve data. Specifically, Mach supports two basic
and time ranges of interest. operators, push and get_range, as well as a register function for
 Existing storage engines used in observability workloads have specifying configuration parameters. The pseudocode in Figure 4
many working threads operating in a tightly coordinated fashion. illustrates how an application might use Mach.
Mach’s architecture, on the other hand, takes a fundamentally register(config) registers a new data source with Mach. The
different approach based on loose coordination. More specifically, configuration describes the samples (e.g., the number of values)
Mach threads behave independently, keep their own state, and and how Mach should handle them (e.g., the precision for the
have minimal coordination. We leverage this loosely coordinated compression scheme described in Section 3.3). register returns a
design in the following three key ways. 64-bit integer that uniquely identifies the source. Figure 4a shows
 how an observability application would initialize Mach.
Multiple Independent Active Segments: Most storage engines
 push(id, ts, values) pushes a sample from the source identified
allow multiple writers for the same data source, coordinating via a
 by id to Mach. ts is an unsigned 64-bit integer greater than the
mutex and checking to make sure that samples are in order. Con-
 previous timestamp pushed by this source, and values is an -tuple
sistent with other work [29], we find that mutex acquisition alone
 of floating-point values. Mach guarantees that a sample pushed
comprises roughly 25% of write overhead in Prometheus. Even with
 by a writer thread is immediately available for querying by any
multiple writers, these engines eventually write to a single object,
 calls to get_range that occur after the push completes. Mach also
and contention can occur at different levels.
 ensures that samples are durable by periodically calling fsync to
 In contrast, Mach uses multiple independent writer threads in
 flush them to persistent storage (see Section 3.3).
a loosely coordinated design. Each thread can write samples from
 The pseudocode for writing samples to Mach with push appears
multiple sources, but each source is assigned to a single writer
 in Figure 4b. The application first initializes a writer using the
thread. To avoid contention, threads maintain all necessary meta-
 writer_id obtained in Figure 4a and then pushes the samples from
data internally and rely on minimal shared state. In this way, Mach
 some input (e.g., a queue or scraper) to the writer.
behaves like multiple independent storage engines, minimizing co-
ordination overhead in the write path. As shown in our preliminary get_range(min, max) returns an iterator over samples from the
results (Section 4), this design allows Mach to scale far better than specified source that fall within the time range between min and
alternatives. max. get_range operates on a snapshot of samples from the source
 taken as of the time the snapshot was requested. As mentioned,
Append-Mostly Fast Path: For flexibility, general-purpose storage Mach guarantees that all push calls completed prior to the snapshot
engines and TSDBs permit operations like updates and out-of-order will be visible to get_range.
inserts. However, for metrics workloads, virtually all samples from Figure 4c shows pseudocode for querying Mach. The application
a single source are emitted and received in order. The overhead of begins by requesting a snapshot for the data source identified by
maintaining data structures like B+trees or LSM-trees is wasted in id. Calling get_range on the snapshot returns an iterator over
a workload with millions of small, mostly in-order writes. samples that fall within the specified time range. The application
 Instead, writer threads in Mach have a fast path tailored for can either reuse the snapshot object indefinitely for future queries
append-mostly writes. This fast path is comparable to simply ap- without incurring additional snapshot creation overhead or request
pending to the end of a list and only possible because of Mach’s a new one to get an updated view of the data.
CIDR’22, January 9-12, 2022, Chaminade, USA Franco Solleza, Andrew Crotty, Suman Karumuri, Nesime Tatbul, Stan Zdonik

let db = DB::new(writers=10); let writer = db.writer(writer_id); let snap = db.snapshot(id);
let id = db.register(config); for (id, ts, values) in input { for s in snap.get_range(min, max) {
let writer_id = db.writer_id(id); writer.push(id, ts, values); // process s ...
 } }
(a) API to initialize Mach with ten writers (b) API to initialize a Mach writer and push (c) API to snapshot samples from a source
and register a data source. The user speci- samples into Mach from some input (e.g., a and query for a range of time. The applica-
fies characteristics of samples (e.g., number queue or scraper). The application may del- tion may delegate the snapshot to a sepa-
of values) through the config argument. egate the writer to a separate writer thread. rate query thread.

 Figure 4: Pseudocode demonstrating the usage of Mach’s API.

3.3 Write Path Rather than compressing individual samples, Mach compresses
Given the massive volume of metrics data produced in observability the entire active segment at once, which amortizes the cost over
use cases, we have designed Mach to prioritize write performance. many samples and enables better compression. Mach also has a
As shown in Figure 5a, Mach manages loosely coordinated threads modular compression layer that can apply different compression
in the write path using minimal global state. A concurrent global schemes on a case-by-case basis, even at the level of individual
hash table maps sources to their corresponding samples, and an columns. For example, CPU temperature readings that vary in a
atomic counter distributes files to each writer thread. To add a new relatively small fixed range might benefit from a more specialized
source, Mach updates the global hash table and assigns the source algorithm than measured CPU utilization.
to the appropriate writer thread. One simple technique that we have found particularly useful in
 In the figure, the entry for data source is color-coded to show practice involves converting floating-point values to fixed-point
the different components of an entry in the global hash table. The integer representations based on a user-specified number of signifi-
blue and green boxes represent the active segment and active block, cant digits. The resulting values from this strategy are significantly
respectively, in the writer thread. These two components comprise more intuitive than other lossy compression algorithms that require
the write buffer for new samples. users to provide an error bound [23, 19].
 The yellow and pink boxes are blocks of samples from that
 Active Block: The active block ○ 4 is a fixed-size in-memory buffer
the writer thread has already compressed and flushed to secondary
 that corresponds to the OS page size (e.g., 4 KB). As the writer thread
storage. Mach stores these blocks in the block index so that readers
 adds compressed segments, the active block keeps track of the
can perform efficient time-based lookups.
 remaining space using another atomic counter. If not enough space
 The red arrows in Figure 5a show the flow of samples through the
 remains in the active block to fit an entire compressed segment,
append-mostly fast path after calling push. When source M pushes
 Mach breaks the segment into smaller pieces in an attempt to fill
a sample, the writer thread first looks up the necessary metadata
 1 and then appends the sample to up the block as much as possible and then flushes the block to the
in a thread-local hash table ○
 5
 corresponding file ○.
the active segment ○. 2 For rare cases when the application wants
to perform an out-of-order insert, Mach stores the samples in a Block Flushing: As mentioned, each writer thread maintains a
separate out-of-order buffer that is periodically merged with the 6 with a name drawn from the global atomic counter
 private file ○
rest of the data. shown in Figure 5a, as well as the current offset in the file (i.e.,
 the number of blocks written). After flushing a block to the file,
Active Segment: The active segment is an in-memory buffer with a writer thread adds the block’s unique identifier, which consists
a parameterizable fixed size, which defaults to 256 samples. Mach of the filename and offset, to the block index stored in the global
amortizes expensive operations (e.g., compression) in the write hash table ○.7 Mach periodically calls fsync on files to ensure
path by operating on many samples at a time while still making persistence. By default, flushing occurs either after every ten blocks
inserts immediately queryable after a push completes. Working or five seconds, whichever comes first.
with batches of samples also enables many possible optimizations When the file reaches a parameterizable size (e.g., 1 GB), Mach
(e.g., SIMD processing). performs a final fsync and then closes it. The thread then takes
 The active segment stores samples in a columnar fashion, with the next available filename from the global counter.
the current number of samples maintained by an atomic counter.
When the active segment fills up, it becomes immutable. The writer
thread then takes a snapshot lock to block concurrent readers (see 3.4 Read Path
 3
Section 3.4) until it finishes compressing the active segment ○. Figure 5b shows the read path, which also leverages Mach’s loosely
 coordinated architecture. The read path begins with a snapshot
Compression: Many TSDBs use some variation of the Gorilla [26] operation executed on the global state ○.1 Mach looks up the id
compression scheme, providing little flexibility for use cases not of the data source in the global hash table and then executes a
suited to that algorithm. Moreover, they typically compress samples snapshot operation, which returns an iterator over all samples up
eagerly as soon as they arrive, which adds substantial overhead to until the time of snapshot creation. Importantly, this iterator does
the write path. not block concurrent writer threads.
Mach: A Pluggable Metrics Storage Engine for the Age of Observability CIDR’22, January 9-12, 2022, Chaminade, USA (a) Write Path (b) Read Path Figure 5: The read and write paths in Mach. (a) Write Path: When calling push for data source M, the write path progressively moves data from an in-memory uncompressed active segment to an in-memory compressed active block, and finally to persistent blocks on disk. The global state (i.e., DB instance in Figure 4a) holds a concurrent hash table that contains pointers to these components. (b) Read Path: When a reader takes a snapshot, it looks up pointers to the active segment, active block, and list of persistent blocks from the global state. It then loads the atomic counters of the active segment and active block, and copies the head of the list of persistent blocks. Snapshots: As described in Section 3.1, the intuition behind Mach’s show that the overhead of traversing the index is small relative snapshotting approach is similar to an append-only list. When a to overall query runtime, we plan to investigate alternative data writer thread appends a new sample to the end of its active segment, structures in the future. all previous samples in the active segment are considered immutable. Reading Blocks: After gathering all of the relevant block iden- To create a snapshot, the reader thread only needs to know the tifiers, Mach can then begin scanning these blocks. Since blocks current head and the number of samples in the active segment at of samples from the same source are written sequentially in time the time of the snapshot. order, a scan involves fast sequential read operations from persis- First, the reader thread takes the snapshot lock for the speci- tent storage, followed by decompressing the blocks. If blocks are fied source, retrieves pointers to both the active segment ○ 2 and needed by other queries, they will remain available in the OS page active block ○ 3 from the global hash table, and then loads the cur- cache until being evicted. rent values from the atomic counters for each. To complete the snapshotting process, the reader thread then takes a pointer to the 4 PRELIMINARY RESULTS head of the block index in the global hash table ○4 and releases the We implemented a prototype of Mach in Rust. Our preliminary snapshot lock. results show: (1) our multiple independent active segments scale bet- In many existing systems, a reader will hold locks for the entire ter than alternatives and can ingest up to 480M unbatched floating- duration of the query, which could include expensive disk I/O. In point values per second on a single node, which is nearly 10× higher contrast, the critical section of Mach’s snapshotting mechanism write throughput than the closest competitor for comparable uni- is short and deterministic. Reads will never block writes in a non- variate workloads; (2) the append-only fast-path can maintain high deterministic way; counterintuitively, writes can instead block reads write throughput when scaling in the space dimension to as many when compressing an active segment. as 1M distinct sources; and (3) Mach provides up to 3× higher read throughput on queries over two different time ranges. In the Identifying Blocks: The reader thread then traverses the active following, we provide a detailed discussion of these results. segment, active block, and block index to identify all samples that fall within the time range specified by the get_range operation. The block index is currently implemented as a linked list where 4.1 Setup each node contains several block identifiers. With a linked list, snap- Environment: Our experiments were conducted on an Ubuntu shotting is lightweight, since readers do not need to traverse a more 20.04 server with a 2.7 GHz Intel®Xeon®Gold 6150 CPU with 32 complex data structure. Additionally, querying recent samples (i.e., cores and hyper-threading, 380 GB RAM, and 3.2 TB Samsung SSDs. scanning forward from the head of the list) is very efficient, since Data: To evaluate the systems, we used server monitoring data read queries are biased toward freshness. Although our experiments collected over three months from the machines managed by the
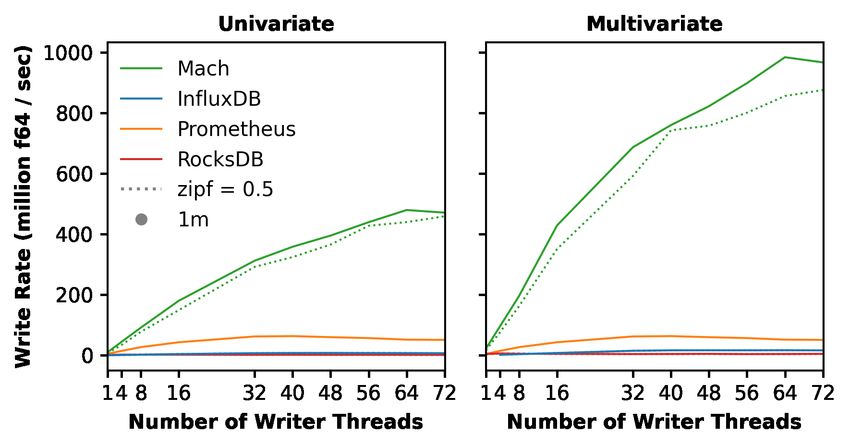
CIDR’22, January 9-12, 2022, Chaminade, USA Franco Solleza, Andrew Crotty, Suman Karumuri, Nesime Tatbul, Stan Zdonik

 (a) Varying number of threads (b) Varying number of data sources

 Figure 6: Ingestion Throughput

 We report all results as the number of double-precision floating-
 point values written or read per second (f64/sec).

 4.2 Write Performance
 Scaling with the Number of Writers: In this experiment, we
 evaluated how well each system scales as the number of writer
 threads increases. We split 10K sources over the specified number
 of writer threads. A Zipfian skew of either 0.99 or 0.5 determines
 the order in which data sources write samples for all systems ex-
 cept Prometheus, as its pull-based approach makes write skew an
 inappropriate characterization of its ingestion performance. We
 aborted experiments that ran for longer than 15 minutes.
 Figure 7: Read Throughput (note the difference in -axis) Figure 6a shows the write throughput of each system. Unsur-
 prisingly, RocksDB exhibited the worst performance, as it was not
 designed for this workload. InfluxDB outperformed RocksDB by
Department of Computer Science at Brown University. The dataset roughly 2–4×, and Prometheus outperformed both InfluxDB (almost
contains 696 data sources, each with 18 metrics and an average of 10×) and RocksDB (almost 30×). Of course, Mach significantly out-
32K samples, which provides a total of 11.5K univariate and 3.2K performed all three of these systems. In particular, we observed that
multivariate data sources. In our experiments, each data source is Mach scales much better with the number of writer threads than
randomly chosen (with repetition) from either the univariate or the comparison points due to its loosely coordinated architecture.
multivariate set. With multivariate data, Mach achieved substantial increases in
Comparison Systems: We compare Mach to Prometheus v.2.29, write throughput because the costs on the write path were amor-
InfluxDB tsm1, and RocksDB. For Prometheus and InfluxDB, we tized over multiple values. We also noticed similar (though much
extracted and benchmarked their respective storage engines to less substantial) improvements for RocksDB and InfluxDB. Since
avoid any overhead. We chose these systems because they persist Prometheus only supports univariate data, we include the same re-
their data in a deterministic way and are representative of the sults from the previous experiment in the figure as an upper bound
different types of storage engines that might be used to store metrics of its performance.
data. We excluded systems that rely on distributed execution (e.g., Scaling with the Number of Data Sources: In this experiment,
BTrDB [17], Druid [30]) or are primarily designed for in-memory we evaluated how well each system scales as the number of data
settings (e.g., Gorilla [26]/Beringei [2], Timon [18], Heracles [29]). sources increases. We fixed the number of writer threads at 32 and
 The experiments for Prometheus and InfluxDB were written used a Zipfian skew of 0.99 for data source selection.
in Go, while all others were written in Rust. All experiments in Figure 6b shows the results. In the univariate case, all systems
Section 4.2 flush data to persistent storage, and we disabled write- experienced a gradual decrease in write throughput due to accumu-
ahead logging on all systems. For InfluxDB and RocksDB, our in- lating overheads (e.g., hash table lookups, CPU cache misses). How-
gestion experiments write samples in batches of 1K, as we found ever, Mach always maintained more than a 4× improvement over
that writing single samples yielded extremely low throughput. Prometheus. At 1M distinct data sources, Mach achieved a write
Note that, in contrast, Mach’s push operation allows the appli- throughput of 160M f64/sec, more than 2× the peak write through-
cation to write individual samples without having to worry about put achieved by Prometheus. In the multivariate case, Mach’s
batching. Additionally, we set RocksDB’s parallelism=64 and write throughput stayed above 380M f64/sec, even for 1M distinct
max_background_jobs=64. sources. Both InfluxDB and RocksDB timed out.
Mach: A Pluggable Metrics Storage Engine for the Age of Observability CIDR’22, January 9-12, 2022, Chaminade, USA

 To model settings with limited compute resources, we reran the whereas supporting traces might necessitate the development of
same experiment using only a single writer thread. Increasing the entirely new data models (e.g., graph-based approaches to facilitate
number of sources from 10K to 100K resulted in a 35% decrease in root cause analysis). Our ultimate goal is to establish Mach as a
Mach’s write throughput (from 10M to 6.5M f64/sec) and a 46% unifying storage engine for observability workloads.
decrease in write throughput for Prometheus (from 4.9M to 2.7M Mach’s role as a storage engine also opens up opportunities
f64/sec). With 10K data sources, Mach’s write throughput was 2× for research in the broader observability ecosystem, and we are
higher than Prometheus, increasing to 2.5× at 100K sources. investigating several places in the observability stack where Mach
 could add substantial value. For example, more full-featured sys-
4.3 Read Performance tems could build higher-level operators (e.g., filtering, aggregation,
 interpolation, windowing) on top of Mach’s low-level API. More
In this experiment, we tested read query performance with a vary-
 importantly, Mach’s excellent performance might even allow us to
ing number of reader threads. We evaluated two different time
 completely rethink the design of the entire observability stack.
ranges that reflect common analysis windows in observability set-
tings: the past 1 hour and the past 24 hours. We loaded 10K data
 ACKNOWLEDGMENTS
sources into InfluxDB, Prometheus, and Mach, and then we ex-
ecuted 100K get_range queries per thread. Since not all of the We would like to thank Malte Schwarzkopf, Theo Benson, and Ugur
systems batch lookups for multiple data sources, each reader thread Cetintemel for their helpful feedback. This research was funded in
only queried a single data source at a time to maintain a consistent part by NSF grants IIS-1514491 and IIS-1526639.
baseline. Therefore, the results in Figure 7 are a lower bound on
performance for lookups over many data sources. REFERENCES
 [1] Amazon S3 Glacier. https://aws.amazon.com/s3/glacier/.
 On the 1-hour workload, Prometheus and Mach each had a read [2] Beringei. https://github.com/facebookarchive/beringei.
throughput of about 200M f64/sec for univariate data. Both outper- [3] ClickHouse. https://clickhouse.com/.
formed InfluxDB, which had a peak throughput of only 42M f64/sec. [4] InfluxDB. https://www.influxdata.com/.
 [5] Kafka. https://kafka.apache.org/.
Since Prometheus and Mach were designed for this workload (i.e., [6] LevelDB. https://github.com/google/leveldb.
reading more recent data), these results are expected. Similar to [7] M3. https://m3db.io/.
 [8] Prometheus. https://prometheus.io/.
ingestion, querying multivariate data increased read throughput. [9] RocksDB. http://rocksdb.org/.
InfluxDB’s peak throughput was 56M f64/sec, while Mach’s was [10] SQLite. https://www.sqlite.org/index.html.
about 700M f64/sec. Since these queries access very little of the [11] Thanos. https://thanos.io/.
 [12] TimescaleDB. https://www.timescale.com/.
data, the overall query runtime for all systems was dominated by [13] VictoriaMetrics. https://victoriametrics.com.
fixed sources of overhead rather than data scanning. For example, [14] WiredTiger. http://source.wiredtiger.com/.
the snapshotting operation consumed the majority of execution [15] C. Adams, L. Alonso, B. Atkin, J. Banning, S. Bhola, R. Buskens, M. Chen, X. Chen,
 Y. Chung, Q. Jia, N. Sakharov, G. Talbot, N. Taylor, and A. Tart. Monarch: Google’s
time in Mach. Planet-Scale In-Memory Time Series Database. PVLDB, 13(12):3181–3194, 2020.
 On the 24-hour workload, InfluxDB at 1B f64/sec performed [16] A. Ailamaki, D. J. DeWitt, M. D. Hill, and M. Skounakis. Weaving Relations for
 Cache Performance. In VLDB, pages 169–180, 2001.
close to Mach, except with many concurrent querying threads. The [17] M. P. Andersen and D. E. Culler. BTrDB: Optimizing Storage System Design for
longer time range is advantageous for InfluxDB’s read-optimized Timeseries Processing. In FAST, pages 39–52, 2016.
file format (TSM files). However, InfluxDB and Mach treat multi- [18] W. Cao, Y. Gao, F. Li, S. Wang, B. Lin, K. Xu, X. Feng, Y. Wang, Z. Liu, and G. Zhang.
 Timon: A Timestamped Event Database for Efficient Telemetry Data Processing
variate data differently. Specifically, InfluxDB stores multivariate and Analytics. In SIGMOD, pages 739–753, 2020.
data in a purely columnar format, whereas Mach stores column [19] A. Ilkhechi, A. Crotty, A. Galakatos, Y. Mao, G. Fan, X. Shi, and U. Çetintemel.
chunks together similar to PAX [16]. This experiment shows the DeepSqueeze: Deep Semantic Compression for Tabular Data. In SIGMOD, pages
 1733–1746, 2020.
benefits of Mach’s chunked storage approach when requesting [20] S. Karumuri, F. Solleza, S. Zdonik, and N. Tatbul. Towards Observability Data
several columns, though we expect InfluxDB’s strategy to be better Management at Scale. SIGMOD Rec., 49(4):18–23, 2020.
when frequently querying only a small subset of the columns. [21] S. Karumuri, F. Solleza, S. Zdonik, and N. Tatbul. Cloud Observability: A MELTing
 Pot for Petabytes of Heterogenous Time Series. In CIDR, 2021.
 [22] R. Katkov. All Hands on Deck: What does Slack do when Slack goes down?
 https://slack.engineering/all-hands-on-deck/, 2020.
5 CONCLUSION & FUTURE WORK [23] P. Lindstrom. Fixed-Rate Compressed Floating-Point Arrays. TVCG, 20(12):2674–
This paper presented Mach, a new pluggable storage engine de- 2683, 2014.
 [24] M. A. Olson, K. Bostic, and M. I. Seltzer. Berkeley DB. In USENIX ATC, pages
signed to handle high-volume metrics data in an observability set- 183–191, 1999.
ting. We described Mach’s loosely coordinated architecture that [25] S. Papadopoulos, K. Datta, S. Madden, and T. G. Mattson. The TileDB Array Data
allows it to fully leverage the unique characteristics of these work- Storage Manager. PVLDB, 10(4):349–360, 2016.
 [26] T. Pelkonen, S. Franklin, P. Cavallaro, Q. Huang, J. Meza, J. Teller, and K. Veer-
loads. Our preliminary results demonstrate that, compared to sev- araghavan. Gorilla: A Fast, Scalable, In-Memory Time Series Database. PVLDB,
eral widely used alternatives, Mach can achieve nearly 10× higher 8(12):1816–1827, 2015.
 [27] M. Raasveldt and H. Mühleisen. DuckDB: an Embeddable Analytical Database.
write throughput and 3× higher read throughput. In SIGMOD, pages 1981–1984, 2019.
 In the future, we plan to investigate several natural extensions [28] X. Shi, Z. Feng, K. Li, Y. Zhou, H. Jin, Y. Jiang, B. He, Z. Ling, and X. Li. ByteSeries:
to Mach. Specifically, we believe that metrics workloads exhibit An In-Memory Time Series Database for Large-Scale Monitoring Systems. In
 SoCC, pages 60–73, 2020.
similar characteristics to other observability data types: logs, events, [29] Z. Wang, J. Xue, and Z. Shao. Heracles: An Efficient Storage Model and Data
and traces [20, 21]. For example, integrating log data will require the Flushing for Performance Monitoring Timeseries. PVLDB, 14(6):1080–1092, 2021.
investigation of fundamental design considerations (e.g., trading off [30] F. Yang, E. Tschetter, X. Léauté, N. Ray, G. Merlino, and D. Ganguli. Druid: A
 Real-time Analytical Data Store. In SIGMOD, pages 157–168, 2014.
compression speed with size, enabling search over compressed data),
You can also read