Longitudinal analysis of antibody decay in convalescent COVID 19 patients - Nature
←
→
Page content transcription
If your browser does not render page correctly, please read the page content below
www.nature.com/scientificreports
OPEN Longitudinal analysis of antibody
decay in convalescent COVID‑19
patients
Weiming Xia1,2*, Mingfei Li3,4, Ying Wang1,4, Lewis E. Kazis3,5, Kim Berlo6,
Noureddine Melikechi7 & Gregory R. Chiklis8
Determining the sustainability of antibodies targeting severe acute respiratory syndrome coronavirus
2 (SARS-CoV-2) is essential for predicting immune response against the Coronavirus disease 2019
(COVID-19). To quantify the antibody decay rates among the varying levels of anti-nucleocapsid
(anti-N) Immunoglobulin G (IgG) in convalescent COVID-19 patients and estimate the length of time
they maintained SARS-CoV-2 specific antibodies, we have collected longitudinal blood samples from
943 patients over the course of seven months after their initial detection of SARS-CoV-2 virus by
RT-PCR. Anti-N IgG levels were then quantified in these blood samples. The primary study outcome
was the comparison of antibody decay rates from convalescent patients with high or low initial levels
of antibodies using a mixed linear model. Additional measures include the length of time that patients
maintain sustainable levels of anti-N IgG. Antibody quantification of blood samples donated by the
same subject multiple times shows a gradual decrease of IgG levels to the cutoff index level of 1.4
signal/cut-off (S/C) on the Abbott Architect SARS-CoV-2 IgG test. In addition, this study shows that
antibody reduction rate is dependent on initial IgG levels, and patients with initial IgG levels above 3
S/C show a significant 1.68-fold faster reduction rate compared to those with initial IgG levels below
3 S/C. For a majority of the donors naturally occurring anti-N antibodies were detected above the
threshold for only four months after infection with SARS-CoV-2. This study is clinically important for
the prediction of immune response capacity in COVID-19 patients.
One year after the initial outbreak of the severe acute respiratory syndrome coronavirus 2 (SARS-CoV-2) pan-
demic, we are relying on vaccines to fight this potentially fatal coronavirus disease 2019 (COVID-19). There
are many clinical manifestations related to SARS-CoV-2 infection including a systemic hyperinflammation
among multiple organs1. Seroconversion of specific immunoglobulin M (IgM) and G (IgG) antibodies occurs
as early as the fourth day after symptom onset2, and IgM/G levels reach plateau within six days after IgM/IgG
seroconversion3. Appearance of IgA occurs early in seroconversion and peaks after three weeks, and is more per-
sistent than I gM4. In a longitudinal study following virus-specific IgG in 76 convalescent subjects for ~ 100 days,
IgG decay was found in most of those subjects, while a subset of subjects with a shorter recovery period had
stable antibody levels5.
Naturally occurring antibodies target spike protein (anti-S) and nucleoprotein (anti-N) of SARS-CoV-2 and
reflect immune responses among COVID-19 patients. Antibodies from 190 control subjects enrolled during
pre-COVID-19 era recognize SARS-CoV-2 open reading frame 1 (ORF1); in contrast, antibodies from 232
COVID-19 patients recognize the spike protein and nucleoprotein6. Among 270 PCR-confirmed COVID-19
patients, antibodies recognizing the receptor binding domain (RBD) of the viral protein have weaker responses
in non-hospitalized patients, compared to those from hospitalized patients7. In a study of 1850 COVID-19
patients, spike protein (S)-, RBD-specific IgM and IgG levels were found to be 1.5-fold higher among severe/
critical patients compared to patients with mild to moderate disease severity8. The RBD-specific IgG levels were
1
Geriatric Research Education Clinical Center, Bedford VA Healthcare System, Bedford, MA 01730,
USA. 2Department of Pharmacology and Experimental Therapeutics, Boston University School of Medicine,
Boston, MA, USA. 3Center for Healthcare Organization and Implementation Research, Bedford VA Healthcare
System, Bedford, MA, USA. 4Department of Mathematical Sciences, Bentley University, Waltham, MA,
USA. 5Department of Health Law, Policy and Management, Boston University School of Public Health,
Boston, MA, USA. 6Geotop and the Department of Earth and Planetary Sciences, McGill University, Montreal,
Canada. 7Department of Physics and Applied Physics, Kennedy College of Sciences, University of Massachusetts
Lowell, Lowell, MA, USA. 8MRN Diagnostics, Franklin, MA, USA. *email: weiming.xia@va.gov
Scientific Reports | (2021) 11:16796 | https://doi.org/10.1038/s41598-021-96171-4 1
Vol.:(0123456789)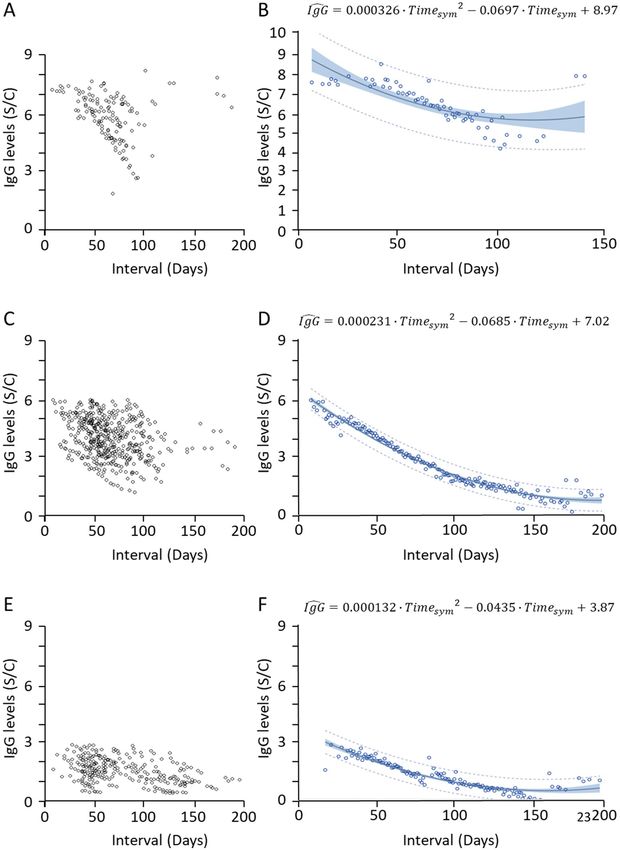
www.nature.com/scientificreports/
found to be four-fold higher in older patients than those in younger patients8. Among hospitalized patients, males
produced stronger SARS-CoV-2 antibody responses than f emales6. While female patients have more robust T
cell activation than male patients, male patients have higher plasma levels of innate immune cytokines and a
more robust induction of non-classical monocytes in b lood9.
In a recent study, Dan et al. show that anti-N IgG kinetics are similar to anti-S IgG over 8 months10. In this
study, we followed 943 patients for over 200 days after the last day showing symptoms and quantified anti-N
IgG levels and their decay rate to determine the length of time patients who have recovered from SARS-CoV-2
infection retained IgG levels. We focused on a longitudinal recording of antibody responses over the course of
7 months and provided estimation of the immune response capacity of COVID-19 patients.
Materials and methods
Materials. Reagents used for biochemical assays and sample preparation were purchased from Thermo Sci-
entific (Rockford, IL). The Architect SARS-CoV-2 IgG assay was obtained from Abbott (Abbott Park, IL). The
SARS-CoV-2 IgG assay is a chemiluminescent microparticle immunoassay (CMIA) with 100% sensitivity and
99.6% specificity; it is intended for the qualitative detection of IgG antibodies to SARS-CoV-2 nucleocapsid
protein in serum and plasma from individuals who are suspected or may have been infected by SARS-CoV-211.
The unit of IgG level was defined by signal/cut-off (S/C) per manufacturer’s Instruction for Use (IFU) with an
assay cutoff of 1.4 (S/C).
Subjects. Convalescent plasma was collected from subjects under the national expanded access protocol
(EAP) sponsored by the Mayo Clinic. This program was established in April 2020 and has since enrolled > 100,000
subjects12. Blood collection was approved by institutional review committee Diagnostics Investigational Review
Board. All studies were performed in accordance with FDA guidelines and Code of Federal regulations includ-
ing IRB approval, and informed consent was obtained from all participants for blood donation. The collections
were carried out under an Emergency Investigational New Drug (eIND) design approved by the FDA. There
is no personal identifiable information, symptom level, and disease severity available for any of the donors in
this study. Since the onset of the pandemic in February 2020, blood was collected from these subjects every ten
days, and the data was censored as of November 2020. Over three thousand records were retrieved for this study
(Supplement Table S1). COVID-19 positive/negative patients were identified by nucleic acid RT-PCR detection
of SARS-CoV-2 virus using Emergency Use Authorization (EUA) approved molecular tests. Since eIND pursues
convalescent plasma, COVID-19 negative subjects were not followed. COVID-19 positive patients provided
blood one or more times for IgG measurement. The dates of PCR testing, the last day showing symptoms, and
the dates of blood donation were recorded. Among 943 subjects, there were 471 subjects who donated blood
once. A total of 472 subjects donated blood two or more times, including 214 patients whose anti-N IgG levels
rebound one or more times, and 258 patients whose anti-N IgG levels monotonically decreased from the first
to last dates of blood donation. We excluded seven outlier subjects (whose initial anti-N IgG level was below 0.1
S/C), as we did not find any elevation of IgG levels over time even though viral infection was confirmed by RT-
PCR. We do not have the clinical information of symptom level and disease severity of these seven subjects. We
have analyzed anti-N IgG levels of 251 subjects and correlated them to the time intervals between the last day
showing symptoms and the day of blood donation.
Statistical analysis. To estimate the average anti-N IgG level at each time point, we applied a mixed linear
model on patients’ anti-N IgG level as the dependent variable while controlling for random effects of patients
and the fixed effect of time points. The mixed linear model allows a wide variety of correlation patterns to be
modeled and provides a robust approach in these situations.
The hierarchy of levels for our mixed model includes the subjects (level 2) and the multiple anti-N IgG meas-
urements within subjects (lower level 1). The multiple IgG measurements within the same subject decreased over
time. Using the mixed model, we studied the overall main effect of time after viral infection on IgG measure-
ments. For each time point, the mixed model compares the mean of all IgG measurements for this time point
with the mean of all IgG measurements at the reference time point (the last donation date after the last symptom
date among all subjects). Next, the maximum likelihood method was used as an iterative method to find the best
statistical estimate on the effects of time points and IgG levels at each time point. To better understand the overall
decreasing pattern of IgG and predict its level at certain time points, we applied first and second order lines to
the estimated IgG level at each time point from the mixed model. To prevent the inflation of a false positive
rate in multiple comparisons, we used a Bonferroni correction to adjust the significance level. Based on a total
of 160 time points, the adjusted significance level is 0.05/160 = 0.0003. With this adjusted significance level, we
compared the p-values at each time point and reported the comparison result. We performed a two-sided t test
to compare the IgG level at each time point with a positive antibody threshold of 1.4 S/C. SAS 9.4 and R 4.0.2
were used for our analysis.
Results
Collection of blood samples from COVID‑19 patients. We have analyzed anti-N IgG levels from 943
COVID-19 patients who tested positive for SARS-CoV-2 via RT-PCR testing. Among 472 subjects with multiple
donations, most people donated blood less than five times, and the maximum number of times that one person
donated blood was 27 times (Fig. 1A). The majority of patients exhibited their last days of symptoms in July
and August (Fig. 1B). The average time between the last day showing symptoms and the blood donation was
78 ± 38 days, up to the longest period of 200 days, which reflects timing of our blood collection and antibody
test (Fig. 1C).
Scientific Reports | (2021) 11:16796 | https://doi.org/10.1038/s41598-021-96171-4 2
Vol:.(1234567890)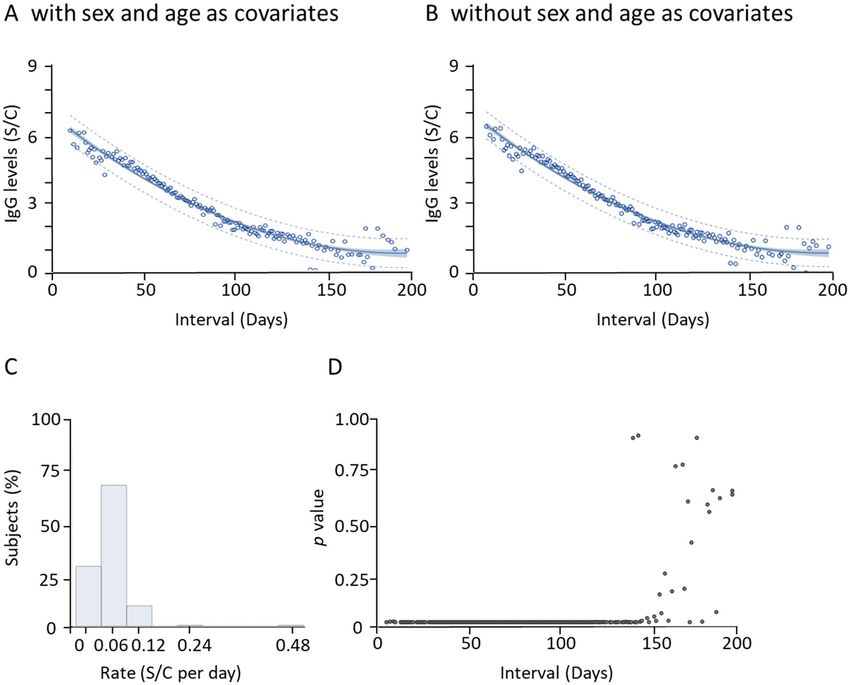
www.nature.com/scientificreports/
Figure 1. Distribution of COVID-19 patients with multiple blood donation. (A) Distribution of the number of
blood donations from COVID-19 patients. (B) Distribution of patients with their last days showing COVID-19
symptoms. (C) Distribution of the time interval between the last day showing symptoms and the latest day of
blood donation.
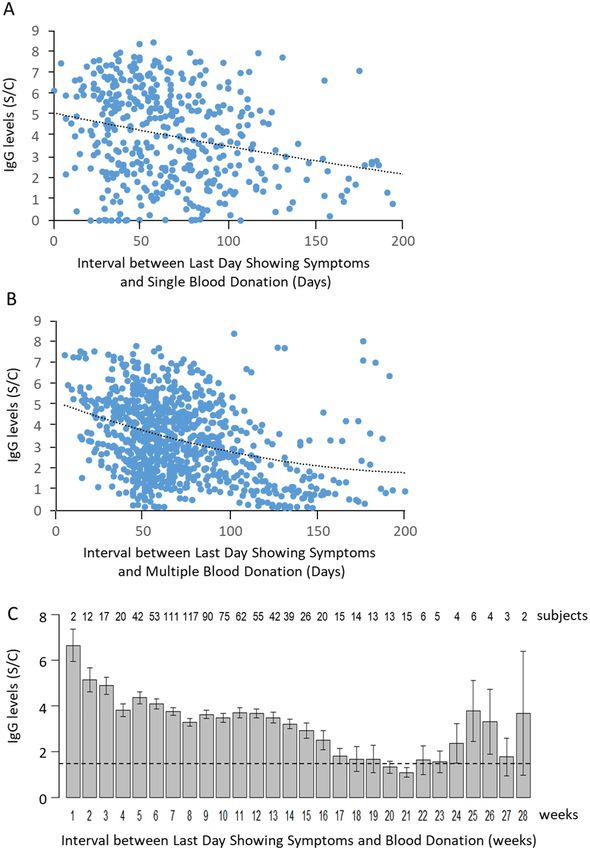
Reduction of antibody levels. Among all subjects who donated blood once, those who donated within
100 days since the last day showing symptoms had levels of anti-N IgG reaching 9 S/C (Fig. 2A). Between 100
to 150 days, most donors had IgG levels up to 6 S/C; after 150 days, most donors carried IgG levels below 3 S/C,
except for several outliers (Fig. 2A). Among 472 subjects who donated blood two or more times, 251 subjects
exhibited their highest IgG levels on the first day of donation and the lowest IgG levels on the last day of dona-
tion, with time-dependent linear reduction of IgG levels (Supplement Fig. S1A,B). When IgG levels from these
subjects were illustrated, we found a similar distribution of IgG levels at different intervals between the last day
showing symptoms and multiple blood donation days (Fig. 2B).
We calculated the average anti-N IgG levels each week after the last day showing symptoms. We found that
the average IgG level dropped from > 6 S/C to 5 S/C after the first week. This level continued to decrease to 1.4
S/C, the threshold level of the Abbott Architect positive/negative antibody test (Fig. 2C, dotted line), during the
17th week (120 days). The lowest level was measured during the 21st week (e.g., 150 days). A large variation of
IgG levels was observed and attributed to a small number of subjects who donated blood after 21 weeks (Fig. 2C).
The anti-N IgG levels from some of these subjects remained high for 200 days (Fig. 2B), leading to an increase
in average levels of IgG among a small number of subjects (Fig. 2C).
Antibody reduction rate is dependent on initial anti‑N IgG levels. We separated all subjects into
three groups, based on the anti-N IgG levels from their first donated blood samples. We searched for any dif-
Scientific Reports | (2021) 11:16796 | https://doi.org/10.1038/s41598-021-96171-4 3
Vol.:(0123456789)www.nature.com/scientificreports/
Figure 2. Reduction of average anti-N IgG levels in blood donated by COVID-19 positive subjects. (A) Anti-N IgG levels from
subjects who donated blood once within 200 days after the last day showing symptoms illustrated a time-dependent decay. (B) All
records of anti-N IgG levels in subjects who donated blood two or more times within 200 days after the last day showing symptoms
are illustrated. Dotted lines represent the second order polynomial fitting curve. (C) The average anti-N IgG levels from blood samples
donated within each week after the last day showing symptoms were calculated. The IgG levels were above 6 S/C at the first week and
dropped to ~ 1.4 S/C at the 17th weeks. The dotted line represents the Abbott Architect positive/negative antibody threshold level at 1.4
S/C. Bars represent the standard error of means.
Scientific Reports | (2021) 11:16796 | https://doi.org/10.1038/s41598-021-96171-4 4
Vol:.(1234567890)www.nature.com/scientificreports/
ference in antibody reduction rates in subjects carrying high vs. low levels of IgG. The first group of 36 subjects
had starting IgG levels above 6 S/C; two subjects sustained high levels of IgG for more than 6 months and were
excluded for the calculation of reduction rate (Fig. 3A).
We used a mixed model to estimate the reduction rate of anti-N IgG levels for these 34 subjects. The mixed
model focuses on the overall effect of time after viral infection on IgG measurements. Our mixed model included
the subjects and the multiple IgG measurements within subjects, which were decreasing over the time. We
applied a second order polynomial line to the estimated IgG level at each time point. The estimated fitting curve
= 0.000326 · Timesym 2 − 0.0697 · Timesym + 8.97, where Timesym represents the time interval between the
is IgG
last day showing symptoms and the day of blood donation (Fig. 3B). We also created a first order linear fitting
= −0.0284 · Timesym + 7.92. When the initial IgG levels were high (> 6 S/C), the reduction rate was
curve, IgG
approximately at 0.0284 ± 0.0077 S/C per day.
A second group of 129 subjects with initial anti-N IgG levels between 3 and 6 S/C were followed for
200 days. We found that the levels of IgG were clustered within 120 days, and a few subjects maintained
their high IgG levels up to 200 days (Fig. 3C). We also followed individual subject’s IgG levels and applied
the same mixed model to estimate the reduction rate (Fig. 3D), using a second order polynomial fit-
ting curve, IgG = 0.000231 · Timesym 2 − 0.0685 · Timesym + 7.02 . The first order linear fitting curve is
= −0.0283 · Timesym + 5.71, and the reduction rate was estimated to be 0.0283 ± 0.0035 S/C per day, simi-
IgG
lar to those from the first group of subjects with higher initial IgG levels.
A third group of 86 subjects had low initial anti-N IgG levels (< 3 S/C) (Fig. 3E). When individ-
ual subject’s IgG levels were followed using the same mixed model, a much slower reduction rate was
observed (Fig. 3F). A second order polynomial fitting curve was used to estimate IgG level at each
time point, IgG = 0.000132 · Timesym 2 − 0.0435 · Timesym + 3.87 . The first order linear fitting curve is
= −0.0168 · Timesym + 2.77, and the reduction rate was estimated to be 0.0168 ± 0.0017 S/C per day. Thus,
IgG
the reduction rate in subjects with initial IgG levels above 3 S/C was 1.68-fold faster than those with initial IgG
levels below 3 S/C, and the difference is statistically significant (p < 0.05).
Significant antibody decay four months after last day showing symptoms. We analyzed the
overall anti-N IgG reduction across 200 days. We created a fitting curve to estimate the relative levels of IgG for
all subjects using the mixed linear model with age and sex as covariates (Fig. 4A). The second order polynomial
= 0.000156 · Timesym 2 − 0.0613 · Timesym + 6.62. Depending on the length of time follow-
fitting curve is IgG
ing the last day showing symptoms, most patients exhibited a gradual reduction of antibody levels. A mixed
linear model without age and sex as covariates is also given (Fig. 4B). The second order polynomial fitting curve
= 0.000156 · Timesym 2 − 0.0614 · Timesym + 6.68. We find that all patients (except for 6 outlier records;
is IgG
R2 = 0.9674) (Fig. 4B) fall within a 95% confidence interval for the fitted curve. These outcomes, without age and
sex as covariates, were almost identical to those with age and sex as covariates. The distribution of reduction
rates was found clustered below 0.12 S/C per day, with a few cases showing a high reduction rate at 0.48 S/C per
day (Fig. 4C). Using linear curve fitting, the average decay rate for all subjects was estimated at 0.03 S/C per day
(Supplement Fig. S2).
We calculated the variation of anti-N IgG levels at individual time points from day five to day 200 since the last
day showing symptoms. We used the Bonferroni adjustment for multiple simultaneous comparisons and plotted
the p values against time intervals (Fig. 4D). All patients who donated blood within 120 days (17 weeks) after
their last day showing symptoms exhibited average IgG levels higher than 1.4 S/C (Fig. 2C). After 120 days, the
variation of IgG levels was high (Fig. 4D). We found that the mean IgG level (± SD) for day 122 was 1.65 ± 0.26
S/C and for day 123, it was 1.32 ± 0.40 S/C. This suggests that once the IgG level reduced to 1.4 S/C, there was a
large variation of IgG levels among those patients who donated their blood samples 120 or more days after the
last day showing symptoms.
Discussion
Since the start of the SARS-CoV-2 pandemic, over 187 million COVID-19 patients worldwide have recov-
ered from the infection, and convergent antibody responses to SARS-CoV-2 in convalescent individuals have
been intensely investigated for therapeutic a pplications13. We have followed our convalescent subjects for over
200 days, and our work represents one of the first reported longitudinal studies over the course of a half y ear10,
14
. Our study yields unique information on variable antibody decay rates among different convalescent patients.
On average, antibodies reach constant levels by 16 to 30 days post symptom onset (PSO)5, 15. Based on our
calculation, the rate of anti-N IgG reduction was relatively higher at the beginning, then gradually decreased to
a steady state after four months (Fig. 4), at which point the fluctuation of IgG levels exhibited random variation
across all recovered patients. This is consistent with a previous report that anti-RBD-IgG responses decayed
slowly through 90 days in 343 COVID-19 patients out of a total of 122 days under investigation16. The anti-
RBD-IgG antibodies are correlated with anti-S neutralizing antibody titers that remain steady for 75 days PSO16.
In a separate study of samples collected up to 115 days PSO, IgG levels were found to be stable for up to three
months15, which is longer than a 49-day half-life found in a cohort of 647 SARS-CoV-2 infected patients17. This
suggests that the antibodies generated from initial SARS-CoV-2 infection were sustained for a significant period
of time and primed the adaptive immune response with B and T cells, which may prevent severe COVID-19
outcomes18–20.
Scientific Reports | (2021) 11:16796 | https://doi.org/10.1038/s41598-021-96171-4 5
Vol.:(0123456789)www.nature.com/scientificreports/
Figure 3. Antibody decay rates in subjects with variable anti-N IgG levels. (A) Distribution of anti-N IgG levels
from subjects whose first donation of blood carried high levels of IgG (above 6 S/C). (B) Estimated mean anti-N
IgG levels at each time point from the mixed model estimation. (C) Distribution of anti-N IgG levels from subjects
whose first donation of blood carried medium levels of IgG (between 3 and 6 S/C). (D) Estimated mean anti-N
IgG levels at each time point from the mixed model estimation. (E) Distribution of anti-N IgG levels from subjects
whose first donation of blood carried low levels of IgG (below 3 S/C). (F) Estimated mean anti-N IgG levels at each
time point from the mixed model estimation. Each dot represents the estimated IgG level at that time point. In (B,
D, F) the solid curve line is the estimated fitting model. The blue shaded band shows the 95% confidence interval
for the IgG level, and the dashed band shows the 95% prediction interval for the IgG level with this model.
Scientific Reports | (2021) 11:16796 | https://doi.org/10.1038/s41598-021-96171-4 6
Vol:.(1234567890)www.nature.com/scientificreports/
Figure 4. Antibody decay for 4 months after last day showing symptoms. (A) Mean anti-N IgG levels were
calculated at each time point from the mixed model estimation with sex and age as covariates. Each dot
represents the estimated IgG level at that time point. The solid curve line is the estimated fitting model. The
blue shaded band shows the 95% confidence interval for the IgG level, and the dashed band shows the 95%
prediction interval for the IgG level with this model. (B) Mean anti-N IgG levels were calculated at each time
point from the mixed model estimation without sex and age as covariates. (C) Distribution of overall decline
rates from all patients. The rate was defined as the difference between the first- and last-day anti-N IgG levels
divided by the time interval. (D) The variation of anti-N IgG levels at individual time points from day five to
day 200 since the last day showing symptoms was calculated. Due to the multiple simultaneous comparisons,
Bonferroni adjustment was used to plot the p values against time intervals, and high variation of IgG levels was
observed after 120 days.
Responses of specific T cells to the viral spike protein are correlated with anti-SARS-CoV-2 IgG and IgA
titers21. On the other hand, a strong cytotoxic Tfh response is correlated negatively with anti-S antibody levels22,
23
. Anti-S antibodies, targeting the RBD, N-terminal domain (NTD) and a third region that bridges two separate
RBDs24, could block the binding of A CE225, with highly potent 50% virus-inhibitory concentrations in the range
13, 24, 26
of 0.7–15 ng/ml . Similar to findings in the UK Biobank SARS-CoV-2 Serology Study, the latest findings
from convalescent donors illustrate the retention of low levels of IgG antibodies in 80% of blood samples col-
lected at 6–8 months after symptom onset, with the persistent presence of SARS-CoV-2-specific memory B- and
T-cells10, 14.
Sustainability of antibodies after infection varies across populations. We have identified a few subjects whose
anti-N IgG levels were sustained at high levels for about 200 days (Fig. 3A). These subjects donated blood multiple
times with little reduction of IgG levels. Further examination of these subjects will help us understand varia-
tions in acute infection, convalescence, and memory phases from SARS-CoV-227. The Abbott Architect anti-N
IgG assay has been widely used to measure IgG levels in the population. Use of this assay for our COVID-19
patients revealed an excellent agreement between our patients’ IgG levels at a time point around day 120 and
the threshold level of 1.4 S/C, established by the Abbott IgG assay for the positive antibody presence. We found
that our patients’ IgG levels dropped below 1.4 S/C and became random after 120 days post the last day showing
symptoms. It will be important to compare our findings to anti-S IgG in future studies among vaccinated subjects.
Our studies have several limitations. First, we did not measure neutralizing antibody titers of our samples.
An understanding of enhancement and decaying of neutralizing antibody titers will provide the functional
association with the course of viral infection and immune responses. Second, we did not separate age and sex as
Scientific Reports | (2021) 11:16796 | https://doi.org/10.1038/s41598-021-96171-4 7
Vol.:(0123456789)www.nature.com/scientificreports/
independent covariates for our analysis, even though we found similar outcomes when age and sex were either
included or excluded as covariates. It is clear that aging plays an important role in responses to COVID-1928;
older people have a reduced amount of CD4+ and CD8+ T cells, and poor T cell response was found negatively
correlated with the age of patients9, 29. Sex differences exist in immune responses with female subjects having
more T cell activation with better disease outcomes compared with male patients9. Third, we only used the Abbott
Architect assay for IgG against nucleocapsid protein, therefore, other antibody tests may detect different IgG
levels after 120 days. It was reported that IgG against the spike protein was stable over 6 months10. It is important
to rule out that our 120-day time line is not a function of the specific assay used in this study. While the anti-N
IgG levels of convalescent plasma samples have been used as an indicator of immune response among COVID-19
patients, the levels of anti-S or anti-RBD antibodies are likely to be more informative for predicting protective
potential. Based on a systematic review of ~ 100 clinical studies and in vitro tests, convalescent plasma therapy has
demonstrated efficacy in saving patients who are critically ill or mechanically ventilated and resistant to antivirals
and supportive c are30. Therefore, evaluating IgG levels in convalescent plasma samples is clinically important.
In summary, we have demonstrated that naturally occurring antibodies decreased at different rates during
the four months after infection with SARS-CoV-2. It is clinically important to predict the immune response
capacity and to prevent COVID-19 re-infection. Future studies are needed to understand the sustainability of
antibodies and time course of eliciting the adaptive immune response both in an initial exposure to SARS-CoV-2
virus and after vaccination.
Received: 19 February 2021; Accepted: 16 July 2021
References
1. Nie, X. et al. Multi-organ proteomic landscape of COVID-19 autopsies. Cell https://doi.org/10.1016/j.cell.2021.01.004 (2021).
2. Xiang, F. et al. Antibody detection and dynamic characteristics in patients with coronavirus disease 2019. Clin. Infect. Dis. 71,
1930–1934. https://doi.org/10.1093/cid/ciaa461 (2020).
3. Long, Q.-X. et al. Antibody responses to SARS-CoV-2 in patients with COVID-19. Nat. Med. 26, 845–848. https://d oi.o
rg/1 0.1 038/
s41591-020-0897-1 (2020).
4. Padoan, A. et al. IgA-Ab response to spike glycoprotein of SARS-CoV-2 in patients with COVID-19: A longitudinal study. Clin.
Chim. Acta 507, 164–166. https://doi.org/10.1016/j.cca.2020.04.026 (2020).
5. Chen, Y. et al. Quick COVID-19 healers sustain anti-SARS-CoV-2 antibody production. Cell 183, 1496-1507.e1416. https://doi.
org/10.1016/j.cell.2020.10.051 (2020).
6. Shrock, E. et al. Viral epitope profiling of COVID-19 patients reveals cross-reactivity and correlates of severity. Science 370, 6520.
https://doi.org/10.1126/science.abd4250 (2020).
7. Vogelzang, E. H. et al. Development of a SARS-CoV-2 total antibody assay and the dynamics of antibody response over time in
hospitalized and nonhospitalized patients with COVID-19. J. Immunol. 205, 3491–3499. https://doi.org/10.4049/jimmunol.20007
67 (2020).
8. Li, K. et al. Dynamic changes in anti-SARS-CoV-2 antibodies during SARS-CoV-2 infection and recovery from COVID-19. Nat.
Commun. 11, 6044. https://doi.org/10.1038/s41467-020-19943-y (2020).
9. Takahashi, T. et al. Sex differences in immune responses that underlie COVID-19 disease outcomes. Nature 588, 315–320. https://
doi.org/10.1038/s41586-020-2700-3 (2020).
10. Dan, J. M. et al. Immunological memory to SARS-CoV-2 assessed for up to 8 months after infection. Science 371, 4063. https://
doi.org/10.1126/science.abf4063 (2021).
11. Bryan, A. et al. Performance characteristics of the Abbott architect SARS-CoV-2 IgG assay and seroprevalence in Boise, Idaho. J.
Clin. Microbiol. https://doi.org/10.1128/jcm.00941-20 (2020).
12. Joyner, M. J. et al. Safety update: COVID-19 convalescent plasma in 20,000 hospitalized patients. Mayo Clin. Proc. 95, 1888–1897.
https://doi.org/10.1016/j.mayocp.2020.06.028 (2020).
13. Robbiani, D. F. et al. Convergent antibody responses to SARS-CoV-2 in convalescent individuals. Nature 584, 437–442. https://
doi.org/10.1038/s41586-020-2456-9 (2020).
14. Sherina, N. et al. Persistence of SARS-CoV-2 specific B- and T-cell responses in convalescent COVID-19 patients 6–8 months after
the infection. Medicine https://doi.org/10.1016/j.medj.2021.02.001 (2021).
15. Isho, B. et al. Persistence of serum and saliva antibody responses to SARS-CoV-2 spike antigens in COVID-19 patients. Sci.
Immunol. 5, 5511. https://doi.org/10.1126/sciimmunol.abe5511 (2020).
16. Iyer, A. S. et al. Persistence and decay of human antibody responses to the receptor binding domain of SARS-CoV-2 spike protein
in COVID-19 patients. Sci. Immunol. 5, 0367. https://doi.org/10.1126/sciimmunol.abe0367 (2020).
17. Piccoli, L. et al. Mapping neutralizing and immunodominant sites on the SARS-CoV-2 spike receptor-binding domain by structure-
guided high-resolution serology. Cell 183, 1024-1042.e1021. https://doi.org/10.1016/j.cell.2020.09.037 (2020).
18. Sekine, T. et al. Robust T cell immunity in convalescent individuals with asymptomatic or mild COVID-19. Cell 183, 158-168.
e114. https://doi.org/10.1016/j.cell.2020.08.017 (2020).
19. Cañete, P. F. & Vinuesa, C. G. COVID-19 makes B cells forget, but T cells remember. Cell 183, 13–15. https://doi.org/10.1016/j.
cell.2020.09.013 (2020).
20. Peng, Y. et al. Broad and strong memory CD4(+) and CD8(+) T cells induced by SARS-CoV-2 in UK convalescent individuals
following COVID-19. Nat. Immunol. 21, 1336–1345. https://doi.org/10.1038/s41590-020-0782-6 (2020).
21. Grifoni, A. et al. Targets of T cell responses to SARS-CoV-2 coronavirus in humans with COVID-19 disease and unexposed
individuals. Cell 181, 1489–1501. https://doi.org/10.1016/j.cell.2020.05.015 (2020).
22. Meckiff, B. J. et al. Imbalance of regulatory and cytotoxic SARS-CoV-2-reactive CD4(+) T cells in COVID-19. Cell 183, 1340-1353.
e1316. https://doi.org/10.1016/j.cell.2020.10.001 (2020).
23. Schultheiß, C. et al. Next-generation sequencing of T and B cell receptor repertoires from COVID-19 patients showed signatures
associated with severity of disease. Immunity 53, 442-455.e444. https://doi.org/10.1016/j.immuni.2020.06.024 (2020).
24. Liu, L. et al. Potent neutralizing antibodies against multiple epitopes on SARS-CoV-2 spike. Nature 584, 450–456. https://doi.org/
10.1038/s41586-020-2571-7 (2020).
25. Barnes, C. O. et al. Structures of human antibodies bound to SARS-CoV-2 spike reveal common epitopes and recurrent features
of antibodies. Cell 182, 828-842.e816. https://doi.org/10.1016/j.cell.2020.06.025 (2020).
26. Cao, Y. et al. Potent neutralizing antibodies against SARS-CoV-2 identified by high-throughput single-cell sequencing of conva-
lescent patients’ B cells. Cell 182, 73-84.e16. https://doi.org/10.1016/j.cell.2020.05.025 (2020).
Scientific Reports | (2021) 11:16796 | https://doi.org/10.1038/s41598-021-96171-4 8
Vol:.(1234567890)www.nature.com/scientificreports/
27. Rydyznski Moderbacher, C. et al. Antigen-specific adaptive immunity to SARS-CoV-2 in acute COVID-19 and associations with
age and disease severity. Cell 183, 996–1012. https://doi.org/10.1016/j.cell.2020.09.038 (2020).
28. Bajaj, V. et al. Aging, immunity, and COVID-19: How age influences the host immune response to coronavirus infections?. Front.
Physiol. https://doi.org/10.3389/fphys.2020.571416 (2021).
29. Sette, A. & Crotty, S. Adaptive immunity to SARS-CoV-2 and COVID-19. Cell 184, 861–880. https://doi.org/10.1016/j.cell.2021.
01.007 (2021).
30. Peng, H. T., Rhind, S. G. & Beckett, A. Convalescent plasma for the prevention and treatment of COVID-19: A systematic review
and quantitative analysis. JMIR Public Health Surveill. 7, e25500. https://doi.org/10.2196/25500 (2021).
Acknowledgements
We would like to thank Brant Mittler, M.D., J.D. and Sarah Daley for assistance in the discussion and revision
of the manuscript. We are grateful to Bill Block and Jennifer Kapral from Blood Centers of America for man-
agement of the EAP convalescent plasma program. The views expressed in this article are those of the authors
and do not necessarily represent the views of the US Department of Veterans Affairs and the US Government.
Author contributions
W.X. contributed to the conception of the work, interpretation of data and manuscript preparation; M.L. and
Y.W. contributed to data analysis and interpretation, L.E.K., K.B. and N.M. contributed to data interpretation
and manuscript revision, and G.R.C. contributed to design of the work and interpretation of data. All authors
have approved the submitted version and have agreed both to be personally accountable for the author’s own
contributions and to ensure that questions related to the accuracy or integrity of any part of the work.
Funding
This study was supported by the award COVID19-8900-06 from the Clinical Service Research and Development
of the Veterans Affairs Office of Research and Development (WX) and RF1AG063913 from the NIH (WX).
The funders had no role in study design, data collection and analysis, decision to publish, or preparation of the
manuscript.
Competing interests
GRC is an employee of MRN Diagnostics and associates with Mayo Clinic Expanded Access Program (EAP) for
collection of convalescent plasma through their nonprofit blood bank Innovative Transfusion Medicine. Other
authors have declared that no competing interests exist.
Additional information
Supplementary Information The online version contains supplementary material available at https://doi.org/
10.1038/s41598-021-96171-4.
Correspondence and requests for materials should be addressed to W.X.
Reprints and permissions information is available at www.nature.com/reprints.
Publisher’s note Springer Nature remains neutral with regard to jurisdictional claims in published maps and
institutional affiliations.
Open Access This article is licensed under a Creative Commons Attribution 4.0 International
License, which permits use, sharing, adaptation, distribution and reproduction in any medium or
format, as long as you give appropriate credit to the original author(s) and the source, provide a link to the
Creative Commons licence, and indicate if changes were made. The images or other third party material in this
article are included in the article’s Creative Commons licence, unless indicated otherwise in a credit line to the
material. If material is not included in the article’s Creative Commons licence and your intended use is not
permitted by statutory regulation or exceeds the permitted use, you will need to obtain permission directly from
the copyright holder. To view a copy of this licence, visit http://creativecommons.org/licenses/by/4.0/.
© The Author(s) 2021
Scientific Reports | (2021) 11:16796 | https://doi.org/10.1038/s41598-021-96171-4 9
Vol.:(0123456789)You can also read