Long-term Care of Older Persons in Japan - SDD-SPPS PROJECT WORKING PAPERS SERIES: United Nations ...
←
→
Page content transcription
If your browser does not render page correctly, please read the page content below

SDD-SPPS PROJECT WORKING PAPERS SERIES:
LONG-TERM CARE FOR OLDER PERSONS IN ASIA AND THE PACIFIC

Long-term Care
of Older Persons
in Japan

BANGKOK, 2015
PROJECT WORKING PAPERS SERIES: LONG-TERM CARE FOR OLDER PERSONS IN ASIA AND THE PACIFIC

Acknowledgements

This paper was drafted by Reiko Hayashi, National Institute of Population and Social Security
Research in Tokyo, with comments from Srinivas Tata, Therese Bjork, and Vanessa Steinmay-
er, all with ESCAP. Karen Emmons managed the language editing.

This working paper was prepared under a research project on the rights of older persons,
funded by the Government of China. This research project aims to document schemes as well
as the emerging needs for the long-term care of older persons.

This document has been issued without formal editing.

Disclaimer

The designations employed and the presentation of the material in this publication do not
imply the expression of any opinion whatsoever on the part of the Secretariat of the United
Nations concerning the legal status of any country, territory, city or area, or of its authorities, or
concerning the delimitation of its frontiers or boundaries. The opinions, figures and estimates
set forth in this publication are the responsibility of the authors, and should not necessarily
be considered as reflecting the views or carrying the endorsement of the United Nations.

                                                                                                    2
LONG-TERM CARE FOR OLDER PERSONS IN JAPAN
Table of contents
Acknowledgements 2
List of Figures 4
List of Tables 5
1 Introduction 7
1.1 Changing population structure and ageing 7
1.2 Evolution of health and mortality 10
1.3 Living arrangements of older persons 13
2 Evolution of the older person care system in Japan 15
2.1 Family system and minimum public older person care system
in the first half of the twentieth century 15
2.2 The Act on Social Welfare for the Elderly 16
2.3 Free medical care for older persons 17
2.4 Health and Medical Services Act for the Aged 19
3 Long-term care insurance 21
3.1 Background 21
3.2 Implementation of the LTCI and its recipients 21
3.3 Financing of the LTCI 23
3.4 The structure of service, its fee and expenditure 24
4 Health and welfare frameworks for older person care 28
4.1 Composition of elderly care in the different systems 28
4.2 Health insurance and the late-stage medical care system for older persons 28
4.3 Public assistance for poverty alleviation 29
4.4 Disability protection measures 29
4.5 Care cycle and the integrated community care system 30
4.6 Fiscal sustainability: Long-term trend of care expenditure for older persons 32
5 Actors in the long-term care system 34
5.1 Family 34
5.2 Care personnel 37
5.3 Non-government organizations and civil society 41
5.4 Government and decentralization 44
5.5 Private sector 44
6 Conclusions 47
References 49
3PROJECT WORKING PAPERS SERIES: LONG-TERM CARE FOR OLDER PERSONS IN ASIA AND THE PACIFIC
List of Figures
Figure 1. Population, by broad age group and ageing rate, 1920–2060 7
Figure 2. Population of 2010 and population aged 65, 75 and older 8
Figure 3. Male and female population aged 65 or older, 2000–2015 9
Figure 4. Ageing rate jumps from 7 per cent to 14 per cent, 1850–2050 10
Figure 5. Evolution of life expectancy and ageing rate 11
Figure 6. Healthy life expectancy and unhealthy years, 2001–2013 12
Figure 7. Life expectancy and healthy (not bed-ridden) life expectancy 12
Figure 8. Living arrangement for persons aged 65 or older, 2010 14
Figure 9. Number of older persons receiving rice under the Relief Regulations, 1870–1940 15
Figure 10. Number of patients per 100,000 population, by age group 18
Figure 11. The location of death in Japan, 1951–2013 18
Figure 12. Financing of elderly medical expenses before and after the elderly health system 19
Figure 13. Number of persons certified for long-term care, by care or support level,
2000–2015 22
Figure 14. Proportion of care recipients, April 2015 22
Figure 15. Evolution of the proportion of care recipients, by age group 23
Figure 16. LTCI finance of municipality, financial year 2012 budget base (in trillion yen) 24
Figure 17. LTCI expenditure, by type of service, 2014 (in trillion yen) 27
Figure 18. Integrated community care system 30
Figure 19. Origin and destination of those who left the long-term care facility,
September 2013 31
Figure 20. Medical, welfare and long-term care expenditure per older person, 1977–2011 33
4LONG-TERM CARE FOR OLDER PERSONS IN JAPAN
Figure 21. Framework of debate on family cash allowance introduction
to long-term care insurance 34
Figure 22. Main caregiver, by relation to the person cared for, 2013 (per cent) 35
Figure 23. The co-residing caregiver, by sex, 2013 (per cent) 35
Figure 24. The co-residing caregiver, by age group and by sex, 2013 (per cent) 36
Figure 25. Number of parents needing care, by age of married women, 2013 (per cent) 37
Figure 26. Projected personnel demand for health and long-term care, 2025 38
Figure 27. Projected demand-supply gap of long-term care workers in 2025 39
Figure 28. Proportion of facilities by bodies that established them and by type of facility,
2013 (per cent) 41
Figure 29. The change of the proportion of service operators of in-home long-term care support,
by establishment (per cent) 45
Figure 30. The admission capacities of long-term care facility, by type 46
List of Tables
Table 1. Proportion of population living independently, 60 years or older (per cent) 13
Table 2. Population living in a facility, by age group, 1970–2010 14
Table 3. Seven sets of services and basic service fees in the LTCI scheme 25
Table 4. Number of entries under the Economic Partnership Agreements
with Indonesia, Philippines and Viet Nam 40
Table 5. Distribution of service operators by establishment body, by type of service, 2013
(per cent) 43
Annex Table. Facilities for the long-term care in Japan 50
5PROJECT WORKING PAPERS SERIES: LONG-TERM CARE FOR OLDER PERSONS IN ASIA AND THE PACIFIC
6LONG-TERM CARE FOR OLDER PERSONS IN JAPAN
1 Introduction
1.1 Changing population structure and ageing
Japan is the most aged society in the world. As of 2014, the proportion of the ageing
rate, defined here as the proportion of persons aged 65 or older among the total population,
was as high as 26 per cent.1 More than one in four persons in Japan is 65 years old or older.
The population of older persons is projected to increase further, reaching 40 per cent around
2060. According to the most recent census (2010), the total population is some 128 million
people, the highest number recorded in the census history. Since 2010, however, the popula-
tion has declined and is projected to continue decreasing.
The population group of persons aged 0–19 years began decreasing as of 1960, while the num-
ber of persons aged 20–64 years only started to decline in 2005. Among the older persons, the
“younger-old”—aged 65–74 years—increased and will continue to increase steadily. The most
notable increase, however, is the number of “older-old”—aged 75 years or older (see figure 1).
The number of younger-old has been increasing but will begin to decrease in 2020, whereas
the older-old will keep expanding until 2055.
FIGURE 1. POPULATION, BY BROAD AGE GROUP AND AGEING RATE, 1920–2060
140 45%
Total population= 128 million
Projection
7 9 12 14 40%
120 5 6 16
4 9 11 19
3 7 8 13 14 22 35%
93 2 6 15 23
87
100 5 17 22
2 17 22
2 4 15 23 30%
4
31 14
Population in million
24
80 31 15 24
Ageing rate
31 16 25%
23
31 74 76 16
68 71 79 79
56 63 14
60 21 46 51 56 78 75 12 20%
41 71 11
21 39 68
35 66
31 63 15%
59
40 27 54
50 46
44 41
10%
20
30 34 36 38 38 37 36 34 35 36 35 32 29 5%
26 26 24 23 22
20 18 17 16
15 14 13 12 11
0 0%
2000
2040
2060
2005
2045
2050
2020
2030
2055
2025
2035
1940
1960
1980
1990
1950
1965
1985
1995
1920
2010
1930
1955
2015
1947
1970
1975
Year
Aged 0 -19 20-64 65-74 75+ Ageing rate
Source: Statistics Bureau, ”1920 to 2010 by Population Census (Tokyo, , Ministry of Internal Affairs and Communications,
2010). National Institute of Population and Social Security Research, “2015 to 2060 by Population Projections for Japan”,
(Tokyo, 2012)..
1 The term “ageing rate” is often used in Japan, where the older population is defined as persons aged 65 years or older,
based on the World Health Organization definition. This criterion has been used since 1963, when the Act on Social Wel-
fare for the Elderly was adopted.
7PROJECT WORKING PAPERS SERIES: LONG-TERM CARE FOR OLDER PERSONS IN ASIA AND THE PACIFIC
In addition to the proportion of older persons, it is important to count the number of older
persons because it affects the care provision and infrastructure. The number of older per-
sons is affected by the population structure, especially by the baby boomers born shortly
after the Second World War. In 2010, the population pyramid (see figure 2) had a distinctive
age structure, with two peak ages, at 37 and 61, corresponding to baby boomers and junior
baby boomers (the children of baby boomers). There is a sharp increase when those baby
boomers and junior baby boomers aged, which explains the acceleration of the number of
older persons up to 2020 and 2040. Looking at the number of older-old persons, there is a
predicted sharp increase around 2025. Considering that older-old persons are more in need
of health services and long-term care than younger-old persons, preparations should begin
now to meet those needs. In contrast to the ever increasing ageing rate, the number of older
persons will stagnate after the baby boomer’s effect.
FIGURE 2. POPULATION OF 2010 AND POPULATION AGED 65, 75 AND OLDER
Population 65+, 75+: Year
2,500 45
40
2,000 35
Population 65+, 75+ in 1,000
Population of 2010 in 1,000
30
1,500
25
20
1,000
15
500 10
5
0 0
Population of 2010: Age (year of bi h)
Population of 2010 by age Population +65 Population +75
Note: The census of 2010 was conducted on 1 October 2010. The year of birth shown here is the representative (three
quarters ) of the population of each age.
Source: Statistics Bureau, “Population census and population estimate” (Tokyo, Ministry of Internal Affairs and Commu-
nications;. data for 2015: National Institute of Population and Social Security Research, “Population projections for Japan,
medium-fertility and medium-mortality assumption” (Tokyo, 2012).
Another distinctive characteristic is the feminization of the older population. With women
living longer than men, there are more women than men in the old age, especially in the
8LONG-TERM CARE FOR OLDER PERSONS IN JAPAN
older-old segment. In 2015, there were 9.9 million older-old women, 3.7 million more than
older-old men (see figure 3).
FIGURE 3. MALE AND FEMALE POPULATION AGED 65 OR OLDER, 2000–2015
35
30
9.8 9.9
9.6
9.4
25 8.5 8.8 9.1
7.9 8.2
7.6
Population in million
7.0 7.3
6.4 6.7
20 6.1
5.8 9.0 9.1
8.2 8.6
7.9 8.1 8.1 8.0
15 7.7 7.8
7.4 7.4 7.5
7.1 7.3
7.0
6.0 6.1 6.2
10 5.0 5.2 5.4 5.6 5.8
4.3 4.5 4.8
3.4 3.6 3.9 4.1
3.2
5
6.8 6.9 7.1 7.2 7.2 7.1 7.4 7.7 8.1 8.2
6.0 6.2 6.3 6.4 6.4 6.6
0
2000 2001 2002 2003 2004 2005 2006 2007 2008 2009 2010 2011 2012 2013 2014 2015
Male 65 -74 Male 75+ Female 65-74 Female 75+
Source: Statistics Bureau, “Population estimates” (Tokyo, Ministry of Internal Affairs and Communications).
The ageing of Japan’s population occurred quickly. In 1970, the ageing rate exceeded 7 per
cent, the threshold which used to be considered as the onset of population ageing. It took
only 26 years before the ageing rate reached 14 per cent, the threshold of an aged population.
Considering that it took France 115 years or the United States 69 years for their ageing rates
to go from 7 per cent to 14 per cent, Japan’s case is one of the quickest in the world (see figure
4). However, the emerging countries such as the Republic of Korea and Thailand will have an
even shorter period for this transition.
9PROJECT WORKING PAPERS SERIES: LONG-TERM CARE FOR OLDER PERSONS IN ASIA AND THE PACIFIC
FIGURE 4. AGEING RATE JUMPS FROM 7 PER CENT TO 14 PER CENT, 1850–2050
France 1865 115 1980
Sweden 1890 85 1975
Australia 1938 73 2011
United States 1944 69 2013
Canada 1944 65 2009
Hungary 1941 53 1994
Spain 1947 45 1992
United Kingdom 1930 45 1975
Poland 1966 45 2011
Japan 1970 26 1996
Azerbaijan 2004 33 2037
Chile 1998 27 2025
China 2000 26 2026
Sri Lanka 2002 24 2026
By projection
Tunisia 2008 24 2032
Thailand 2002 22 2024
Brazil 2011 21 2032
Colombia 2017 19 2036
Singapore 2000 19 2019
Republic of Korea 2000 18 2018
1850 1900 1950 2000 2050
Year
Note: The number of the left of the bar designates the year when the ageing rate attained 7 per cent; the number on
the right of the bar designates the year when the ageing rate attained 14 per cent. The number in the middle of the bar
designates the years required for the ageing rate to change from 7 per cent to 14 per cent.
Source: Keven Kinsella and Wan He, (2009). An Aging World: 2008 (Washington, D.C., US Census Bureau, 2009).
1.2 Evolution of health and mortality
Decline of infant mortality and maternal mortality began around 1920; following the con-
tainment of tuberculosis in the 1950s, chronic diseases, such as cerebrovascular diseases,
malignant neoplasms and heart diseases, emerged as the three major causes of death in
Japan. This epidemiological transition, from infectious diseases to chronic diseases, corre-
sponds with the trend in life expectancy and the ageing rate (see figure 5). An almost vertical
increase of life expectancy around 1950 is attributed to the elimination of tuberculosis. Since
the epidemiologic transition, the increase is more stable. The ageing rate was almost stagnant
before the transition but very sharp after the transition.
10LONG-TERM CARE FOR OLDER PERSONS IN JAPAN
FIGURE 5. EVOLUTION OF LIFE EXPECTANCY AND AGEING RATE
90 40
85
35
80
30
Life expectancy (years)
75
Ageing rate (per cent)
25
70
65 20
60
15
55
10
50
5
45
40 0
1870 1880 1890 1900 1910 1920 1930 1940 1950 1960 1970 1980 1990 2000 2010 2020
Life expectancy Ageing rate Year
Source: Life expectancy up to 1935: Statistics and Information Department, “Life table” (Tokyo, Ministry of Health, Labour
and Welfare); from 1947: National Institute of Population and Social Security Research, “Japanese mortality database”
(Tokyo); Statistics Bureau, “Aging rate” (Tokyo, Ministry of Internal Affairs and Communications).
As for the healthy life expectancy, due to the different definition of health and methods used,
there are several different sets of data. According to the Global Burden of Disease Study, the
healthy life expectancy in Japan is the longest in the world (of 187 countries) in both 1990
and 2010 (Salomon 2012). It was 67.7 years for men and 72.3 years for women in 1990,
which increased to 70.6 years for men and to 75.5 years for women in 2010.
The Japanese official statistics define healthy life expectancy as “health without activity lim-
itation caused by a health condition” and this figure has been increasing along with time
since 2001. The increase of life expectancy is, on average, 0.2 for women and 0.1 years for
men per year during this period. Women live longer, but they also have more unhealthy years
than men. In 2013, women lived 12.4 unhealthy years, whereas men lived 9 years (see figure
6). However, as women live longer, the healthy life expectancy of women stood at 74.2 years
in 2013 - longer than that of men’s, which stood at 71.2years.
11PROJECT WORKING PAPERS SERIES: LONG-TERM CARE FOR OLDER PERSONS IN ASIA AND THE PACIFIC
FIGURE 6. HEALTHY LIFE EXPECTANCY AND UNHEALTHY YEARS, 2001–2013
Healthy life expectancy (years)
2001 72.65 12.28 (84.93)
Unhealthy years
2004 72.69 12.90 (85.59)
(Life expectancy)
Female
2007 73.36 12.63 (85.99)
2010 73.62 12.68 (86.30)
2013 74.21 12.40 (86.61)
2001 69.40 8.67 (78.07)
2004 69.47 9.17 (78.64)
Male
2007 70.33 8.86 (79.19)
2010 70.42 9.13 (79.55)
2013 71.19 9.02 (80.21)
0 10 20 30 40 50 60 70 80 90 100
Source: Ministry of Health, Labour and Welfare, Health Japan 21 (the second term) progress of each objective. Available
from , www.mhlw.go.jp/file/05-Shingikai-10601000-Daijinkanboukouseikagakuka-Kouseikagakuka/sinntyoku.pdf.
Another data on healthy life expectancy use bed-ridden rate, which is available for longer
time span since 1970s. The healthy, non-bed-ridden life expectancy increased almost in par-
allel with life expectancy (see figure 7).
FIGURE 7. LIFE EXPECTANCY AND HEALTHY (NOT BED-RIDDEN) LIFE EXPECTANCY
88
Female life expectancy
86
84
Female healthy
life expectancy
82
Life expectancy (years)
80
Male life expectancy
78
Male healthy
76 life expectancy
74
72
70
1975 1980 1985 1990 1995 2000 2005 2010 2015
Year
Note: The healthy life expectancy is adjusted by population in the facility, assuming that all persons are bed-ridden.
Source: Reiko Hayashi, “Examination of bed-ridden rate and the evolution of healthy life expectancy: The trend in Japan
since 1970s”. Research Report 57 (2015), pp. 43–59. Bed-ridden rate for 1978, 1981 and 1984: Comprehensive Survey of
Welfare Administration, “Comprehensive Survey of Living Conditions, Statistics (Tokyo, Information Department, Ministry
of Health, Labour and Welfare).
12LONG-TERM CARE FOR OLDER PERSONS IN JAPAN
1.3 Living arrangements of older persons
In 2010, almost half of the older persons in Japan lived independently of their children—alone
or with a spouse. This rate is much lower than in Germany, the United Kingdom, France or
the United States. This is probably caused by the cultural norm that family takes care of older
persons. This proportion is around the same level as what is found in Italy and larger than in
developing countries, such as China, India or Thailand (see table 1).
TABLE 1. PROPORTION OF POPULATION LIVING INDEPENDENTLY, 60 YEARS OR OLDER (PER CENT)
Male Female Year
Germany 91.5 88.7 2005 or later
United Kingdom 84.1 82.5 2005 or later
France 82.0 83.5 2005 or later
United States 76.8 73.8 2005 or later
Italy 57.1 61.6 2004 or earlier
Japan 51.5 46.9 2010
China 39.7 34.1 2005 or later
Thailand 21.3 16.8 2004 or earlier
India 17.3 15.8 2005 or later
Source: Japan: Population Census 2010; all other countries: United Nations Department of Economic and Social Affairs,
Population Ageing and Development 2012 (New York, 2012).
Along with the population ageing, there has been a dramatic change in the living arrangement
of older persons in Japan. In 1970, as much as 80 per cent of persons aged 65 years or older
lived with their children, family members or other kin. Older persons living alone accounted
for only 6 per cent, and those with a spouse amounted to 12 per cent. That proportion began
reversing over time; now, more older persons live alone or only with their spouse (see figure
8). The cultural norm of Japanese society that the eldest son lives with his parents, while
older persons are taken care of by the daughter-in-law, is becoming less and less prevalent.
Older persons who lived in a facility amounted to 2 per cent in 1970; that figure tripled to 6
per cent in 2010, when 4.1 per cent lived in a long-term care facility and 1.5 per cent in a hos-
pital.2 Although the overall proportion is small, the speed of increase was rapid. Considering
the sharp increase in the total number of older persons, the number of older persons living
in a facility increased eightfold, from 200,000 in 1970 to 1.67 million in 2010. If observed
by the five-year age group, the proportion of older persons who were in a facility has been
decreasing since 1980 for the younger-old (65–69 years), since 1990 for persons aged 70–74
years and since 2000 for persons aged 75–84 years. Only the oldest-old (aged 85 or older)
2 In Japan, the place of residence is defined as the place where someone resides in for more than three months.
13PROJECT WORKING PAPERS SERIES: LONG-TERM CARE FOR OLDER PERSONS IN ASIA AND THE PACIFIC
among the facility population showed a monotonic increase up to 2010 (see table 2). There
are potentially two reasons for that: The first optimistic reason is that younger-old have not
needed to stay in a facility in recent years because they are healthier than before. The other,
pessimistic, reason is that there is not enough capacity in facilities and only the very disabled
oldest-old can be accepted.
FIGURE 8. LIVING ARRANGEMENT FOR PERSONS AGED 65 OR OLDER, 2010
100% 3% 3% 4% 4% 4% 4% 5% 5% 6%
80%
51% 47% 44%
61% 56%
60% 70% 66%
80% 75%
40%
33% 34%
31%
24% 28%
20% 18% 21%
15%
12% 16%
10% 11% 12% 14% 15%
5% 7% 8%
0%
1970 1975 1980 1985 1990 1995 2000 2005 2010
At home alone At home with spouse At home with children/family /other In facility
Source: Statistics Bureau, “Population census”, compiled by the National Institute of Population and Social Security
Research in “Population statistics”, (Tokyo, 2011)
TABLE 2. POPULATION LIVING IN A FACILITY, BY AGE GROUP, 1970–2010
People living in a facility
1970 1980 1990 2000 2010
Age group 65–69 71 245 73 167 83 228 106 279 114 600
70–74 57 055 93 545 103 263 129 007 146 923
75–79 40 080 97 390 144 170 171 290 232 494
80–84 23 005 72 312 152 488 214 216 349 052
85+ 11 225 44 459 156 957 403 199 824 792
65+ 202 610 380 873 640 106 1 023 991 1 667 861
Percentage of age group living in a facility
Age group 65–69 1.9% 1.8% 1.6% 1.5% 1.4%
70–74 2.2% 3.1% 2.7% 2.2% 2.1%
75–79 2.7% 4.8% 4.8% 4.1% 3.9%
80–84 3.2% 6.6% 8.3% 8.2% 8.0%
85+ 3.5% 8.4% 14.0% 18.0% 21.7%
65+ 2.8% 3.6% 4.3% 4.6% 5.7%
Note: The percentage is the proportion of people in the facility among the total population of each age group.
Source: Statistics Bureau, “Population census” (1970 to 2010) compiled by author. 14LONG-TERM CARE FOR OLDER PERSONS IN JAPAN
2 E
volution of the older person care system
in Japan
2.1 Family system and minimum public older person care system
in the first half of the twentieth century
The cultural norm that the eldest son succeeds the family (i.e., in Japan) and his
wife take care of his parents was institutionalized by the Civil Code of 1898. The
public welfare system stepped in to take care of older persons without any family who became
poor and/or frail. The first public welfare legislation that covered older persons was promul-
gated in 1872 as the Relief Regulations, which entitled very poor or sick single persons aged
70 years or older to a specified portion of rice, which was the equivalent of 325 litres yearly.
Until 1940, recipients of this aid numbered in the thousands, with fluctuations according to
different circumstances (see figure 9).
FIGURE 9. NUMBER OF OLDER PERSONS RECEIVING RICE UNDER THE RELIEF REGULATIONS, 1870–
1940
7,000
6,000
Number of elderly relieved (person)
5,000
4,000
3,000
2,000
1,000
0
1870 1880 1890 1900 1910 1920 1930 1940
Year
Source: Cabinet Bureau of Statistics, Statistical Yearbook of the Empire of Japan in Historical statistics of Japan,
(Statistics Bureau and Japan Statistical Association, 1988).
15PROJECT WORKING PAPERS SERIES: LONG-TERM CARE FOR OLDER PERSONS IN ASIA AND THE PACIFIC
In 1929, the Relief Law was adopted, covering frail persons aged 65 or older who became
physically weak and were unable to live on their own due to poverty. At that time, municipal
governments and social work organizations began setting up aid facilities, including older
person homes, upon approval of the prefecture governor.
After the end of the Second World War, with a strong instruction from the Supreme Com-
mander for the Allied Powers (General Head Quarter : GHQ), the Public Assistance Act was
enacted in 1946, which was revised soon after in 1950 following the promulgation of the new
Constitution. At that time, the existing elderly homes were renamed as Elderly Facilities and a
government subsidy to them was initiated. In 1954, there were 424 facilities housing 23,021
older persons (Health and Welfare Statistics Association, 1955). In addition to the protection
of poor older persons at home, the facility-based welfare system for older persons emerged.
2.2 The Act on Social Welfare for the Elderly
After the Diet approved the National Health Insurance Act in 1958 and the National Pension
Act in 1959, Japan achieved universal coverage on health and pensions in 1961. The univer-
sal coverage stimulated public support for the welfare of older persons, both in social welfare
and health perspectives, which led to enactment of the Act on Social Welfare for the Elderly
in 1963.
The Act on Social Welfare for the Elderly was considered the first of its kind in the world. In
1962, the ruling Liberal Democratic Party included the proposed legislation in its manifesto
and won the elections. As a result, the Act came into effect already in August 1963.
Prior to that law, several prototype measures were created by local governments. In 1956,
Nagano Prefecture began a programme in which a “family helper” was dispatched to elderly
households. Kuji city, among others, began offering cash support to older-old persons in need.
Some municipalities and non-profit organizations opened fee-based homes for older persons.
The Ministry of Health and Welfare began supporting these measures in 1962.
The new law of 1963 established the basic philosophy that older persons should be guar-
anteed a healthy and secure life because they had contributed to the development of the
country. The Act stipulated such measures for older persons as health check-ups and access
to a home helper. The Elderly Facilities administered under the Public Assistance Act were,
again, renamed as Care Facility for the Elderly (Yougo). Additionally, the Intensive Care Home
for the Elderly (Tokuyou) was created for older persons who need medical care (see annex
table 1). During this period, awareness population ageing increased; particularly, the large
number of bed-ridden older persons had to be addressed.
In 1968, the Japan National Council of Social Welfare survey found 191,352 bed-ridden older
persons (78,404 men and 112,948 women), representing a prevalence of 5.2 per cent. A strong
sense of responsibility for the care of bed-ridden older persons was strongly felt, which led
to development of the Tokuyou facility. While the Yougo accommodated persons who were
16LONG-TERM CARE FOR OLDER PERSONS IN JAPAN
impoverished, the Tokuyou offered more long-term care and reflected a change in philosophy
to offer assistance based on disability rather than poverty. Construction was rapid and the
number of Tokuyou increased seventeenfold, from 27 in 1965 to 451 in 1974.
2.3 Free medical care for older persons
Even though health insurance coverage became universal in 1961, it was only in terms of
the number of persons. The scheme involved co-payment. Older persons still paid from 30
per cent to 50 per cent of medical care costs, which substantially limited many from receiv-
ing appropriate care. This situation was a product of the multiple health insurance system
in which older persons covered by the National Health Insurance scheme upon retirement
or becoming the dependant to an employee (typically a working son covered by employee
health insurance) and thus required to make a higher co-payment. This disparity caused pub-
lic remorse and a better scheme for older persons was demanded.
The prefectural provision of reimbursement for out-of-pocket payments was integrated in
1973 into the national system and called the Elderly Medical Fee Payment System, which
was stipulated in the Act for Partial Revision of the Act for the Social Welfare for the Elderly.
In this set-up, persons aged 70 or older who did not have taxable income or whose guardian’s
income was less than 2.5 million yen per year were exempted from the co-payment require-
ment, which was instead covered by the national, prefectural and municipal subsidies, at two
thirds, one sixth and one sixth, respectively. In the same year, the High-cost Medical Expenses
Payment System was put in place. These systems enhanced access to care, taking the country
to real universal coverage of health insurance.
The number of older patients in hospitals increased sharply during the 1970s (see figure 10).
Hospitals became a place where not-so-sick older persons would check in to meet friends for
social purposes. There was even a joke that older persons in the hospital greeted each other
by saying, “How are you doing today?” To which, the reply came, “I am very fine and healthy,
thank you”. There was no economic obligation for older persons to need care when checking
into hospital.
17PROJECT WORKING PAPERS SERIES: LONG-TERM CARE FOR OLDER PERSONS IN ASIA AND THE PACIFIC
FIGURE 10. NUMBER OF PATIENTS PER 100,000 POPULATION, BY AGE GROUP
25,000
Number of patient per 100,000 population
20,000 Age 0
1 -4
5-14
15,000
15 -24
25 -34
10,000 35 -44
45 -54
55 -64
5,000
65 -74
75+
0
1940 1950 1960 1970 1980 1990 2000 2010 2020
Year
Note: Number of patients is the sum of out-patients and in-patients during one day of the survey.
Source: Ministry of Health, Labour and Welfare, “Patient survey” (Tokyo, 2012).
The expansion of provision of care also gave rise to the “elderly hospital” where many elderly
patients stayed bed-ridden who needed care but not necessarily costly medical treatment. The
care for older persons became heavily hospitalized in the final phase of their lives. In 1976,
the number of deaths at hospital exceeded the number of deaths at home for the first time in
Japanese history (see figure 11).
FIGURE 11. THE LOCATION OF DEATH IN JAPAN, 1951–2013
90%
80%
70%
60%
50%
40%
30%
20%
10%
0%
1950 1960 1970 1980 1990 2000 2010
Hospital Facility Home Other
Source: Ministry of Health Labour and Welfare, “Vital statistics” (Tokyo, 2010).
18LONG-TERM CARE FOR OLDER PERSONS IN JAPAN
2.4 Health and Medical Services Act for the Aged
The increasing number of older persons and soaring medical expenditure urged a radical re-
structuring of the health finance system. A structural problem emerged at the same time. Based
on the health insurance systems, most older persons entered the National Health Insurance
upon their work retirement, switching from their employer-provided health insurance. Hence,
a concentration of older persons developed in the National Health Insurance scheme.
The Commission on Long-term Planning of Social Security within the Ministry of Health and
Welfare submitted a report in 1975 highlighting the need to introduce partial co-payment to
raise awareness of the cost of health and the adjustment between different health insurance
schemes. It was followed by many other decisions and reports of the minister, commissions
and councils and, finally, the legislation of Health and Medical Services Act for the Aged came
into effect in 1983. The Elderly Health System created by this Act introduced the co-payment
of older persons and shared financing of medical expenses for older persons by the national,
prefectural and municipal governments as well as insurers along with health education and
prevention activities mandated to municipal governments (see figure 12).
FIGURE 12. FINANCING OF ELDERLY MEDICAL EXPENSES BEFORE AND AFTER THE ELDERLY HEALTH
SYSTEM
Owned by insurers Government
82% 18%
Employer-based health insurance
National Govt
Before
Local Govt
National health insurance
Owned by insurers Government
70% 30%
Employer-based
health insurance Employer-based
National Govt
health insurance
A er
Local Govt
National National
health insurance health insurance
50% 50%
By the number Adjusted by the
of insured elderly national average
of elderly
Source: Health and Welfare Statistics Association, Journal of Health and Welfare Statistics (Tokyo, 1985).
19PROJECT WORKING PAPERS SERIES: LONG-TERM CARE FOR OLDER PERSONS IN ASIA AND THE PACIFIC
A need for a facility with services in between the Elderly Hospital on the medical side and the
Tokuyo on the welfare side became evident. The Health and Medical Services Act was revised
in 1987 to include provision for the Elderly Health Facility (Rouken). The Rouken involved
more medical staff than the Tokuyou but fewer than the Elderly Hospital. Patients were
charged a monthly co-payment of around 60,000 yen. The management receive 252,240 yen
(in 1992) per patient per month from a combination of the insurers’ contribution (one half ),
national subsidy (one third) and municipal government subsidy (one sixth).
These three categories of facilities, namely Elderly Hospital, Rouken and Tokuyou have been
the basic framework of older persons care facility in Japan even after the introduction of LTCI
(for the different types of facilities for older persons, refer to annex table 1).
20LONG-TERM CARE FOR OLDER PERSONS IN JAPAN
3 Long-term care insurance
3.1 Background
The Long-Term Care Insurance Act was promulgated in December 1997 and two
years later (in 2000), the Long-Term Care Insurance (LTCI) scheme was introduced.
LTCI integrated the previously separate health insurance schemes and public welfare system.
The insurer of the LTCI is the municipality government.
Eligibility begins at age 40 years. LTCI premium is deducted from the salary in addition to the
health insurance premium, or deducted from the pension. There are two tiers of coverage: the
primary insured for people aged 65 years or older and the secondary insured for persons aged
40 to 64 years. The primary insured are eligible to receive care whenever they have a need,
while the secondary insured are eligible for care only for certain diseases, such as dementia,
cerebrovascular diseases and articular rheumatism.
Upon the request for care by an insured person, the certification of need is conducted through
a computerized screening process, followed by a committee created within the municipality,
which reviews the opinion letter of home doctor and other relevant documents. Once certi-
fied, the eligible person can request the care-manager to elaborate his/her care plan, based on
which he/she would receive appropriate and needed care.
The certified need is classified as support level 1 and 2, care level 1, 2, 3, 4 and 5, according to
the severity of the condition. The important characteristic of the LTCI is that once certified, a
person has a choice of services. According to the support or care level, a care plan is developed
by a care manager to allocate appropriate services. The service options available are home
care, short stay and long stay at a facility or group home, with needed equipment rented and
purchased.
3.2 Implementation of the LTCI and its recipients
Since 2000 when the scheme was introduced, the number of certified persons in every sup-
port and care level has increased, from 2.2 million persons to 6.1 million in 2015 (see figure
13).
Not surprisingly, care needs increase sharply according to the age. In 2015, only 3 per cent
of the younger-old persons (aged 65–74) received long-term care, whereas 27 per cent of
older-old (aged 75 or older) received it. Almost half of the women aged 85–89 and men aged
90–94 received long-term care (see figure 14). The increase of the population of older-old who
need more care than younger-old persons is a strong reason for the increasing number of care
recipients in the LTCI scheme.
21PROJECT WORKING PAPERS SERIES: LONG-TERM CARE FOR OLDER PERSONS IN ASIA AND THE PACIFIC
FIGURE 13. NUMBER OF PERSONS CERTIFIED FOR LONG-TERM CARE, BY CARE OR SUPPORT LEVEL,
2000–2015
7,000
6077
6,000 5859
5643 604
5330 605
5076 612
4870 730
5,000 4690 609 Care5
711
Persons in thousannds
4548 593 696
4348 4408 515
564 Care4
4108 500 670 793
4,000
3874 465 489 641 769 Care3
465 579 590 630 747
3484 455 525 547 724
700 Care2
1,062
3029 414 479 497 738 713 1,029
561 652 711 993 Care1
3,000
2582 381 424 492 527 952
901 Transitional
2180 341 394 431 651 823 854
614 756 806 1,176 Suppo 2
2,000 290 365 394 595 1,052 1,115
641 970
339 358 852 910 Suppo 1
571 1,387 876 769 788
317 490
1,252 1,332 806 839
1,000 394 1,070 40 1 712 771
654 669
709
891 522 629 662
551
601 674
655
552 575 604 662 692 773 825 874
291 320 398 505 45 527
0 59
2000 2001 2002 2003 2004 2005 2006 2007 2008 2009 2010 2011 2012 2013 2014 2015
Note: From 2000 to 2005, the support level had only one level. The number of persons is for April of each year.
Source: Ministry of Health, Labour and Welfare, “Monthly report on the status of long-term care Insurance”, (Tokyo).
FIGURE 14. PROPORTION OF CARE RECIPIENTS, APRIL 2015
90%
80%
70%
60%
50%
40%
30%
20%
10%
0%
40 64 65 69 70 74 75 79 80 84 85 89 90 94 95 and
over
Male Female Both sexes Age
Source: Ministry of Health, Labour and Welfare, “Survey of long-term care benefit expenditures” (Tokyo, 2015).
22LONG-TERM CARE FOR OLDER PERSONS IN JAPAN
The age-specific LTCI utilization has been stable. From the launch in 2000, the proportion
increased up to 2004 then almost stagnated for all age groups except among persons aged 90
years or older (see figure 15). That first spurt up to 2004 might be attributed to the gradual
expansion and recognition of the LTCI scheme. The increase of the proportion for the age
group of 90 or older is primarily due to the increase of extremely old persons, such as cente-
narians.
FIGURE 15. EVOLUTION OF THE PROPORTION OF CARE RECIPIENTS, BY AGE GROUP
70%
60%
90 or over
50%
85 89
40% 80 84
75 79
30%
70 74
20%
65 69
10% 40 64
0%
2001 2002 2003 2004 2005 2006 2007 2008 2009 2010 2011 2012 2013 2014 2015
Source: Ministry of Health, Labour and Welfare, “Survey of long-term care benefit expenditures” (Tokyo, 2015).
3.3 Financing of the LTCI
As already explained, LTCI is a social insurance system financed by national, prefectural and
municipal governments’ subsidies, with premium paid by the insured and co-payment by
users. The proportion of these three components is fixed: The co-payment is 10 per cent,
which is paid by the care recipient to the care provider. Half of the remaining cost is financed
by the premium and the other half by the subsidy, which is paid by the municipality (the
LTCI operator) to the care provider. National, prefectural and municipal subsidy shares are 50
per cent, 25 per cent and 25 per cent for in-home services and 40 per cent, 35 per cent and 25
per cent for facility services, respectively.
In 2012, the largest share of the LTCI financing came from the premium paid by the sec-
ondary insured users, which amounted to nearly 2.4 trillion yen (29 per cent). The premium
paid by the primary insured users amounted 1.7 trillion yen (21 per cent), followed by the
national governmental subsidy of nearly 1.5 trillion yen (18 per cent) (see figure 16).
23PROJECT WORKING PAPERS SERIES: LONG-TERM CARE FOR OLDER PERSONS IN ASIA AND THE PACIFIC
FIGURE 16. LTCI FINANCE OF MUNICIPALITY, FINANCIAL YEAR 2012 BUDGET BASE (IN TRILLION
YEN)
Municipal
government
Premium of
subsidy
12% primary
insured
Prefectural 21%
government
subsidy
15%
Premium of
secondary
National government insured
subsidy 29%
18%
National
government
adjustment
subsidy
5%
Source: Health, Labour and Welfare Statistics Association, Journal of Health and Welfare Statistics (Tokyo, 2012).
The primary insured (aged 65 or older) user’s premium is deducted from their pension
payment and deducted from monthly salary in case of the secondary insured (aged 40–64)
user, in addition to the health insurance premium. Both are means tested: The amount of
premium depends on each user’s income level. The premium is set every three years by each
municipal government, which is the insurer. Due to the imbalance of distribution of older
persons between municipalities, 5 per cent of a national subsidy is used to fill the gap be-
tween the municipalities. A Finance Stabilizing Funds was created at the prefecture level to
cover unforeseeable expenditure caused by catastrophic care payments or unpaid premiums.
The increasing expenditure of LTCI inevitably increases the amount of premium. The na-
tional average premium was 2,911 yen per month for the period of 2000–2002 and then
increased to 3,293 yen (2003–2005), 4,090 yen (2006–2008), 4,160 yen (2009–2011) and
4,972 yen (2012–2014).
3.4 The structure of service, its fee and expenditure
The Government regulates the LTCI fee for services. Basic lists are elaborated by the Social
Security Council Subcommittee for Long-Term Care Benefit Expense. There are seven sets,
24LONG-TERM CARE FOR OLDER PERSONS IN JAPAN
each of which is defined in the form of a notification by the Ministry of Health, Labour and
Welfare that determines the unit price of each service. Each unit price is then multiplied
by 10 yen and a coefficient, according to the geographical region and type of service. Eight
regions are classified according to the level of price in each location, which is based on the
classification used to calculate civil servants salaries. For example, the 23 wards in Tokyo
make up region 1, which has the highest coefficient, followed by region 2, which encompass-
es 21 cities, such as Yokohama or Osaka.
There are four types of service, based on the proportion of labour cost. The higher labour cost
services, such as home-visit long-term care or home-visit nursing, has the highest coefficient,
at 70 per cent. This coefficient was introduced to increase the salary of care workers and
improve their working conditions. The coefficient thus obtained by region and type of care
ranges from 1 to 1.14, and one unit fee ranges from 10 yen to 11.40 yen.
Table 3 shows the services defined in the seven sets. The basic service fees are further mod-
ified according to the length of service and other factors. The insurer pays 90 per cent of the
fee to the service provider, and 10 per cent of the fee is paid directly by user to the service
provider as the co-payment.
TABLE 3. SEVEN SETS OF SERVICES AND BASIC SERVICE FEES IN THE LTCI SCHEME
A In-home services
Home-visit 1 Home-visit long-term care (home help service): 165–564 units, according to the time required
services
2 Home-visit bathing long-term care: 1,234 units
3 Home-visit nursing: 262–1,117 units according to the time required and type of service centre
4 Home-visit rehabilitation: 302 units
5 Guidance for management of in-home medical long-term care: 262 to 553 units, according to the category of
health professional and number of service within a building
Commuting 6 Outpatient day long-term care (day service): 364 to 1,511 units, according to the care level, the duration of
services service and the size of service centre
7 Outpatient rehabilitation: 316 to 1,299 units according to the care level, the duration of service and the size of
service centre
Short-stay 8 Short-term admission for daily life long-term care (short-stay): 579–921 units per day, according to the care
services level and the type of service centre
9 Short-term admission for recuperation: 673 to 1,399 per day, according to the care level, the type of room and
the type of facility
Other 10 Daily life long-term care admitted to a specified facility: 533–798, according to the care level, the type of room
services and type of facility
11 Rental service of equipment for long-term care
B In-home long-term care support
313–1,353 units per month per person, according to the care level and number of persons receiving care support
25PROJECT WORKING PAPERS SERIES: LONG-TERM CARE FOR OLDER PERSONS IN ASIA AND THE PACIFIC
C Community-based services
1 Regular visiting or on-demand response long-term care: 5,658–29,399 units per month, according to care level
and type of service
2 Home-visit at night for long-term care: 981 units per month, 368 units per regular visit and 560 or 754 units per
visit by request, according to the type of service
3 Outpatient long-term care for a dementia patient: 270–1,414 units, according to the care level, time required
and type of facility
4 Multifunctional long-term care in a small group home: 9,298 –26,849 units per month according to the care
level
5 Communal daily long-term care for a dementia patient (group home): 747–880 units per day according to the
care level and duration of utilization
6 Daily life long-term care for a person admitted to a community-based specified facility: 533–798 units per day,
according to the care level and duration of utilization
7 Admission to a community-based facility for preventive daily long-term care of the older persons covered by
public aid: 547–1,022 per day, according to the care level and the type of facility
8 Combined service: 11,119 –31,141 units per month, according to the care level
D Facility services
1 Facility covered by public aid providing long-term care to the elderly: 547–1,022 per day, according to the care
level and type of facility
2 Long-term care health facility: 695–1,297 per day, according to the care level, type of facility, type of room and
level of criteria
3 Sanatorium Medical Facility for older persons requiring long-term care: 641–1,251 per day, according to the care
level and type of room
E Preventive long-term care services
Home-visit 1 Home-visit service for preventive long-term care (home help service): 1,168–3 704 units per month, according
services to the care plan
2 Home-visit bathing service for preventive long-term care: 834 units
3 Home-visit nursing service for preventive long-term care: 262–1,117 units, according to the time required and
type of service centre
4 Home-visit rehabilitation service for preventive long-term care: 302 units
5 Management and guidance for of in-home medical long-term care: 262–553 units, according to the category of
health professional and number of service within a building
Commuting 6 Outpatient preventive long-term care (day service): 1,647 units for support level 1 and 3,377 units for support
services level 2 per month
7 Outpatient rehabilitation for preventive long-term care: 1,812 units for support level 1 and 3,715 units for
support level 2 per month
Short-stay 8 Short-term admission for daily preventive long-term care (short-stay): 433–655 units per day, according to the
services support level and the type of service centre
9 Short-term admission for recuperation for preventive long-term care: 575–817 per day, according to the support
level, the type of room and the type of facility
Other 10 Daily preventive long-term care admitted to a specified facility: 476–790 units, according to the support level,
services the type of room and type of facility
11 Equipment rental for preventive long-term care
F Preventive long-term care support
414 units per month
G Community-based services for preventive long-term care
1 Preventive long-term care for a dementia outpatient: 251–952 units, according to the support level, time
required and type of facility
2 Multifunctional long-term care in a small group home: 3,066–6,877 units per month, according to the support
level and type
3 Communal daily long-term care for a dementia patient (group home): 743–783 units per day, according to the
type of facility and the duration of utilization
Note: There are various additional fees.
Source: Notifications of Ministry of Health, Labour and Welfare.
26LONG-TERM CARE FOR OLDER PERSONS IN JAPAN
In 2014, the LTCI expenditure totalled 9.3 trillion yen; the biggest share was 4.1 trillion yen,
or 44.1 per cent of total expenditure, for in-home services, followed by 3.2 trillion yen, or 34.3
per cent, for facility services. The three categories of preventive services cost 0.5 trillion yen,
corresponding to 5.8 per cent of total expenditure (see figure 17).
FIGURE 17. LTCI EXPENDITURE, BY TYPE OF SERVICE, 2014 (IN TRILLION YEN)
In-home
Community-based services,
services for 4.106
In-home
preventive
long-term care
long-term care,
suppo , 0.402
0.010
Preventive
long-term Community-based
Facility
care suppo , services, 1.063
services,
0.055
3.192
Preventive
long-term
care services,
0.476
Source: Ministry of Health, Labour and Welfare, “Survey of long-term care benefit expenditures” (Tokyo, 2015).
27PROJECT WORKING PAPERS SERIES: LONG-TERM CARE FOR OLDER PERSONS IN ASIA AND THE PACIFIC
4 H
ealth and welfare frameworks for
older person care
4.1 Composition of elderly care in the different systems
Even though the LTCI assures the provision of long term care, it is not a single sys-
tem to assure the care for the older persons. As we have seen in the previous section,
firstly, the welfare system intervened to take care of older persons who were not taken care of
by the family and who did not have adequate financial means. Then the health care system
emerged and universal health coverage was subsequently achieved. The introduction of the
LTCI in 2000 was a solution to reorganize the intertwined complex system of welfare and
health systems that provided care of older persons. The change in systems was also in line
with changing needs of the population.
At present, in 2012, LTCI expenditure was 8.3 trillion yen, much smaller than the health
care expenditure of 22.1 trillion yen, for persons aged 65 years or older. The welfare system
still finances older person facilities, such as Yougo or the Moderate-fee Home for the Elderly.
The public assistance programme currently covers 832,511 persons, or 2.7 per cent of the
older person population, with free medical care as well as cash assistance.3 It also covers the
disability programme, which has 3 million older person users (Ministry of Health, Labour
and Welfare, 2014).
The complexity of these systems reflects the multidimensional nature of older person care.
Each system has its origin and a role in the social security system. Before reforms are under-
taken, it is important to study the system in detail to identify areas for improvement and
better harmonizing of the different components.
4.2 Health insurance and the late-stage medical care system
for older persons
When the LTCI was launched in 2000, some components that had been financed by the
health insurance were transferred to the LTCI. For example, the Elderly Health Facility that
was covered by the health budget was renamed as Long-term Care Health Facility (but still
referred to as Rouken) and financed through the LTCI. The Elderly Hospital, operating since
the 1970s, was heavily criticized for its geriatric beds because they were wasting medical
resources and making profit only for the hospital owners. Thus, the long-term care beds in
the Elderly Hospital were partly transferred to be financed through the LTCI and a smaller
reimbursement was granted.
3 Ministry of Health, Labour and Welfare, “National Survey on Public Assistance Recipients” (Tokyo, 2014).
28LONG-TERM CARE FOR OLDER PERSONS IN JAPAN
In 2008, the Elderly Health System was replaced by the Late-stage Medical Care System for
the Elderly by the Act on Assurance of Medical Care for Elderly People. All persons aged 75
or older and persons aged 65–74 who have been certified disabled moved into the system op-
erated by the Association of Medical Care Services for Older Senior Citizens, created in every
prefecture with all the municipalities as the composing member. The system is financed by
10 per cent co-payment and the half of remaining by national and local governments and the
other half by the insurance premium.
4.3 Public assistance for poverty alleviation
The poverty rate of older persons is increasing in Japan. Nearly 3 per cent of the older pop-
ulation receives public assistance as a poverty alleviation measure, financed entirely by tax.
The public assistance is based on the Public Assistance Act of 1950 but has roots in previous
regulations, as mentioned earlier. The public assistance covers basic needs of life, including
daily expenses, housing, education, training, medical and long-term care, births and funerals.
Most items are paid in cash, but health and long-term care is provided in kind and recipients
receive totally free care.
Public assistance is financed to three quarter by national subsidy and to one quarter by
prefectural and municipal subsidies. The operation of public assistance is mandated to the
Welfare Office, the public office institutionalized by the Act on Social Welfare. There are 1,249
such offices throughout Japan (2012). The case workers assigned to the Welfare Office exam-
ine applications in close collaboration with Welfare Volunteers and work to help recipients
establish independence so that they would no longer need public assistance.
The average amount of cash payment for all items combined is 141,327 yen per person per
month. The proportion of the population of all ages receiving public assistance was 1.6 per
cent in 2011, increasing since the late 1990s. This proportion is greater for older persons,
and the ageing population is one reason for the increasing number of recipients of public
assistance.
The public assistance is the last safety net to protect those in need and thus assures the uni-
versality of long-term care in Japan.
4.4 Disability protection measures
At the time LTCI was introduced, there was discussion on whether disability protection measures
and disability pension should be integrated into the scheme. Strong opposition from associations
of the persons with disabilities, fearing that the welfare measures for persons with disabilities
would be restricted and reduced, precluded the inclusion. In principle, old age disability should
be covered by the LTCI scheme, but some older persons prefer to receive the disability benefit.
As of 2011, 49.3 per cent of physical disability certificate holders were aged 70 years or older. 4
4 Survey on Difficulties in Life (2011) Ministry of Health, Labour and Welfare.
29PROJECT WORKING PAPERS SERIES: LONG-TERM CARE FOR OLDER PERSONS IN ASIA AND THE PACIFIC
The integration of disability protection measures with health and long-term care insurance is
an issue to be reconsidered in the future.
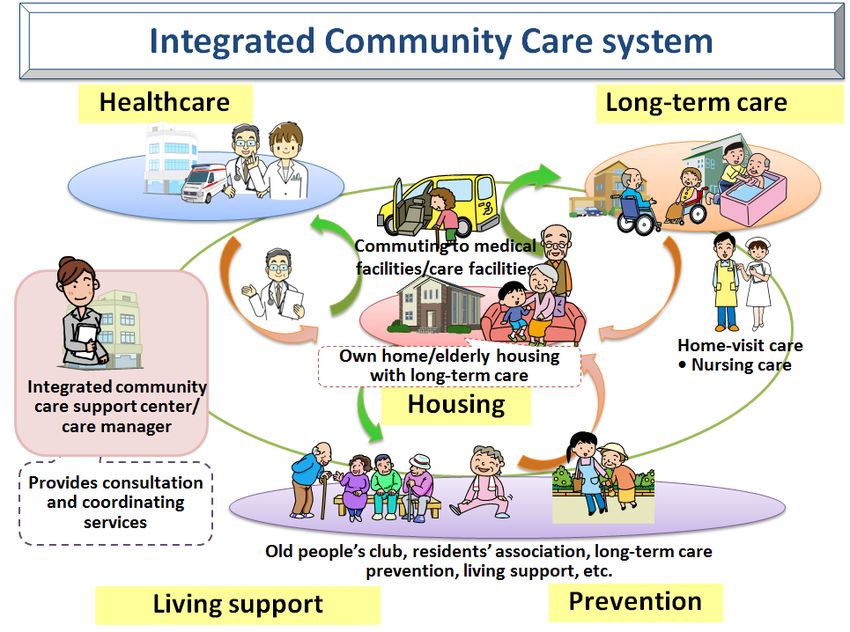
4.5 Care cycle and the integrated community care system
Although the LTCI, health insurance, public assistance and disability protection are separate
systems, there should be good coordination among them, given the limited resources. Thus,
the integrated community care system was introduced by an amendment to the Long-Term
Care Insurance Act and put in place in April 2012. Through this system, older person care is
centred at home and health care and long-term care are coordinated by the Integrated Com-
munity Care Centre (see figure 18).
FIGURE 18. INTEGRATED COMMUNITY CARE SYSTEM
Source: Ministry of Health, Labour and Welfare.
To receive the appropriate care, older persons move between different types of care facilities
(see the annex table for the different types of facilities). There are different routes and dura-
tion between home care and the different types of facility. At the Tokuyou, older persons who
are dependent but do not require acute medical care are admitted and can stay as long as they
need care, without any limitation on the duration. Most patients come from their home or the
Rouken and stay, on average, 1,405 days. In 2013, 73 per cent of the patients died there, while
22 per cent moved to a medical facility (hospital) (see figure 19).
30LONG-TERM CARE FOR OLDER PERSONS IN JAPAN
At the Rouken, the aim is to accommodate older persons recovering from acute illness. The
duration of stay is recommended for up to three months; the average stay is 311 days. Of
those who checked into the Rouken in 2013, 39 per cent came from a medical facility and
23 per cent from home. 41 per cent of patients moved to a medical facility, while 32 per cent
returned home.
At the Sanatorium Medical Facility, older persons who need chronic medical care are admit-
ted for up to three months. As of 2013, more than half (55 per cent) of the patients came from
another medical facility and stayed an average of 483 days; 41 per cent of them died in the
facility and 31 per cent moved to another medical facility (Ministry of Health, Labour and
Welfare, 2014).
FIGURE 19. ORIGIN AND DESTINATION OF THOSE WHO LEFT THE LONG-TERM CARE FACILITY,
SEPTEMBER 2013
Origin % Destination %
Family 28.9 Family 1.8
Tokuyou 2.8 Tokuyou 1.0
Other welfare facility 4.6 Other welfare facility 0.4
› ›
Rouken 16.6 Rouken 0.5
Medical facility 12.1
Tokuyou Medical facility 21.6
Other 3.0 Death 72.7
Unknown 32.1 Other 0.9
Unknown 0.9
Total 100.0 Total 100.0
Average days of residence: 1 405.1 days
Origin % Destination %
Family 22.9 Family 31.7
Tokuyou 0.5 Tokuyou 9.3
Other welfare facility 0.5 Other welfare facility 2.4
› ›
Rouken 2.7 Rouken 3.6
Medical facility 39.0
Rouken Medical facility 40.6
Other 0.8 Death 8.7
Unknown 33.6 Other 2.2
Unknown 1.5
Total 100.0 Total 100.0
Average days of residence: 311.3 days
31PROJECT WORKING PAPERS SERIES: LONG-TERM CARE FOR OLDER PERSONS IN ASIA AND THE PACIFIC
Origin % Destination %
Family 6.5 Family 9.3
Tokuyou 0.8 Tokuyou 5.9
Other welfare facility 0.8 Other welfare facility 1.3
› ›
Rouken 3.4 Rouken 8.3
Medical facility 55.4
Sanatorium Medical facility 31.1
Other 0.8 Death 41.4
Unknown 32.2 Other 1.8
Unknown 1.0
Total 100.0 Total 100.0
Average days of residence: 482.7 days
Source: Ministry of Health, Labour and Welfare, “Survey of long-term care benefit expenditures” (Tokyo, 2015).
Older persons who want to stay in the facility until the end of their life prefer to be admitted
to the Tokuyou because there is no limitation on the length of stay and the co-payment is
considered inexpensive. There is a long waiting list to be admitted to Tokuyou. At the same
time, the Government plans to shut down the Sanatorium in March 2018 because it is too
expensive to keep operating. The planned replacement facility is the New Rouken, or Long-
term Medical Care Facility where older persons will receive care that is more medical than
what is now available at the Rouken (though it will be less medical than at the Sanatorium).
It will require a higher co-payment than what the Tokuyou charges, but patients can stay until
the end of their life. The planned transition, however, is not moving ahead smoothly because
the owners of the Sanatorium oppose the New Rouken due to less profit for them.
Older people move between facilities and their home not only because institutional care is
costly but because they should primarily stay in their home. The integrated community care
system should coordinate these moves between different facilities and the home.
4.6 Fiscal sustainability: Long-term trend of care expenditure for
older persons
Care expenditure for older persons has been increasing and part of the reason is of course the
ageing population as older persons consume more care resources. In addition, the per capi-
ta elderly care expenditure is also increasing. In 1977, for instance, the combined medical,
welfare and long-term care expenditure totalled 238,000 yen per older person. It jumped to
807,000 yen per older person in 2012, more than a threefold increase (see figure 20).
The LTCI was introduced to suppress the increase of medical costs, and indeed, the per capita
medical costs stabilized from then until 2008. With regards to costs, the introduction of the
LTCI can be considered as successful.
32You can also read