Leveraging Symptom Search Data to Understand Disparities in US Mental Health Care: Demographic Analysis of Search Engine Trace Data - XSL FO
←
→
Page content transcription
If your browser does not render page correctly, please read the page content below

JMIR MENTAL HEALTH                                                                                                                   Rochford et al

     Original Paper

     Leveraging Symptom Search Data to Understand Disparities in
     US Mental Health Care: Demographic Analysis of Search Engine
     Trace Data

     Ben Rochford*; Sachin Pendse*, MS; Neha Kumar, PhD; Munmun De Choudhury, PhD
     School of Interactive Computing, College of Computing, Georgia Institute of Technology, Atlanta, GA, United States
     *
      these authors contributed equally

     Corresponding Author:
     Ben Rochford
     School of Interactive Computing
     College of Computing
     Georgia Institute of Technology
     756 W Peachtree St NW
     Atlanta, GA, 30308
     United States
     Phone: 1 404 385 8603
     Email: brochford3@gatech.edu

     Abstract
     Background: In the United States, 1 out of every 3 people lives in a mental health professional shortage area. Shortage areas
     tend to be rural, have higher levels of poverty, and have poor mental health outcomes. Previous work has demonstrated that these
     poor outcomes may arise from interactions between a lack of resources and lack of recognition of mental illness by medical
     professionals.
     Objective: We aimed to understand the differences in how people in shortage and nonshortage areas search for information
     about mental health on the web.
     Methods: We analyzed search engine log data related to health from 2017-2021 and examined the differences in mental health
     search behavior between shortage and nonshortage areas. We analyzed several axes of difference, including shortage versus
     nonshortage comparisons, urban versus rural comparisons, and temporal comparisons.
     Results: We found specific differences in search behavior between shortage and nonshortage areas. In shortage areas, broader
     and more general mental health symptom categories, namely anxiety (mean 2.03%, SD 0.44%), depression (mean 1.15%, SD
     0.27%), fatigue (mean 1.21%, SD 0.28%), and headache (mean 1.03%, SD 0.23%), were searched significantly more often
     (Q
JMIR MENTAL HEALTH                                                                                                            Rochford et al

                                                                           community expressions of mental health in shortage areas are
     Introduction                                                          not as well understood or investigated. This lack of
     Background                                                            understanding is a significant gap in providing culturally
                                                                           competent care and can have a severe impact on the provision
     Over the course of a given year, 1 in 5 US adults will experience     of care, particularly for those in geographically sparse or
     mental illness [1]. This ratio is starker for young adults, with      hard-to-reach areas [25,26].
     nearly 1 in 2 US adolescents experiencing mental illness within
     a given year [1]. Most people experiencing mental illness do          One way in which people understand their experience of health
     not receive care, with only 46.2% of US adults experiencing           and learn more about symptoms is via search engine queries
     mental illness receiving any form of care in 2020 [1]. Early          and the subsequent resources recommended by the engines
     signs suggest that the stress of coping with the COVID-19             [27,28]. A Pew Research study conducted in 2013 [29] found
     pandemic [2] has caused an increase in the prevalence of serious      that over 1 in 3 Americans search on the web for information
     mental distress [3] with longitudinal impacts that are not yet        about their health experiences, and nearly 8 in 10 of those who
     fully understood.                                                     do search on the web for information and care begin their
                                                                           journey through a search engine. As traces of private
     However, the sudden and widespread move toward remote work            engagements with a technology-mediated tool, search engine
     during the pandemic has also influenced the provision of care         data can provide valuable insights into how individuals
     for mental illness—what Shore et al [4] call “the rapid               understand their own mental health and express it to others
     virtualization of psychiatric care.” Given the requirements of        without the limitations of external social stigma [30].
     social distancing and pandemic-incited isolation, an increasing
     number of individuals have turned to technology-mediated tools        Objective
     and resources to find help when in distress, including online         In this study, by leveraging deidentified and aggregated data
     support communities [5], helplines [6], resources recommended         from Google (Google LLC) searches regarding symptoms from
     by search engines [7], teletherapy [8], and telepsychiatry [4],       2017 to 2021 [31], we analyzed how differences in access to
     among other modalities. Recommendation algorithms that                mental health resources relate with how individuals search for
     analyze individual language around mental health underlie how         mental health conditions and related symptoms. The following
     these tools suggest resources to people in need [9], including        research questions (RQs) were asked:
     ways that may be opaque to those engaging with the technology-
                                                                           1.   What are the differences between shortage and nonshortage
     or algorithmically mediated support system [10].
                                                                                areas regarding how people search for mental health
     As technology-mediated tools and resources expand access to                symptoms?
     care, structural and societal divides in American society are         2.   How does the rural-urban divide interact with how people
     particularly important to study to ensure that inequities are not          in shortage and nonshortage areas search for mental health
     exacerbated by how algorithmically directed interventions are              symptoms?
     designed or deployed. Disparities in household income [11],           3.   How have patterns in searching for mental health symptoms
     care resources [12], race and ethnicity [13,14], sexual orientation        in shortage and nonshortage areas changed over time,
     [15,16], and gender identity [17] have all been demonstrated to            particularly given the onset of the COVID-19 pandemic?
     have a substantial influence on how people experience mental          4.   How might search behavior concerning suicidal ideation
     illness and whether care is accessible. Much has also been                 differ between shortage and nonshortage areas?
     written about the digital divide in the United States, with nearly
     3 in 10 rural Americans without a broadband connection at             Through our analysis, we demonstrate significant differences
     home [18] and roughly 3 in 10 Black adults and 4 in 10 Hispanic       in how individuals in shortage and nonshortage areas articulate
     adults without a broadband connection at home [19]. The sudden        their experiences when seeking more information and resources
     move to remote health care services during the COVID-19               regarding mental illness and health. We found that individuals
     pandemic made digital divides more sharply consequential [20],        tend to search for mental health less in shortage areas than in
     with some even arguing that they functioned as a social               nonshortage areas. These results are consistent when accounting
     determinant of health [21,22] given that telehealth use was a         for the fact that shortage areas are predominantly rural. We also
     primary means of care amid overburdened hospitals.                    found that individuals in shortage areas tend to use broader (and
                                                                           often somatic) representations of mental illness when searching
     A similar divide exists in the availability of mental health care     for resources, whereas individuals in nonshortage areas tend to
     providers in the United States. In the United States,                 search for more specific diagnoses and conditions that use
     approximately 113 million people [23] live in mental health           clinical mental health language [32]. We also found distinct
     professional shortage areas (MHPSAs). MHPSAs are designated           patterns regarding how people search for mental health and
     by the US Health Resources and Services Administration                illness over time, including a specific look at suicidal
     (HRSA) as facilities, population groups, and geographic areas         ideation—a health issue with distinct prevalence and burden in
     in which there are “too few...mental health providers and             shortage areas [33]. Overall, our approach demonstrates the
     services” to meet expected needs [24]. In this study, for brevity,    viability of using symptom search data on the web to better
     we describe MHPSAs as “shortage areas” and areas that are not         understand the differences in how people understand and express
     MHPSAs as “nonshortage areas.” Although it is well recognized         their mental health experiences in resource-constrained areas.
     that economic, social, and geographic disparities influence the
     accessibility and use of care in shortage areas, individual and

     https://mental.jmir.org/2023/1/e43253                                                               JMIR Ment Health 2023 | vol. 10 | e43253 | p. 2
                                                                                                               (page number not for citation purposes)
XSL• FO
RenderX
JMIR MENTAL HEALTH                                                                                                                    Rochford et al

                                                                                excluded smaller facilities that were population-based (such as
     Methods                                                                    “migrant farmworkers”) or facility-based (such as correctional
     Data                                                                       facilities or “Indian Health Facilities”) [24]. In addition, to
                                                                                classify the relative rural or urban nature of different counties,
     We leveraged data from the Google COVID-19 Search Trends                   we used the 3-tiered 2013 classification system delineating rural,
     symptoms data set [31]. Released during the COVID-19                       micropolitan, and metropolitan areas used by the National Center
     pandemic and regularly updated, these data are “a publicly                 for Health Statistics [37,38]. As a simplification, this
     available dataset that shows aggregated, anonymized trends in              classification system groups both moderately populated
     Google searches for symptoms (and some related topics)” [34].              suburban areas and densely populated urban areas as being
     These data include searches related to 422 different symptoms,             “metropolitan.” To make this analysis more specific and
     conditions, and diseases and not exclusively to mental health              highlight the differences between the most rural and most urban
     conditions. On their white page [32], Google described the                 counties, we also used the 6-tiered classification system [37] to
     process of aggregating and anonymizing health queries for each             examine the differences between the most rural counties and
     region in the data set. Using differential privacy, Google                 large “central” metropolitan areas (with populations of ≥1
     collected relative-to-area measures to search for queries related          million people). As some counties in the United States are
     to the data set’s target terms. Statistical noise was added to             classified as “partial shortage areas” [24], for a clearer
     obfuscate individual queries, especially in areas with low                 comparison, we analyzed the differences between areas that
     population where generalized statistics could be more invasive             were entirely classified as shortage areas or entirely not being
     to specific individuals. As a show of face validity, these data            shortage areas.
     have been used in past work to predict the rates of transmission
     and mortality of COVID-19 in the United States, both                       As a result of the robust process used to ensure that the search
     independently [35] and in conjunction with other data sources              result data cannot be traced back to individual users [34], the
     [36].                                                                      Google COVID-19 Search Trends symptoms data set did not
                                                                                include data for counties that are extremely sparsely populated.
     To scope our data set, we leveraged symptom search data at a               In total, this included 105 counties (of the 3143 counties and
     biweekly level (the most granular available time span at the               county equivalents in the United States [39]), including 103
     time of data collection) and at the county level for all counties          shortage area counties, 2 partial shortage counties, and 1
     in the United States. For our analysis, we analyzed data from              nonshortage county. In total, this is 3.37% of all counties or
     2017 to 2021.                                                              county equivalents (such as parishes or boroughs) in the United
     We limited our analysis to all areas labeled as “Geographic                States. The specific counties that did not have available data,
     Area” shortage and nonshortage areas by the US HRSA. This                  likely owing to extremely low population levels, are shown in
                                                                                Figure 1, colored in gray.
     Figure 1. Map of US mental health searching percentage of total symptom search. Counties that tend toward purple have lower levels of mental health
     searching, whereas counties that have higher levels of mental health searching tend toward yellow. The maximum and minimum observed percentages
     of total searching that can be attributed to mental health can be seen in Table 1.

     https://mental.jmir.org/2023/1/e43253                                                                       JMIR Ment Health 2023 | vol. 10 | e43253 | p. 3
                                                                                                                       (page number not for citation purposes)
XSL• FO
RenderX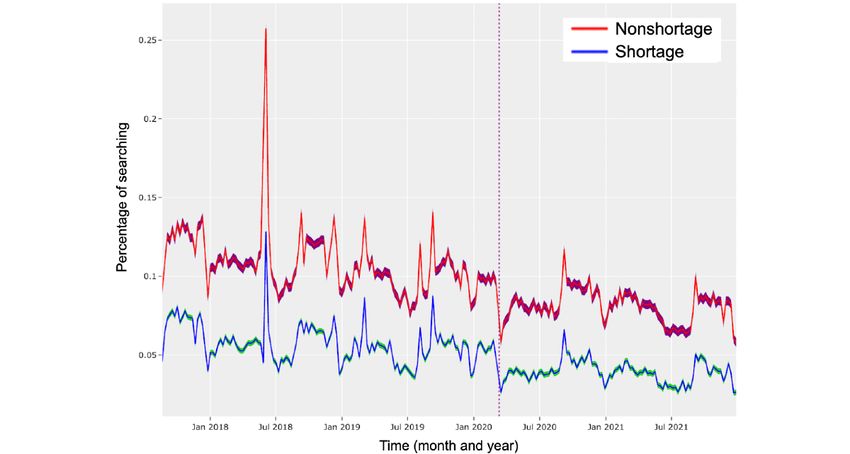
JMIR MENTAL HEALTH                                                                                                                              Rochford et al

     Table 1. Counties that search for mental health symptoms the most and the least.a
         Rank          Counties with most mental health searching (%; area)                Counties with least mental health searchingb (%; area)
         1             Uintah County, Utah (24.06%; shortage area)                         Taliaferro County, Georgia (3.70%; shortage area)
         2             Hampshire County, Massachusetts (17.74%; nonshortage area)          Irion County, Texas (4.27%; shortage area)
         3             Oglala Lakota County, South Dakota (17.60%; shortage area)          Loving County, Texas (4.47%; shortage area)
         4             Boulder County, Colorado (17.27%; shortage area)                    Elk County, Kansas (4.57%; shortage area)
         5             Todd County, North Dakota (17.24%; shortage area)                   Harper County, Oklahoma (4.74%; shortage area)
         6             Whitman County, Washington (17.19%; shortage area)                  Clark County, South Dakota (4.84%; shortage area)
         7             Douglas County, Kansas (17.17%; nonshortage area)                   Hitchcock County, Nebraska (4.99%; shortage area)
         8             Williamsburg City County, Virginia (17.16%; nonshortage area) Quitman County, Georgia (4.99%; shortage area)
         9             Tompkins County, New York (17.12%; shortage area)                   Echols County, Georgia (5.03%; shortage area)
         10            Monroe County, Indiana (17.09%; shortage area)                      Eureka, Nevada (5.05%; partial shortage area)

     a
         Percentages of mental health–related searches (out of total health-related searches) are in parentheses.
     b
         Note that all counties with least mental health–related searches are either shortage or partial shortage areas.

                                                                                       The affiliations output that we generated followed previous
     Identifying Mental Health Symptoms                                                research in psychiatry. For example, there was a strong Google
     As noted above, the Google COVID-19 Search Trends                                 Trends signal between anxiety and depression, conforming to
     symptoms data set includes search topics that span both physical                  research in psychiatry that shows a high comorbidity between
     and mental health. To filter the particular topics that were                      these 2 conditions [42,43]. There were also strong trends for
     primarily relevant to mental health, we began with a process of                   other pairs that have been shown to have high comorbidities,
     manual categorization by the 2 first coauthors (one of whom is                    such as insomnia and sleep apnea [44] or self-harm and physical
     a domain expert with nearly 6 years of experience in digital and                  scarring [45]. However, some of the strong affiliations were
     global mental health). Each author selected search topics related                 unexpected. For example, there was a strong association between
     to the conditions that were referenced in psychiatric manuals                     confusion and urinary tract infections, likely attributable to the
     and resources. Comparing these independently generated lists                      emergence of these symptoms together in older individuals
     resulted in a Cohen κ of 0.859, with an overall agreement of                      potentially experiencing dementia [46].
     97.6%. At this stage, we had identified 42 distinct topics
     pertaining specifically to mental health. We continued to refine                  Using these data on search affiliations from Google Trends, we
     and expand this list as described in the following paragraphs.                    were able to identify somatic symptom terminology that often
                                                                                       co-occurred with mental health searches and were thus relevant
     As discussed in previous research [40], broad and somatic                         to our analysis. To remove noise related to the COVID-19
     symptoms can also be presentations of mental illness. As these                    pandemic, we manually removed any respiratory symptoms or
     were not captured in the initial pass of the 42 filtered symptoms                 any identified terms that were diagnosed as nonpsychiatric
     above, we sought to expand our data set to include somatic                        syndromes or broader diseases (as opposed to being solely
     symptoms that might be indicative of a mental illness. To do                      symptoms). Our final list of 71 mental health–related search
     so, we identified symptoms that were most commonly searched                       topics can be accessed in Multimedia Appendix 1.
     on Google with the mental health diagnoses we had chosen. We
     leveraged Google Trends [41] to identify related search topics                    Analytic Approach
     and queries associated with each of the 422 symptoms in our                       To protect the privacy of their users [34], the Google COVID-19
     data set. We then probed these related topics and queries and                     Search Trends symptoms data set provides aggregate normalized
     created a list of symptoms and conditions that had connections                    weights representing how often a symptom was searched in
     to our manually generated list of 42 mental health symptoms                       comparison to other symptoms rather than reporting raw search
     and conditions. We included all symptoms that co-occurred                         frequencies. As noted in the data description [31], because of
     with a manually selected mental health symptom or condition.                      the different scaling factors, these weights were not consistent
     As this process was likely to introduce noise in our data, we                     across regions or timescales. Thus, to standardize our
     filtered out those associations that had a Google Trends                          comparisons, we divided each symptom’s weight by the total
     relevance metric that was
JMIR MENTAL HEALTH Rochford et al
comparisons were performed using a statistical 2-tailed t test. When we break down the individual symptoms that make up
To eliminate the potential for a significant result occurring our broader “mental health symptom” construct, we see some
owing to chance because of the large number of symptoms being distinct patterns. Previous studies have shown that people living
used as comparison points, we calculated the false discovery in rural areas define health issues broadly [53]. Indeed, broader
rate, hereinafter called the Q value, at a significance level of and more general symptom categories associated with mental
.05. health tended to be searched significantly more often in shortage
areas, specifically anxiety (mean 2.03%, SD 0.44%; Q),
Results depression (mean 1.15%, SD 0.27%; Q), fatigue (mean 1.21%,
SD 0.28%; Q), and headache (mean 1.03%, SD 0.23%; Q). The
Shortage Areas and Nonshortage Areas more clinical versions of these terms such as major depressive
We began our analysis by broadly examining the differences in disorder or generalized anxiety disorder are less distinct, with
searching for mental health symptoms between shortage and major depressive disorder being searched more often in shortage
nonshortage areas (RQ1). As shown in Figure 1, searching for areas (mean 1.01%, SD 0.25%), whereas generalized anxiety
mental health symptoms was broadly associated with population disorder is searched more often in nonshortage areas (mean
density, similar to the association between mental health 0.25%, SD 0.03%). However, the fact that clinical language
shortage area and population density [47]. More sparsely around anxiety was searched for more in nonshortage areas may
populated areas had lower levels of mental health symptom be representative of a greater level of mental health literacy,
searching, whereas more populated areas had higher levels of awareness of clinical framings of distress in nonshortage areas,
mental health symptom searching. or a previously known self-diagnosis, potentially stemming
from access to a greater number of mental health professionals.
Associations could also be observed in relation to race. As seen
in Figure 1, noticeably lower levels of mental health symptom These differences were more distinct when searching for topics
search could be seen in the Black Belt region of the American related to more specific symptom categories and mental health
South. This region, originally called the Black Belt because of disorders. Individuals in nonshortage areas were significantly
the dark soil typical of the area, is home to a higher-than-average more likely to search for specific symptom categories and mental
number of Black individuals [48] as a result of free descendants health disorders than individuals in shortage areas. For example,
of enslaved individuals who were economically forced to binge eating (mean 0.02%, SD 0.02%; Q), psychosis (mean
continue living in the same area as sharecroppers or tenant 0.37%, SD 0.06%; Q), and attention-deficit/hyperactivity
farmers [49]. As discussed by Pendse et al [50], the illness disorder (ADHD; mean 0.77%, SD 0.10%; Q) were all searched
constructs used to evaluate mental health symptoms were significantly more in nonshortage areas. These are clinically
primarily trained in White, Western, and often female recognized in the Diagnostic Manual for Mental Disorders [54]
populations. Therefore, it may be the case that these areas have and commonly appear in clinical interview instruments used by
comparable levels of mental health searching but may use therapists, psychiatrists, and social workers [55]. The same is
cultural framings of distress [51,52] that are not typically true of all other specific diagnoses other than alcoholism, which
associated with dominant framings of mental illness. is searched more in nonshortage areas, but the search frequency
is not statistically significantly distinct from that in shortage
In addition, Table 1 shows the counties with the highest and areas.
lowest levels of mental health symptom searches. As shown, 3
of the top 10 counties with the highest rates of mental health Pertinent to RQ1, our results demonstrate that individuals in
symptom–related searching were nonshortage areas, whereas shortage areas were more likely than those in nonshortage areas
none of the areas with the lowest rates of mental health to search for broader symptom categories, including those often
symptom–related searching were nonshortage areas. Nationally, associated with somatic symptom presentations of mental illness
individuals in shortage areas generally search for mental health (such as headache or fatigue) [56,57]. These results point to a
symptoms less often than those in nonshortage areas. As noted potentially strong relationship between the number of mental
in Table 2, on average, 13.42% (SD 2.24%) of searches in health practitioners in an area and how people come to
shortage areas were for mental health symptoms, compared with understand and express their mental health in private and
15.06% (SD 0.96%) of searches in nonshortage areas. individual settings.
https://mental.jmir.org/2023/1/e43253 JMIR Ment Health 2023 | vol. 10 | e43253 | p. 5
(page number not for citation purposes)
XSL• FO
RenderXJMIR MENTAL HEALTH Rochford et al
Table 2. Shortage versus nonshortage areas—percentage of search.a,b
Shortage areas (%), mean Nonshortage areas (%), Q value
(SD) mean (SD)
Overall average 13.42 (2.24) 15.06 (0.96) 1.26 × 10⁻²⁵
Broad symptoms
Anxiety 2.03 (0.44) 1.8 (0.28) 6.36 × 10⁻¹⁴
Depression 1.15 (0.27) 1.08 (0.11) 2.43 × 10⁻⁴
Fatigue 1.21 (0.28) 1.05 (0.12) 5.64 × 10⁻¹⁵
Headache 1.03 (0.23) 0.95 (0.07) 1.44 × 10⁻⁷
Specific conditions
Alcoholism 0.93 (0.29) 0.97 (0.14) 3.42 × 10⁻²
Attention-deficit/hyperactivity disorder 0.73 (0.20) 0.77 (0.1) 8.80 × 10⁻⁴
Binge eating 0.02 (0.02) 0.05 (0.02) 3.42 × 10–52
Compulsive behavior 0.07 (0.06) 0.14 (0.03) 4.61 × 10–71
Dysphoria 0.01 (0.02) 0.03 (0.02) 1.01 × 10–59
Generalized anxiety disorder 0.18 (0.09) 0.25 (0.03) 7.76 × 10⁻²⁷
Hypochondriasis 0.008 (0.016) 0.017 (0.01) 4.57 × 10⁻¹⁸
Hypomania 0.009 (0.02) 0.02 (0.01) 2.10 × 10⁻²⁹
Major depressive disorder 1.01 (0.25) 0.92 (0.09) 4.44 × 10⁻⁸
Manic disorder 0.08 (0.06) 0.13 (0.03) 6.62 × 10–48
Mood disorder 0.17 (0.09) 0.25 (0.04) 1.07 × 10⁻²⁸
Psychosis 0.30 (0.13) 0.37 (0.06) 3.80 × 10⁻¹³
Suicidal ideation 0.05 (0.04) 0.10 (0.03) 2.57 × 10–56
a
Percentages indicate the percentage of all health searches, with symptoms searched significantly more often in nonshortage areas (significance level
of QJMIR MENTAL HEALTH Rochford et al
We then repeated this analysis for urban shortage and urban examined differences in symptom searching in rural, urban, and
nonshortage areas to determine if the same patterns observed metropolitan shortage areas. We found that rurality does
for rural shortage and nonshortage areas were preserved. influence how people frame their symptom searches. We
Consistent with our past results, we noticed that individuals in discovered that the more rural a shortage area is, the lower their
urban nonshortage areas searched for mental health symptoms level of mental health searching is, with an average of 12.44%
more often than individuals in urban shortage areas, with the (SD 2.62%) of searches in rural shortage areas, 14.27% (SD
percentage of all health searches being an average of 15.03% 1.32%) of searches in urban shortage areas, and 15.11% (SD
(SD 0.79%) in urban nonshortage areas and of 14.27% (SD 0.70%) of searches in metropolitan shortage areas.
1.32%) in urban shortage areas.
As shown in Table 5, when comparing rural and urban areas,
We also observed that some broader and more somatic symptom we also found that searches for broader symptoms (such as
categories, namely fatigue and headache, were higher in urban anxiety, depression, fatigue, and headache) were significantly
shortage areas than in urban nonshortage areas. However, higher in rural shortage areas than in urban shortage areas. We
broader psychiatric symptom categories were relatively similar, also found that several specific diagnoses (such as ADHD,
with no significant difference between urban shortage and generalized anxiety disorder, and psychosis among others) are
nonshortage areas for searches related to anxiety (Q=.051) and significantly more frequently searched in urban shortage areas,
depression (Q=.051), consistent with our rural analysis. Similar as shown in Table 5. This suggests that rurality is also a
to the observations in our rural analysis, we found that specific significant factor (along with the number of mental health
conditions and disorders were searched significantly more often professionals in an area) in influencing how people search for
in urban shortage areas. As shown in Table 4, all specific mental health resources on the web.
conditions other than major depressive disorder were searched
When comparing rural and metropolitan shortage areas, we
at higher rates in nonshortage areas. For example, generalized
observed similar patterns—searches were significantly higher
anxiety disorder (Q=5.69 × 10⁻⁷) was searched on an average for specific disorders and diagnoses in metropolitan shortage
of 0.23% (SD 0.07%) occasions in urban shortage areas and of areas. However, we found that the overall degree of significance
0.24% (SD 0.03%) in urban nonshortage areas. Similarly, was smaller. For some of the broader symptoms, we found no
compulsive behavior (Q=2.17 × 10⁻²⁰) and psychosis (Q=.0014) statistically significant difference between the searches in rural
were searched more often in urban nonshortage areas (mean shortage areas and metropolitan shortage areas (such as for
0.139%, SD 0.03%; mean 0.36%, SD 0.05%, respectively) than depression, major depressive disorder, and headache). We did
in urban shortage areas (mean 0.1%, SD 0.051%; mean 0.34%, find that anxiety and fatigue were searched less frequently in
SD 0.08%, respectively). metropolitan shortage areas than in rural shortage areas,
Analyzing our results in Tables 3 and 4 together, we see similar consistent with our other results. Similarly, we did find that
patterns when comparing shortage and nonshortage areas specific conditions were searched more often in metropolitan
broadly. Individuals in shortage and nonshortage areas searched shortage areas than in rural shortage areas, as can be seen in
for broader symptom categories at roughly the same rates. Table 5.
However, individuals in nonshortage areas, rural or urban, Unique from other symptoms, we found no significant difference
relatively consistently searched for more specific conditions in the search rates of alcoholism among rural shortage areas,
related to mental health. The number of mental health urban shortage areas, and metropolitan shortage areas (Q=.390;
professionals that an area has might thus be an indication of Q=.749). This confirms previous findings showing mixed results
how people in that area predominantly search for symptoms of when attempting to examine differences in alcohol use disorders
mental illness, and this expresses how levels of mental health in urban and rural areas [58]. Taken together, these results
literacy relate to provider prevalence. enhance our understanding of the interaction between the rural
Subsequently, to investigate how rurality might influence how and urban divide and shortage versus nonshortage discrepancies
individuals in shortage areas express their symptoms, we in mental health–related searching (RQ2).
https://mental.jmir.org/2023/1/e43253 JMIR Ment Health 2023 | vol. 10 | e43253 | p. 7
(page number not for citation purposes)
XSL• FO
RenderXJMIR MENTAL HEALTH Rochford et al
Table 3. Rural shortage versus nonshortage areas—percentage of search.a
Rural shortage areas (%), Rural nonshortage areas (%), Q value
mean (SD) mean (SD)
Overall average 12.44 (2.62) 14.71 (2.44) .007b
Broad symptoms
Anxietyc 2.24 (0.49) 1.87 (0.29) .022d
Depression 1.19 (0.35) 1.12 (0.26) .550e
Fatigue 1.28 (0.35) 1.06 (0.25) .057e
Headache 1.05 (0.30) 0.95 (0.15) .343e
Specific conditions
Alcoholismf 0.93 (0.37) 1.18 (0.20) .041d
Attention-deficit/hyperactivity disorder 0.68 (0.25) 0.80 (0.24) .192e
Binge eating 0.013 (0.03) 0.019 (0.011) .549e
Compulsive behaviorf 0.033 (0.035) 0.121 (0.049) 1.16 × 10⁻¹⁵g
Dysphoriaf 0.009 (0.02) 0.021 (0.02) .042d
Generalized anxiety disorderf 0.119 (0.09) 0.25 (0.024) 1.16 × 10⁻⁶g
Hypochondriasis 0.008 (0.021) 0.003 (0.002) .540e
Hypomania 0.008 (0.020) 0.02 (0.03) .330e
Major depressive disorder 1.05 (0.33) 0.95 (0.20) .441e
Manic disorderf 0.040 (0.038) 0.13 (0.050) 2.13 × 10⁻¹⁴g
Mood disorderf 0.117 (0.086) 0.255 (0.06) 1.48 × 10⁻⁷g
Psychosisf 0.241 (0.145) 0.383 (0.12) .002b
Suicidal ideationf 0.024 (0.029) 0.088 (0.053) 1.91 × 10⁻¹²g
a
Percentages indicate mental health searching out of all health searches.
b
Significance level of QJMIR MENTAL HEALTH Rochford et al
Table 4. Urban shortage versus nonshortage areas—percentage of search.a
Urban shortage areas (%), mean (SD) Urban nonshortage (%), mean (SD) Q value
Overall average 14. (1.32) 15.03 (0.79) 5.71 × 10⁻¹³b
Broad symptoms
Anxiety 1.85 (0.32) 1.8 (0.3) .051c
Depression 1.1 (0.17) 1.07 (0.09) .051c
Fatigued 1.13 (0.19) 1.05 (0.11) 1.54 × 10⁻⁷b
Headached 1.01 (0.15) 0.95 (0.07) 1.29 × 10⁻⁷b
Specific conditions
Alcoholisme 0.92 (0.19) 0.95 (0.12) .033f
Attention-deficit/hyperactivity 0.76 (0.13) 0.77 (0.09) .614c
e
disorder
Binge eatinge 0.03 (0.02) 0.05 (0.02) 3.96 × 10⁻¹⁹b
Compulsive behaviore 0.1 (0.051) 0.139 (0.03) 2.17 × 10⁻²⁰b
Dysphoriae 0.02 (0.018) 0.04 (0.02) 6.26 × 10⁻¹⁹b
Generalized anxiety disordere 0.23 (0.07) 0.24 (0.03) 5.69 × 10⁻⁷b
Hypochondriasise 0.01 (0.01) 0.02 (0.01) 9.97 × 10⁻²⁰b
Hypomaniae 0.01 (0.01) 0.02 (0.01) 2.01 × 10⁻²³b
Major depressive disorderd 0.97 (0.16) 0.92 (0.08) 6.46 × 10⁻⁶b
Manic disordere 0.11 (0.05) 0.13 (0.03) 8.23 × 10⁻¹¹b
Mood disordere 0.21 (0.07) 0.24 (0.04) 4.81 × 10⁻⁸b
Psychosise 0.34 (0.08) 0.36 (0.05) .0014g
Suicidal ideatione 0.07 (0.04) 0.09 (0.03) 5.21 × 10⁻¹³b
a
Percentages indicate mental health searching out of all health searches.
b
Significance level of QJMIR MENTAL HEALTH Rochford et al
Table 5. Percentage of searches in rural versus urban versus metro shortage areas.a
Rural shortage areas Urban shortage areas Metro shortage areas Rural versus ur- Rural versus
(%), mean (SD) (%), mean (SD) (%), mean (SD) ban, Q value metro, Q value
Overall average 12.44 (2.62) 14.27 (1.32) 15.11 (0.70) 2.58 × 10-68b .0003
Broad symptoms
Anxietyc,d 2.24 (0.49) 1.85 (0.32) .97 (0.14) 1.08 × 10–79b .0002b
Depressiond 1.19 (0.35) 1.1 (0.17) 1.05 (0.09) 5.89 × 10⁻¹²b .16e
Fatiguec,d 1.28 (0.35) 1.13 (0.19) 0.98 (0.03) 1.54 × 10⁻²⁶b .003f
Headached 1.05 (0.30) 1.01 (0.15) 0.91 (0.02) .00023b .083e
Specific conditions
Alcoholism 0.93 (0.37) .92 (0.19) 0.97 (0.14) .390e .749e
Attention-deficit/hyperactivity 0.68 (0.25) 0.76 (0.13) 0.78 (0.07) 7.26 × 10⁻¹⁶b .193e
disorderg
Binge eatingg,h 0.013 (0.03) 0.03 (0.02) 0.06 (0.01) 6.86 × 10–61b 1.18 × 10⁻¹⁰b
Compulsive behaviorg,h 0.033 (0.035) 0.1 (0.051) 0.19 (0.14) 1.93 × 10–206b 8.82 × 10–42b
Dysphoriad,g,h 0.009 (0.02) 0.02 (0.018) 0.05 (0.01) 1.11 × 10–48b 8.83 × 10⁻¹³b
Generalized anxiety disorderg,h 0.119 (0.09) 0.23 (0.07) 0.24 (0.007) 4.65 × 10–134b 2.56 × 10–06b
Hypochondriasisg,h 0.008 (0.021) 0.01 (0.01) 0.03 (0.002) .0009b .0017f
Hypomaniag,h 0.008 (0.020) 0.01 (0.01) 0.03 (0.005) 3.29 × 10–08b 7.36 × 10–05b
Major depressive disorderd 1.05 (0.33) 0.97 (0.16) 0.88 (0.06) 2.10 × 10–09b .074e
Manic disorderg,h 0.040 (0.038) 0.11 (0.05) 0.14 (0.01) 1.37 × 10–208b 2.07 × 10⁻²⁰b
Mood disorderg,h 0.117 (0.086) 0.21 (0.07) 0.24 (0.018) 1.36 × 10–132b 5.87 × 10–07b
Psychosisg,h 0.241 (0.145) 0.34 (0.08) 0.38 (0.03) 1.04 × 10–66b .0015f
Suicidal ideationg,h 0.024 (0.029) 0.07 (0.04) 0.11 (0.02) 9.11 × 10–172b 8.78 × 10⁻²²b
a
Percentages indicate the percentage of all health searches, with SDs in parentheses.
b
Significance level of QJMIR MENTAL HEALTH Rochford et al
the expression of psychosocial concerns during the pandemic hypochondriasis, and manic disorder significantly increased
[61]. Researchers attribute this plateauing effect to habituation after the start of the COVID-19 pandemic in both shortage and
to a “new normal,” given the protracted nature of the pandemic nonshortage areas. In addition, in both the shortage and
[61]. nonshortage areas, searches for depression, fatigue, alcoholism,
major depressive disorder, mood disorder, and suicidal ideation
Although these overall trends tend to be similar, we did observe
significantly declined. However, it has been observed that
some differences in mental health symptom searching before
overall, alcohol use [59] and depressive symptoms [62,63]
and after the pandemic’s onset. As shown in Table 6 for shortage
increased during the pandemic. A demonstrated lack of
areas and in Table 7 for nonshortage areas, searches for
engagement with web-based resources may thus be an indication
headache, ADHD, compulsive behavior, dysphoria,
of a lack of engagement with offline resources.
Figure 2. Symptom search distributions for several mental health symptoms in shortage areas. Vertical line represents March 11, 2020, the day that
the World Health Organization (WHO) declared COVID-19 a global pandemic [61]. CIs represented in transparent purple (the CIs tightly follow the
mean). Note that in the broader terms on the top row, rural shortage areas search at a higher rate than other types of areas. For the more particular terms
on the bottom row, rural shortage areas search at significantly lower rates.
https://mental.jmir.org/2023/1/e43253 JMIR Ment Health 2023 | vol. 10 | e43253 | p. 11
(page number not for citation purposes)
XSL• FO
RenderXJMIR MENTAL HEALTH Rochford et al
Figure 3. Symptom search distributions for several mental health symptoms in nonshortage areas. Vertical line represents March 11, 2020, the day
that the World Health Organization (WHO) declared COVID-19 a global pandemic [61]. CIs represented in transparent purple (the CIs tightly follow
the mean).
Figure 4. Symptom search distributions for suicidal ideation. Vertical line represents March 11, 2020, the day that the World Health Organization
(WHO) declared COVID-19 a global pandemic [61]. Note that symptom searching in both shortage and nonshortage areas trends downward. Also note
that shortage areas (with higher overall suicide rates) have lower levels of searching about suicidal ideation. Jan: January; Jul: July.
https://mental.jmir.org/2023/1/e43253 JMIR Ment Health 2023 | vol. 10 | e43253 | p. 12
(page number not for citation purposes)
XSL• FO
RenderXJMIR MENTAL HEALTH Rochford et al
Table 6. Percentage of search in shortage areas during pre–COVID-19 pandemic versus post–COVID-19 pandemic.a
Pre–COVID-19 pandemic (%), Post–COVID-19 pandemic (%), Q value
mean (SD) mean (SD)
Overall average 13.65 (0.70) 13.89 (0.97) .031b
Broad symptoms
Anxiety 2.006 (0.153) 2.021 (0.181) .505c
Depressiond 1.186 (0.091) 1.136 (0.147) .0023e
Fatigued 1.242 (0.057) 1.203 (0.065) 3.95 × 10⁻⁶f
Headacheg 1.047 (0.047) 1.069 (0.055) .0026e
Specific conditions
Alcoholismd 0.957 (0.058) 0.928 (0.07) .0017e
Attention-deficit/hyperactivity disorderg 0.729 (0.109) 0.788 (0.147) .0010e
Binge eating 0.022 (0.005) 0.023 (0.005) .303c
Compulsive behaviorg 0.068 (0.011) 0.074 (0.009) 3.49 × 10⁻⁶f
Dysphoriag 0.012 (0.003) 0.017 (0.004) 8.26 × 10⁻²³f
Generalized anxiety disorder 0.183 (0.019) 0.179 (0.023) .354c
Hypochondriasisg 0.007 (0.002) 0.008 (0.002) .008e
Hypomania 0.009 (0.003) 0.010 (0.002) .048b
Major depressive disorderd 1.066 (0.088) 1.008 (0.098) 1.36 × 10⁻⁵f
Manic disorderg 0.076 (0.012) 0.082 (0.011) 9.64 × 10⁻⁵f
Mood disorderd 0.184 (0.029) 0.170 (0.029) 5.36 × 10⁻⁴f
Psychosisg 0.310 (0.036) 0.322 (0.035) .020b
Suicidal ideationd 0.057 (0.013) 0.038 (0.007) 3.48 × 10⁻²⁷f
a
Percentages indicate percentage of all health searching.
b
Significance level of QJMIR MENTAL HEALTH Rochford et al
Table 7. Percentage of search in nonshortage areas during pre–COVID-19 pandemic versus post–COVID-19 pandemic.a
Pre–COVID-19 pandemic (%), Post–COVID-19 pandemic (%), Q value
mean (SD) mean (SD)
Overall average 14.985 (0.64) 15.234 (0.86) .02b
Broad symptoms
Anxietyc 1.772 (0.116) 1.808 (0.135) .038b
Depressiond 1.088 (0.106) 1.051 (0.106) .0031e
Fatigued 1.056 (0.050) 1.032 (0.050) 1.98 × 10⁻⁴f
Headachec 0.936 (0.0004) 0.955 (0.0004) 6.38 × 10⁻⁴f
Specific conditions
Alcoholismd 0.977 (0.051) 0.943 (0.068) 5.03 × 10⁻⁵f
Attention-deficit/hyperactivity disorderc 0.747 (0.084) 0.804 (0.124) 8.23 × 10⁻⁵f
Binge eatingc 0.049 (0.008) 0.052 (0.008) .0042e
Compulsive behaviorc 0.136 (0.012) 0.148 (0.012) 1.01 × 10⁻¹¹f
Dysphoriac 0.030 (0.005) 0.043 (0.008) 2.42 × 10⁻³³f
Generalized anxiety disorderd 0.251 (0.019) 0.241 (0.020) .002b
Hypochondriasisc 0.017 (0.003) 0.020 (0.004) 2.18 × 10⁻⁹f
Hypomaniac 0.022 (0.005) 0.024 (0.003) 9.06 × 10⁻⁵f
Major depressive disorderd 0.929 (0.069) 0.895 (0.079) 8.06 × 10⁻⁴f
Manic disorderc 0.133 (0.014) 0.139 (0.015) .002e
Mood disorderd 0.254 (0.031) 0.237 (0.026) 3.96 × 10⁻⁵f
Psychosis 0.369 (0.031) 0.368 (0.028) .760g
Suicidal ideationd 0.108 (0.021) 0.081 (0.010) 4.77 × 10⁻²⁴f
a
Percentages indicate percentage of all health searching.
b
Significance level of QJMIR MENTAL HEALTH Rochford et al
In addition, previous work has shown that the rates of suicide with the insights gained from this work, could strive to provide
have increased over time (from 1999 to 2016), with the steepest more educational pointers that enhance understanding of one’s
rises in rural areas [65]. However, considering the rates of experience as a result of broad symptom searching in shortage
searching, we actually observed that the rates of searching for areas. Similarly, as users in nonshortage areas tend to use more
suicidal ideation slowly trending downward over time. We clinical terms to seek information on mental health, search
conjecture that this discrepancy might be representative of the engine algorithms may prioritize those results that provide
fact that people who search for resources receive more support advice complementary to formal treatment.
(via internet resources) and are thus less likely to die by suicide.
We note that search technologies encode certain values about
what sort of content is “important” or “authoritative” [69], and
Discussion previous work has discovered that a lack of consideration of
Contextualizing Findings in Previous Research: equities can result in amplified biases against minoritized
identities [70,71]. Although we do not discover the underlying
Implications for Search Engines
intent or offline context of specific search behaviors, when
We observed that search topics pertaining to specific clinical catering to mental health–related search queries, these values
language regarding mental health were searched more often in would need to be punctuated with a deeper understanding of
nonshortage areas than in shortage areas, regardless of whether the types of searches in shortage and nonshortage areas. More
the shortage area was rural or urban. This finding allowed us specifically, we argue that to fulfill the potential of serving as
to uncover the relationship between the number (or availability) an algorithmically mediated care resource, search engine design
of mental health professionals in an area and the language that will need to decouple itself from the biases encoded in
people use to describe their experiences of distress (via search web-based advertising delivery. For instance, it has been
data). Having more specialized language to express mental demonstrated that search results for Black-identifying first
health status can be key to obtaining more specific treatment names are associated with more advertisements for public record
options. However, individuals in shortage areas tend to use this searches (eg, arrest records), in contrast to those for
specific language less frequently. White-identifying first names [72]. Search engines would need
Search engines can help close this inequity in care by referring to pay careful attention to ensure that queries for broader mental
individuals to specialized resources regarding mental health, health symptoms, as observed more often in shortage areas,
even when the symptom categories being searched for are provide empirically grounded results and not advertisements
broader. For example, the results in a search for “headache” for unverified treatments.
might include emotional support materials and information Contextualizing Findings in Previous Research:
about mental health conditions alongside broader information Implications for Public Health
about the different causes of or remedies for a headache. Doing
so might also moderate the potential for search engine results Our approach demonstrates the potential of using search engine
to escalate anxieties related to the diagnosis for a user, especially log data to better understand emerging symptom presentations
from a shortage area. White and Horvitz [66] described how and the use of care resources, expanding earlier investigations
the use of search engines to gain diagnostic understanding of that found individuals using search engines to gather new
illnesses by individuals with limited medical training may information and resources for their health [30]. Therefore, search
sometimes result in unfounded escalation of concerns regarding engine log data can be used to identify emerging symptom
common symptomatology. The presence of emotional support presentations by analyzing what searches co-occur with mental
and mental health resources alongside traditional health health symptoms. Moreover, from previous work, we already
information could provide individuals with language and know that interactions, which are mediated by search engine
resources that are more in line with their experience of distress ranking algorithms and their corresponding interfaces, can have
and serve to de-escalate concerns about symptoms that are likely tangible impacts on how individuals understand, describe, and
to be nonlethal. present their symptoms when speaking to clinicians [73,74].
Thus, search log data, such as the one used here, could also be
The need for an equitable design of search engines that attends used to identify emerging shortage areas or nonshortage areas,
to the diverse mental health needs of underserved populations even in areas with less reliable offline data. Areas in which
is underscored by the fact that technology-mediated systems individuals seem to tend toward searching broader symptom
may be the most accessible form of care or resources available categories could be flagged as potential shortage areas, whereas
to communities in need [67]. Therefore, in addition to the search areas with individuals who seem to tend toward searching more
engines being intentional about the type of support resources specific diagnoses could be flagged as potential nonshortage
to be directed to underserved mental health search users, we areas. Combined with traditional metrics from the HRSA, this
also emphasize the need to consider alternative ways of information could be used in new programs to incentivize mental
optimizing matching and personalization in search. In particular, health professionals to work in less covered areas. Search
while search engines do consider geolocation as one of many engines could differentiate between resources based on the
variables in tailoring search results [68], our findings show that shortage status and corresponding mental health literacy rate
given the nature of searches in shortage and nonshortage areas, that are inferred from a region’s search queries. This could be
personalization should consider social determinants of health particularly helpful in the case of suicidal ideation. We find that
and structural inequities in care experienced by these though rates of suicide are higher in shortage areas and on the
communities. For instance, search engines, which are equipped increase, broadly, rates of searching for suicidal ideation are
https://mental.jmir.org/2023/1/e43253 JMIR Ment Health 2023 | vol. 10 | e43253 | p. 15
(page number not for citation purposes)
XSL• FO
RenderXJMIR MENTAL HEALTH Rochford et al
lower in shortage areas and on the decline overall. Providing appreciate the use of several privacy-preserving mechanisms
additional resources to support someone experiencing suicidal in the Google COVID-19 Search Trends data set [34].
ideation, even when queries may not be specific to suicidal
Our work highlights the importance of better understanding the
ideation, may lead individuals to discover resources to which
differences between how individuals in shortage and
they may not have otherwise been exposed (such as helplines,
nonshortage areas perceive their experience of distress and
warmlines, or peer respite centers). This finding also underscores
express it to others. However, the data we analyzed were
the need to augment public health informational campaigns that
anonymized metadata and did not include other axes of
may be specifically targeted to underserved communities, as
oppression [76,77] that have an influence on expressions of
stigma and limited literacy around suicidal risk may be
mental illness, such as race, gender identity, sexual orientation,
underlying factors driving lower search for information
class, caste, ethnicity, or nationality [50]. Future work must
regarding suicide in shortage areas.
qualitatively investigate the specific idioms of distress [78] and
Ethical Implications and Future Work explanatory models [79] that underlie these search queries. Our
On the basis of our results, we believe and argue that search work is limited to resource-constrained areas in the United
engine algorithm designers have an ethical imperative to use States, and future work could explore how resource constraints
US public health information (such as whether an area is a interact with broader mental health symptom–related searches
shortage area) and apparent search trends to offer mental health in other countries.
resources more readily. However, as Pendse et al [50] discussed, Conclusions
we also consider the fact that the form of resources
Technology-mediated tools for mental health support (and the
recommended might influence how people come to think of
algorithms that underlie them) can often be the first point of
their mental health state. Privileging biomedical approaches to
contact with any form of mental health resources, particularly
health might be counterproductive or crowd out minoritized
for those in underserved groups. The diverse ways in which
forms of care. An alternative approach (such as an issue-specific
individuals understand and express their mental illness thus
support group or online forum) might be more in line with how
have a direct influence on both what resources are recommended
an individual understands their distress. We contend that search
and what resources are proactively excluded. In this study, we
engine algorithm designers should ensure that resources offered
investigated mental health symptom searching among one such
to individuals who appear to be in distress in prioritized medical
underserved group or individuals in the US MHPSAs. We
information cards (such as those from Google’s Knowledge
demonstrated strong differences between how individuals in
Panel [75]) are diverse, such as broader resources for stress,
areas with fewer mental health professionals search about their
warmlines, peer support, and other forms of care that may not
mental health, with clear implications for algorithm design and
fit a traditional biomedical lens, as Pendse et al [50] recommend.
health equity. We leveraged this analysis to discuss how search
Similarly, we are cognizant of the potential for analyses of
engine algorithm designers might be conscientious of the role
search engine data to be used to expose users’ personal
that structural factors play in expressions of distress and how
information without consent, particularly the information of
they can design search engine algorithms and interfaces to close
those living in geographically sparse or underserved areas. We
gaps in care.
Acknowledgments
The authors thank Evgeniy Gabrilovich for introduction to the Google symptom search data set and for initial conversations about
the data. SP was supported partly through a Microsoft gift to MDC and NK; SP, BR, and MDC were partly supported through a
grant from the National Institutes of Health (R01MH117172) and a grant from National Science Foundation Information and
Intelligent Systems (2027689), both to MDC.
Conflicts of Interest
None declared.
Multimedia Appendix 1
List of mental health–related search topics.
[TXT File , 1 KB-Multimedia Appendix 1]
References
1. Mental Health Information - Statistics - Mental Illness. National Institute of Mental Health. 2022. URL: https://www.
nimh.nih.gov/health/statistics/mental-illness [accessed 2022-04-20]
2. Coronavirus disease 2019 ( COVID-19) : situation report, 72. World Health Organization. 2020. URL: https://apps.who.int/
iris/handle/10665/331685 [accessed 2022-04-20]
3. Breslau J, Finucane ML, Locker AR, Baird MD, Roth EA, Collins RL. A longitudinal study of psychological distress in
the United States before and during the COVID-19 pandemic. Prev Med 2021 Feb;143:106362. [doi:
10.1016/j.ypmed.2020.106362] [Medline: 33388325]
https://mental.jmir.org/2023/1/e43253 JMIR Ment Health 2023 | vol. 10 | e43253 | p. 16
(page number not for citation purposes)
XSL• FO
RenderXJMIR MENTAL HEALTH Rochford et al
4. Shore JH, Schneck CD, Mishkind MC. Telepsychiatry and the coronavirus disease 2019 pandemic-current and future
outcomes of the rapid virtualization of psychiatric care. JAMA Psychiatry 2020 Dec 01;77(12):1211-1212. [doi:
10.1001/jamapsychiatry.2020.1643] [Medline: 32391861]
5. Kaveladze B, Chang K, Siev J, Schueller SM. Impact of the COVID-19 pandemic on online obsessive-compulsive disorder
support community members: survey study. JMIR Ment Health 2021 Feb 17;8(2):e26715 [FREE Full text] [doi:
10.2196/26715] [Medline: 33595449]
6. Brülhart M, Klotzbücher V, Lalive R, Reich SK. Mental health concerns during the COVID-19 pandemic as revealed by
helpline calls. Nature 2021 Dec;600(7887):121-126. [doi: 10.1038/s41586-021-04099-6] [Medline: 34789873]
7. Lekkas D, Gyorda JA, Price GD, Wortzman Z, Jacobson NC. Using the COVID-19 pandemic to assess the influence of
news affect on online mental health-related search behavior across the united states: integrated sentiment analysis and the
circumplex model of affect. J Med Internet Res 2022 Jan 27;24(1):e32731 [FREE Full text] [doi: 10.2196/32731] [Medline:
34932494]
8. Maier CA, Riger D, Morgan-Sowada H. "It's splendid once you grow into it:" client experiences of relational teletherapy
in the era of COVID-19. J Marital Fam Ther 2021 Apr;47(2):304-319 [FREE Full text] [doi: 10.1111/jmft.12508] [Medline:
33721348]
9. Cheng Q, Yom-Tov E. Do search engine helpline notices aid in preventing suicide? Analysis of archival data. J Med Internet
Res 2019 Mar 26;21(3):e12235 [FREE Full text] [doi: 10.2196/12235] [Medline: 30912753]
10. Pendse SR, Sharma A, Vashistha A, De Choudhury M, Kumar N. “Can I not be suicidal on a Sunday?”: understanding
technology-mediated pathways to mental health support. In: Proceedings of the 2021 CHI Conference on Human Factors
in Computing Systems. 2021 May Presented at: CHI '21; May 8-13, 2021; Yokohama, Japan p. 1-16. [doi:
10.1145/3411764.3445410]
11. Hodgkinson S, Godoy L, Beers LS, Lewin A. Improving mental health access for low-income children and families in the
primary care setting. Pediatrics 2017 Jan;139(1):e20151175 [FREE Full text] [doi: 10.1542/peds.2015-1175] [Medline:
27965378]
12. Cummings JR, Allen L, Clennon J, Ji X, Druss BG. Geographic access to specialty mental health care across high- and
low-income US communities. JAMA Psychiatry 2017 May 01;74(5):476-484 [FREE Full text] [doi:
10.1001/jamapsychiatry.2017.0303] [Medline: 28384733]
13. Cook BL, Trinh NH, Li Z, Hou SS, Progovac AM. Trends in racial-ethnic disparities in access to mental health care,
2004-2012. Psychiatr Serv 2017 Jan 01;68(1):9-16 [FREE Full text] [doi: 10.1176/appi.ps.201500453] [Medline: 27476805]
14. Ojeda VD, Bergstresser SM. Gender, race-ethnicity, and psychosocial barriers to mental health care: an examination of
perceptions and attitudes among adults reporting unmet need. J Health Soc Behav 2008 Sep;49(3):317-334. [doi:
10.1177/002214650804900306] [Medline: 18771066]
15. Willging CE, Salvador M, Kano M. Brief reports: unequal treatment: mental health care for sexual and gender minority
groups in a rural state. Psychiatr Serv 2006 Jun;57(6):867-870. [doi: 10.1176/ps.2006.57.6.867] [Medline: 16754766]
16. Hoy-Ellis CP, Ator M, Kerr C, Milford J. Innovative approaches address aging and mental health needs in LGBTQ
communities. Generations 2016;40(2):56-62 [FREE Full text] [Medline: 28366982]
17. Snow A, Cerel J, Loeffler DN, Flaherty C. Barriers to mental health care for transgender and gender-nonconforming adults:
a systematic literature review. Health Soc Work 2019 Aug 02;44(3):149-155. [doi: 10.1093/hsw/hlz016] [Medline: 31359065]
18. Vogels EA. Some digital divides persist between rural, urban and suburban America. Pew Research Center. 2021 Aug 19.
URL: https://www.pewresearch.org/fact-tank/2021/08/19/some-digital-divides-persist-between-rural-urban-and-suburban
-america/ [accessed 2022-04-20]
19. Atske S, Perrin A. Home broadband adoption, computer ownership vary by race, ethnicity in the U.S. Pew Research Center.
2021 Jul 16. URL: https://www.pewresearch.org/fact-tank/2021/07/16/home-broadband-adoption-computer-ownership-vary-
by-race-ethnicity-in-the-u-s/ [accessed 2022-04-20]
20. Ramsetty A, Adams C. Impact of the digital divide in the age of COVID-19. J Am Med Inform Assoc 2020 Jul
01;27(7):1147-1148 [FREE Full text] [doi: 10.1093/jamia/ocaa078] [Medline: 32343813]
21. Clare CA. Telehealth and the digital divide as a social determinant of health during the COVID-19 pandemic. Netw Model
Anal Health Inform Bioinform 2021;10(1):26 [FREE Full text] [doi: 10.1007/s13721-021-00300-y] [Medline: 33842187]
22. Zhang D, Shi L, Han X, Li Y, Jalajel NA, Patel S, et al. Disparities in telehealth utilization during the COVID-19 pandemic:
findings from a nationally representative survey in the United States. J Telemed Telecare (forthcoming) 2021 Oct
11:1357633X211051677. [doi: 10.1177/1357633X211051677] [Medline: 34633882]
23. Mental Health Care Health Professional Shortage Areas (HPSAs). KFF. 2019. URL: https://www.kff.org/other/state-indicator/
mental-health-care-health-professional-shortage-areas-hpsas/ [accessed 2022-04-20]
24. Shortage Designation Scoring Criteria. Health Resources and Services Administration. 2020. URL: https://bhw.hrsa.gov/
shortage-designation/hpsa-criteria [accessed 2022-04-20]
25. Baquet CR, Commiskey P, Daniel Mullins C, Mishra SI. Recruitment and participation in clinical trials: socio-demographic,
rural/urban, and health care access predictors. Cancer Detect Prev 2006;30(1):24-33 [FREE Full text] [doi:
10.1016/j.cdp.2005.12.001] [Medline: 16495020]
https://mental.jmir.org/2023/1/e43253 JMIR Ment Health 2023 | vol. 10 | e43253 | p. 17
(page number not for citation purposes)
XSL• FO
RenderXYou can also read