LEAD IN SPICES, HERBAL SUPPLEMENTS, AND CEREMONIAL POWDERS - KIM GAETZ, MSPH, PHD, NC DPH, CHILDREN'S ENVIRONMENTAL HEALTH
←
→
Page content transcription
If your browser does not render page correctly, please read the page content below

Lead in Spices, Herbal Supplements,
     and Ceremonial Powders

      Kim Gaetz, MSPH, PhD, NC DPH, Children’s
               Environmental Health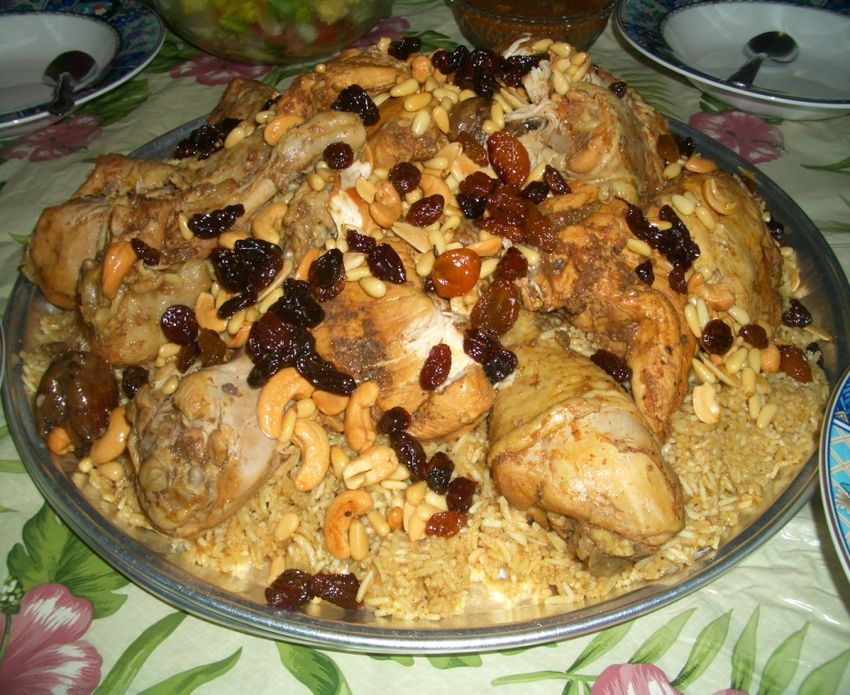

What discoveries have in common?
• Homes/apartments built after 1978
• Children from many nationalities
• Children and mothers who consumed spices,
  supplements and foods positive for lead
• Imported spices part of diet

https://www.ers.usda.gov/data-products/chart-
gallery/gallery/chart-detail/?chartId=79063

Why are some herbs and spices
           contaminated?
• Lead contaminated soils
  – Airborne emissions from leaded gas
  – Pollution, smelters, battery manufacturing plants
• Contamination during processing
• Exterior lead paint
• Intentional adulteration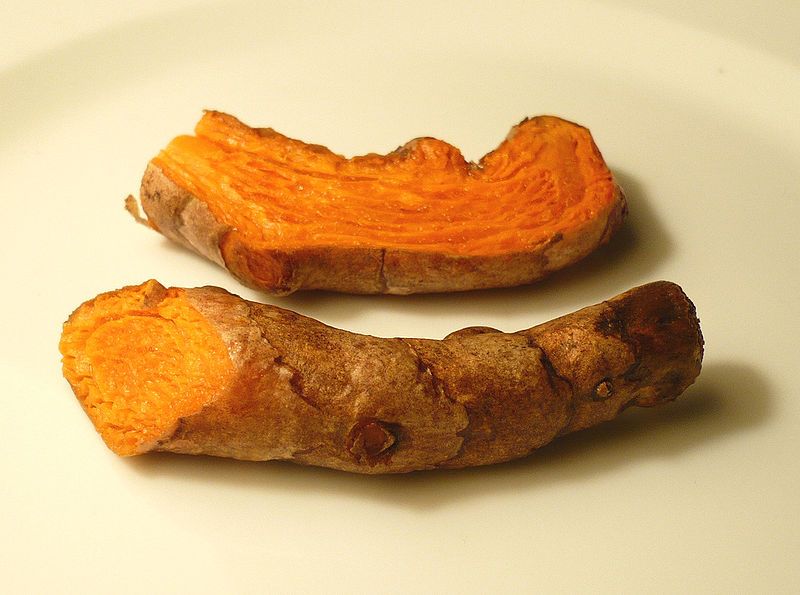
How much lead is
                                                                     unhealthy ?
                                                             •   WHO limit = 0.1 ppm for baby formula

                                                             •   FDA
                                                                  – candies > 0.1 ppm is adulterated
                                                                  – action level = 0.5 ppm for food intended for
                                                                     consumption by children
                                                                  – 10 ppm for other natural‐source food color
                                                                     additives

                                                             •   State of NY
                                                                  – Level of concern= 1 ppm
                                                                  – Class 2 recall= 25 ppm

                                                             Note: 1 ppm= 1 mg/kg when used for the mass of a solid substance
This Photo by Unknown Author is licensed under CC BY-NC-ND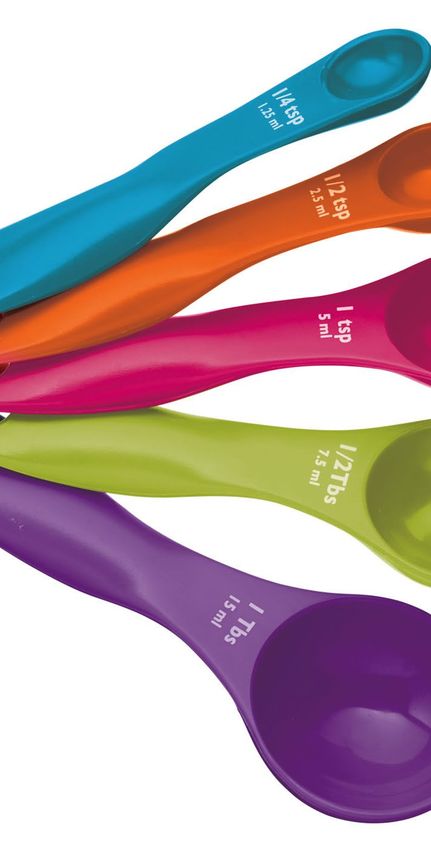
Benefits of Spices

• Useful
   – Medicinal
   – Aromatic
   – Flavorful
• Historical and cultural significance
   – Using spices for thousands of years
   – Binds the culture together
SAMPLING
SPICES AND
CULTURAL
PRODUCTS AT
LEAD
INVESTIGATIONS
Breaking down cultural barriers
• Number one is to find source of lead so your
  child gets better.

• Ask, “What do you think is the source of lead?”

• Listen without judgement.

• Show empathy.

                                  This Photo by Unknown Author is licensed
                                  under CC BY-NC
Questions for parents • Does the child/ mother consume any herbs, vitamins, teas, or supplements from other countries? • Do you use any ceremonial powders? • Do you grow your own spices or herbs? • Has your child consumed any imported candy?
Fill out the
        Spice
       Survey
•    Last page with product
     information is especially
     important

•    Take a picture of each
     product

•    Attach pictures and
     completed survey to the
     Child event in NCLEAD
1. Collect at least 5 – 10 grams to
allow sufficient amount for retesting if
necessary
(up to the 5 to 10 ml mark on the
How Should digestion bottles)
I Sample 2. Fill out a separate chain of custody
form
these 3. Write Sample type= O for “Other”
for all sample types outside the wipes,
Products? paints and soil matrices.
4. Write the name of the spice or
other product in the Sample
description field.NC State Laboratory of
Public Health Process
1. Initial screening using AA-MS
– LOD= 15 mg/kg
– Results available on
https://celr.ncpublichealth.com/envi
ronmental
2. If result is < 15 mg/kg, then run sample
through ICP-MS
– LOD= 0.10 mg/kg
– Results sent to lead investigator
LOD= Limit of detection
AA-MS= Atomic absorption mass spectrometer
ICP-MS= Inductively coupled plasma mass spectrometer
This Photo by Unknown Author is licensed under CC BY-SAWhat do we know about
Lead in spices in NC?
Spice and cultural product sample locationsFrom 2000-2010, our population of Asian Americans grew by 85%! Yee, A. “Asian Americans in North Carolina.” March 2016. Institute for Southern Studies.
Methods
•   Lead investigations: 75 investigations conducted January 1, 2011 to August 1, 2018
    where spices, herbal remedies, or ceremonial powders were sampled
     – NC State Laboratory of Public Health (SLPH) purchased ICP-MS in 2011
     – Gathered from NCLEAD
          • Childhood blood lead levels
          • Lead hazard information from investigation reports
          • Laboratory sample results from NC SLPH

•   Market Basket Samples: Purchased August 23- November 14, 2017
     – Gathered from NC SLPH
          • Laboratory sample results for 50 spices and teas purchased by NC Child intern in 9 Research
             Triangle area stores
Lead Contamination (mg/kg) of Spices and Teas with Known
Country of Purchase (n=155)Spices/ food items containing an
average of ≥1 ppm of lead
Spice Number of Average lead Range (ppm)
samples content (ppm)
Coriander 10 4.37 0.07-39.0
Cumin 22 1.46 0.07-9.80
Cinnamon 3 1.76 0.07-2.70
Candy 5 10.6 0.04-25.9
Turmeric 38 117 0.06- 890
Baby cereal 2 17.6 1.2-34.0
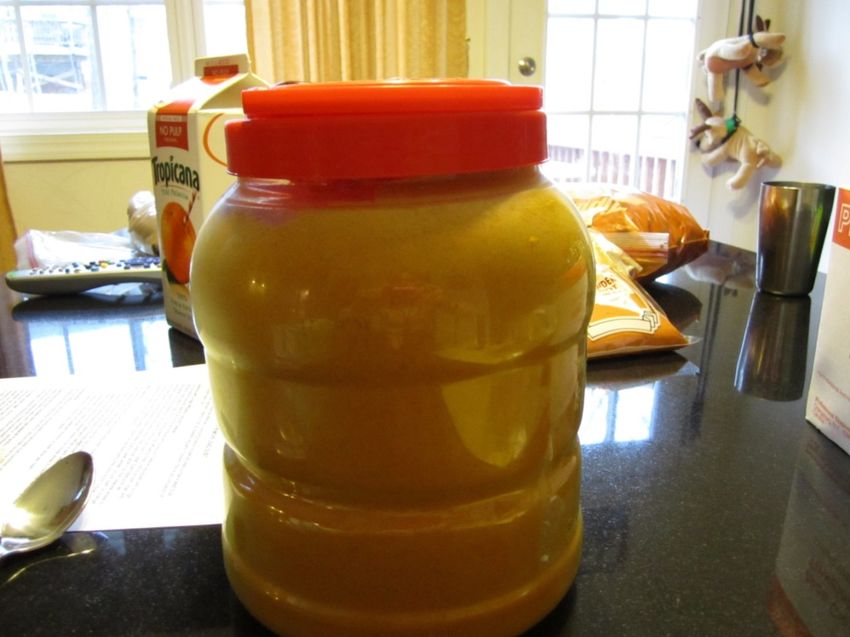
Salt 4 6.63 0.07-26.0Turmeric from India
890 ppmTurmeric from India • Grown near Nepal • Root crushed in iron container with a hammer • Dried in the sun for 3-4 days • Mailed to family and consumed for > 1 year • Used on dried beans, vegetables and lentils • .16 - .79 ppm sold in retail stores
Ground Cloves
•   23 ppm from Indian Store locally
•   Grown in India, Pakistan, Sri Lanka
•   Consumed for digestive problems
•   Used to treat morning sickness
    with ginseng.
Cinnamon
2.5ppm
• Infant consumed ¼ tsp to ½ tsp on mashed sweet
potato, oatmeal, mashed bananas for 6 months
• Ate oatmeal 1 X a day, mashed bananas, sweet potato
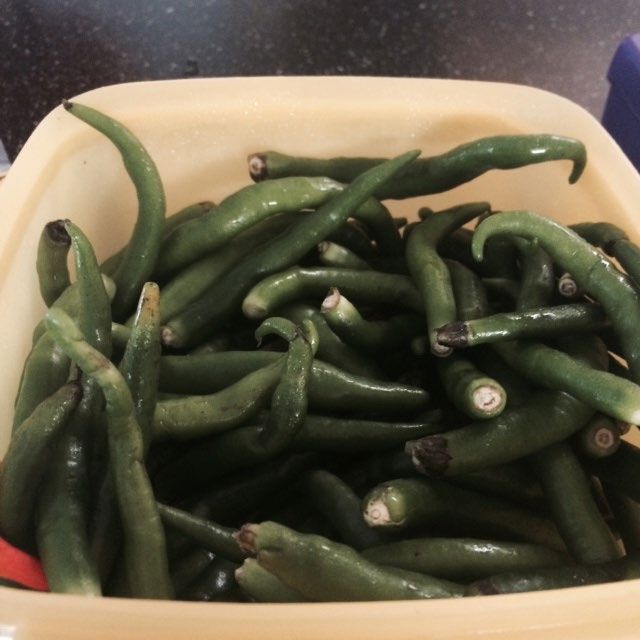
3 X per weekChilies
21 ppm chilito en polvo
1.4 ppm
3.99 ppm chili garlic
sauceStone Flower
• Lichen used to flavor and thicken meals
• Also known as dagad phool, poota,
kalpasi, Rathipachi, Kallupachi, Celeyam
• Result=37.5 ppm leadAsafoetida powder • Aids digestion, relieves colic, and other medicinal uses • Ground giant fennel • 1 ppm
Teas
• Chamomile, tilia,
  orange pekoe tea
  .26-.78 ppm

• Mojhat
  ceremonial
  drink-31ppm
  • Aids digestion and milk
    production; pregnancy
Masala .96 ppm Sindhi Briyani .401 ppm Chole Masala .246 ppm Garam Masala
Malunggay leaves

Nursing mom
.337 ppm
Kabsa spice
• 19 ppm
• black pepper,
  saffron, cinnamon,
  cloves, nutmeg,
  bay leaves
Dietary Supplement
          Balguti Kesaria
• Child consumed 2 pills/day for 3
  months for cough and digestion

• Did not reach milestones

• 220ppm of lead
Folk Art and Ceremonial Powder
Rangoli
• Indian Folk art
• Rice, flour, sand
• Turmeric, sindoor (facial cosmetic) - colors
  can be added

  4.15 ppm
Rangoli

Lead Levels:
• 110 μg/ft2 on sidewalk
• 54 μg/ft2 inside apartment, front entry
• Sample tested 1.6 ppm
• Used specialized cleaning techniques
• Now using sidewalk chalk
Kumkum

• Ceremonial powder
  from India

• Results as high as
  140,000 ppm of lead
• 38 μg/ft2 floor by worship table
  combination of kumkum and
  saffron

• Saffron - 16% lead by weight
Non-food substances also
            containing ≥ 1 ppm of lead
Substance         Number of    Average lead   Range (ppm)
                  samples     content (ppm)

Rangoli (chalk)   2           2.88            1.60- 4.15
Sindoor           7           47,315          1.9- 130,000
Kum kum           13          11,379          0.41- 140,000
Surma/ Kohl       1           68,000          N/A
Incense           4           6.98            1.9-15.7
Pooja Powder      1           65              N/A
Vibuti            3           80.3            2.9-140
The Dilemma: Modeling vs. Real Life Amounts and frequency of consumption
Blood lead levels of Children (BLL)
              (n=78)
Test Type        Average (µg/dL) Minimum               Maximum
                                 (µg/dL)               (µg/dL)

Screening        17.3               5                  64

Diagnostic       15.0               4                  46

Samples for the child with the highest levels all came back < 1 ppm. No
paint hazards were found.
Next Steps Lead investigators use survey to measure spice and herbal remedy intake in children during lead investigation Re-evaluate dietary and laboratory data with better source data
Acknowledgements
• Lead and Healthy Homes Taskforce
• Christy Klaus and Jason Dunn, REHS, Wake
  County Environmental Health Services
• Deidre Bean, Kansas State University
• Ezan Chaudhry, UNC- Chapel Hill
• Chelsea Cary, University of Georgia- Athens
• Molly Wilson, Meredith College
• Tasharra Kenion , REHS, Mecklenburg County
  Health Department
• Ed Norman, MPH, NC Division of Public Health
Questions

Kim Gaetz, MSPH, PhD
kim.gaetz@dhhs.nc.gov
919-707-5953
You can also read


