Knowledge graph embedding for data mining vs. knowledge graph embedding for link prediction - two sides of the same coin? - IOS Press
←
→
Page content transcription
If your browser does not render page correctly, please read the page content below
Semantic Web 13 (2022) 399–422                                                                                                           399
DOI 10.3233/SW-212892
IOS Press

Knowledge graph embedding for data mining
vs. knowledge graph embedding for link
prediction – two sides of the same coin?
Jan Portisch a,b , Nicolas Heist a and Heiko Paulheim a,*
a Dataand Web Science Group, University of Mannheim, Germany
E-mails: jan@informatik.uni-mannheim.de, nico@informatik.uni-mannheim.de,
heiko@informatik.uni-mannheim.de
b SAP SE, Germany

E-mail: jan.portisch@sap.com

Editors: Mehwish Alam, FIZ Karlsruhe – Leibniz Institute for Information Infrastructure, Germany; Davide Buscaldi, LIPN, Université
Sorbonne Paris Nord, France; Michael Cochez, Vrije University of Amsterdam, the Netherlands; Francesco Osborne, Knowledge Media
Institute, (KMi), and The Open University, UK; Diego Reforgiato Recupero, University of Cagliari, Italy; Harald Sack, FIZ Karlsruhe – Leibniz
Institute for Information Infrastructure, Germany
Solicited reviews: Angelo Salatino, The Open University, UK; Paul Groth, University of Amsterdam, Netherlands; Five anonymous reviewers

Abstract. Knowledge Graph Embeddings, i.e., projections of entities and relations to lower dimensional spaces, have been
proposed for two purposes: (1) providing an encoding for data mining tasks, and (2) predicting links in a knowledge graph. Both
lines of research have been pursued rather in isolation from each other so far, each with their own benchmarks and evaluation
methodologies. In this paper, we argue that both tasks are actually related, and we show that the first family of approaches can
also be used for the second task and vice versa. In two series of experiments, we provide a comparison of both families of
approaches on both tasks, which, to the best of our knowledge, has not been done so far. Furthermore, we discuss the differences
in the similarity functions evoked by the different embedding approaches.

Keywords: Knowledge graph embedding, link prediction, data mining, RDF2vec, KGlove, node2vec, DeepWalk, TransE,
TransR, RotatE, RESCAL, DistMult, ComplEx

1. Introduction

   In the recent past, the topic of knowledge graph embedding – i.e., projecting entities and relations in a knowledge
graph into a numerical vector space – has gained a lot of traction. An often cited survey from 2017 [42] lists already
25 approaches, with new models being proposed almost every month, as depicted in Fig. 1.
   Even more remarkably, two mostly disjoint strands of research have emerged in that vivid area. The first family of
research works focus mostly on link prediction [12], i.e., the approaches are evaluated in a knowledge graph refine-
ment setting [24]. The optimization goal here is to distinguish correct from incorrect triples in the knowledge graph

  * Corresponding author. E-mail: heiko@informatik.uni-mannheim.de.

1570-0844 © 2022 – The authors. Published by IOS Press. This is an Open Access article distributed under the terms of the
Creative Commons Attribution License (CC BY 4.0).
400         J. Portisch et al. / Knowledge graph embedding for data mining vs. knowledge graph embedding for link prediction

  Fig. 1. Publications with Knowledge Graph Embedding in their title or abstract, created with dimensions.ai (as of November 15th, 2021).

as accurately as possible. The evaluations of this kind of approaches are always conducted within the knowledge
graph, using the existing knowledge graph assertions as ground truth.
   A second strand of research focuses on the embedding of entities in the knowledge graph for downstream tasks
outside the knowledge graph, which often come from the data mining field – hence, we coin this family of ap-
proaches embeddings for data mining. Examples include: the prediction of external variables for entities in a knowl-
edge graph [30], information retrieval backed by a knowledge graph [36], or the usage of a knowledge graph in
content-based recommender systems [32]. In those cases, the optimization goal is to create an embedding space
which reflects semantic similarity as well as possible (e.g., in a recommender system, similar items to the ones in
the user interest should be recommended). The evaluations here are always conducted outside the knowledge graph,
based on external ground truth.
   In this paper, we want to look at the commonalities and differences of the two approaches. We look at two of
the most basic and well-known approaches of both strands, i.e., TransE [4] and RDF2vec [30], and analyze and
compare their optimization goals in a simple example. Moreover, we analyze the performance of approaches from
both families in the respective other evaluation setup: we explore the usage of link-prediction based embeddings
for other downstream tasks based on similarity, and we propose a link prediction method based on node embedding
techniques such as RDF2vec. From those experiments, we derive a set of insights into the differences of the two
families of methods, and a few recommendations on which kind of approach should be used in which setting.

2. Related work

   As pointed out above, the number of works on knowledge graph embedding is legion, and enumerating them
all in this section would go beyond the scope of this paper. However, there have already been quite a few survey
articles.
   The first strand of research works – i.e., knowledge graph embeddings for link prediction – has been covered in
different surveys, such as [42], and, more recently, [8,14,33]. The categorization of approaches in those reviews is
similar, as they distinguish different families of approaches: translational distance models [42] or geometric models
[33] focus on link prediction as a geometric task, i.e., projecting the graph in a vector space so that a translation
operation defined for relation r on a head h yields a result close to the tail t.
   The second family among the link prediction embeddings are semantic matching [42] or matrix factorization or
tensor decomposition [33] models. Here, a knowledge graph is represented as a three-dimensional tensor, which is
decomposed into smaller tensors and/or two-dimensional matrices. The reconstruction operation can then be used
for link prediction.
   The third and youngest family among the link prediction embeddings are based on deep learning and graph neural
networks. Here, neural network training approaches, such as convolutional neural networks, capsule networks, or
recurrent neural networks, are adapted to work with knowledge graphs. They are generated by training a deep neural
network. Different architectures exist (based on convolutions, recurrent layers, etc.), and the approaches also differ
in the training objective, e.g., performing binary classification into true and false triples, or predicting the relation
of a triple, given its subject and object. [33].
J. Portisch et al. / Knowledge graph embedding for data mining vs. knowledge graph embedding for link prediction           401

   While most of those approaches only consider graphs with nodes and edges, most knowledge graphs also contain
literals, e.g., strings and numeric values. Recently, approaches combining textual information with knowledge graph
embeddings using language modeling techniques have also been proposed, using techniques such as word2vec and
convolutional neural networks [45] or transformer methods [9,43]. [11] shows a survey of approaches which take
such literal information into account. It is also one of the few review articles which considers embedding methods
from the different research strands.
   Link prediction is typically evaluated on a set of standard datasets, and uses a within-KG protocol, where the
triples in the knowledge graph are divided into a training, testing, and validation set. Prediction accuracy is then
assessed on the validation set. Datasets commonly used for the evaluation are FB15k, which is a subset of Freebase,
and WN18, which is derived from WordNet [4]. Since it has been remarked that those datasets contain too many
simple inferences due to inverse relations, the more challenging variants FB15k-237 [39] and WN18RR [10] have
been proposed. More recently, evaluation sets based on larger knowledge graphs, such as YAGO3-10 [10] and
DBpedia50k/DBpedia500k [34] have been introduced.
   The second strand of research works, focusing on the embedding for downstream tasks (which are often from the
domain of data mining), is not as extensively reviewed, and the number of works in this area are still smaller. One of
the more comprehensive evaluations is shown in [7], which is also one of the rare works which includes approaches
from both strands in a common evaluation. They show that at least the three methods for link prediction used –
namely TransE, TransR, and TransH – perform inferior on downstream tasks, compared to approaches developed
specifically for optimizing for entity similarity in the embedding space.
   A third, yet less closely related strand of research works is node embeddings for homogeneous graphs, such as
node2vec and DeepWalk. While knowledge graphs come with different relations and are thus considered heteroge-
neous, approaches for homogeneous graphs are sometimes used on knowledge graphs as well by first transforming
the knowledge graph into an unlabeled graph, usually by ignoring the different types of relations. Since some of the
approaches are defined for undirected graphs, but knowledge graphs are directed, those approaches may also ignore
the direction of edges.
   For the evaluation of entity embeddings for data mining, i.e., optimized for capturing entity similarity, there are
quite a few use cases at hand. The authors in [25] list a number of tasks, including classification and regression
of entities based on external ground truth variables, entity clustering, as well as identifying semantically related
entities.
   Most of the above mentioned strands exist mainly in their own respective “research bubbles”. Table 1 shows
a co-citation analysis of the different families of approaches. It shows that the Trans* family, together with other
approaches for link prediction, forms its own citation network, so do the approaches for homogeneous networks,
while RDF2vec and KGlove are less clearly separated.
   Works which explicitly compare approaches from the different research strands are still rare. In [48], the authors
analyze the vector spaces of different embedding models with respect to class separation, i.e., they fit the best linear

                                                                   Table 1
Co-citation likelihood of different embeddings approaches, obtained from Google scholar, July 12th, 2021. An entry (row,column) in the table
reads as: this fraction of the papers citing column also cites row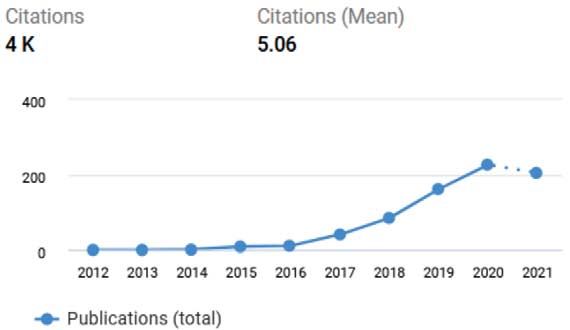
402            J. Portisch et al. / Knowledge graph embedding for data mining vs. knowledge graph embedding for link prediction

separation between classes in different embedding spaces. According to their findings, RDF2vec achieves a better
linear separation than the models tailored to link prediction.
   In [6], an in-KG scenario, i.e., the detection and correction of erroneous links, is considered. The authors compare
RDF2vec (with an additional classification layer) to TransE and DistMult on the link prediction task. The results are
mixed: While RDF2vec outperforms TransE and DistMult in terms of Mean Reciprocal Rank and Precision@1, it
is inferior in Precision@10. Since the results are only validated on one single dataset, the evidence is rather thin.
   Most other research works in which approaches from different strands are compared are related to different
downstream tasks. In many cases, the results are rather inconclusive, as the following examples illustrate:
   – [5] and [15] both analyze drug drug interaction, using different sets of embedding methods. The finding of [5]
     is that RDF2vec outperforms TransE and TransD, whereas in the experiment in [15], ComplEx outperforms
     RDF2vec, KGlove, TransE, and CrossE, and, in particular, TransE outperforms RDF2vec.
   – [3,6], and [44] all analyze link prediction in different graphs. While [3] state that RotatE and TransD outperform
     TransE, DistMult, and ComplEx, which in turn outperforms node2vec, [6] reports that DistMult outperforms
     RDF2vec, which in turn outperforms TransE, while [44] reports that KG2vec (which can be considered equiv-
     alent to RDF2vec) outperforms node2vec, which in turn outperforms TransE.
   – [2] compare the performance of RDF2vec, DistMult, TransE, and SimplE on a set of classification and clus-
     tering datasets. The results are mixed. For classification, the authors use four different learning algorithms,
     and the variance induced by the learning algorithms is most often higher than that induced by the embedding
     method. For the clustering, they report that TransE outperforms the other approaches.1
While this is not a comprehensive list, these observations hint at a need both for more task-specific benchmark
datasets as well as for ablation studies analyzing the interplay of embedding methods and other processing steps.
Moreover, it is important to gain a deeper understanding of how these approaches behave with respect to different
downstream problems, and to have more direct comparisons. This paper aims at closing the latter gap.

3. Knowledge graph embedding methods for data mining

   Traditionally, most data mining methods are working on propositional data, i.e., each instance is a row in a table,
described by a set of (binary, numeric, or categorical) features. For using knowledge graphs in data mining, one
needs to either develop methods which work on graphs instead of propositional data, or find ways to represent
instances of the knowledge graph as feature vectors [31]. The latter is often referred to as propositionalization [29].
   RDF2vec [30] is a prominent example from the second family. It adapts the word2vec approach [22] for deriv-
ing word embeddings (i.e., vector representations for words) from a corpus of sentences. RDF2vec creates such
sentences by performing random walks on an RDF graph and collecting the sequences of entities and relations,
then trains a word2vec model on those sequences. It has been shown that this strategy outperforms other strategies
of propositionalization. The relation between propositionalization and embedding methods has also recently been
pointed out by [17].

3.1. Data mining is based on similarity

   Predictive data mining tasks are predicting classes or numerical values for instances. Typically, the target is to
predict an external variable not contained in the knowledge graph (or, to put it differently: use the background infor-
mation from the knowledge graph to improve prediction models). One example would be to predict the popularity
of an item (e.g., a book, a music album, a movie) as a numerical value. The idea here would be that two items which
share similar features should also receive similar ratings. The same mechanism is also exploited in recommender

   1 We think that these results must be taken with a grain of salt. To evaluate the clustering quality, the authors use an intrinsic evaluation metric,
i.e., Silhouette score, which is computed in the respective vector space. It is debatable, however, whether Silhouette scores computed in different
vector spaces are comparable.
J. Portisch et al. / Knowledge graph embedding for data mining vs. knowledge graph embedding for link prediction 403
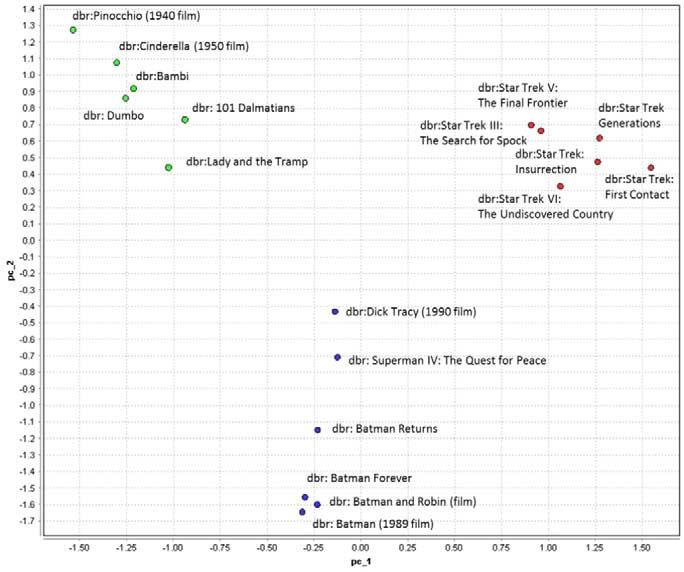
Fig. 2. RDF2vec embeddings for movies in DBpedia, from [32].
systems: if two items share similar features, users who consumed one of those items are recommended the other
one.
RDF2vec has been shown to be usable for such cases, since the underlying method tends to create similar vectors
for similar entities, i.e., position them closer in vector space [32]. Figure 2 illustrates this using a 2D PCA plot
of RDF2vec vectors for movies in DBpedia. It can be seen that clusters of movies, e.g., Disney movies, Star Trek
movies, and Marvel related movies are formed.
Many techniques for predictive data mining rely on similarity in one or the other way. This is more obvious for,
e.g., k-nearest neighbors, where the predicted label for an instance is the majority or average of labels of its closest
neighbors (i.e., most similar instances), or Naive Bayes, where an instance is predicted to belong to a class if its
feature values are most similar to the typical distribution of features for this class (i.e., it is similar to an average
member of this class). A similar argument can be made for neural networks, where one can assume a similar output
when changing the value of one input neuron (i.e., one feature value) by a small delta. Other classes of approaches
(such as Support Vector Machines) use the concept of class separability, which is similar to exploiting similarity:
datasets with well separable classes have similar instances (belonging to the same class) close to each other, while
dissimilar instances (belonging to different classes) are further away from each other [38].
3.2. Creating similar embeddings for similar instances
To understand how (and why) RDF2vec creates embeddings that project similar entities to nearby vectors, we use
the running example depicted in Fig. 3 and Fig. 4, showing a number of European cities, countries, and heads of
those governments.
As discussed above, the first step of RDF2vec is to create random walks on the graph. To that end, RDF2vec
starts a fixed number of random walks of a fixed maximum length from each entity. Since the example above is very
small, we will, for the sake of illustration, enumerate all walks of length 4 that can be created for the graph. Those
walks are depicted in Fig. 5. It is notable that, since the graph has nodes without outgoing edges, some of the walks
are actually shorter than 4.
In the next step, the walks are used to train a predictive model. Since RDF2vec uses word2vec, it can be trained
with the two flavors of word2vec, i.e., CBOW (context back of words) and SG (skip gram). The first predicts a word,
given its surrounding words, the second predicts the surroundings, given a word. For the sake of our argument, we
will only consider the second variant, depicted in Fig. 6. Simply speaking, given training examples where the input
is the target word (as a one-hot-encoded vector) and the output is the context words (again, one hot encoded vectors),404 J. Portisch et al. / Knowledge graph embedding for data mining vs. knowledge graph embedding for link prediction
Fig. 3. Example graph used for illustration.
Berlin locatedIn Germany .
Germany headOfGovernment Angela_Merkel .
Mannheim locatedIn Germany .
Belgium capital Brussels .
Germany partOf EU .
Belgium partOf EU .
Belgium headOfGovernment Sophie_Wilmes .
EU governmentSeat Brussels .
USA capital WashingtonDC .
WashingtonDC locatedIn USA .
France capital Paris .
France headOfGovernment Emmanuel_Macron .
Paris locatedIn France .
Strasbourg locatedIn France .
Germany capital Berlin .
Brussels locatedIn Belgium .
France partOf EU .
USA headOfGovernment Donald_Trump .
EU governmentSeat Strasbourg .
Fig. 4. Triples of the example knowledge graph.
a neural network is trained, where the hidden layer is typically of smaller dimensionality than the input. That hidden
layer is later used to produce the actual embedding vectors.
To create the training examples, a window with a given size is slid over the input sentences. Here, we use a
window of size 2, which means that the two words preceding and the two words succeeding a context word are
taken into consideration. Table 2 shows the training examples generated for three instances.
A model that learns to predict the context given the target word would now learn to predict the majority of the
context words for the target word at hand at the output layer called output in Fig. 6, as depicted in the lower part
of Table 2. Here, we can see that Paris and Berlin share two out of four predictions, so do Mannheim and Berlin.
Angela Merkel and Berlin share one out of four predictions.2
2 Note that in the classic formulation of RDF2vec (and word2vec), the position at which a prediction appears does not matter. The order-aware
variant RDF2vecoa [27] uses an order-aware formulation of word2vec [20].J. Portisch et al. / Knowledge graph embedding for data mining vs. knowledge graph embedding for link prediction 405
Belgium partOf EU governmentSeat Brussels
Belgium capital Brussels locatedIn Belgium
Belgium partOf EU governmentSeat Strasbourg
Belgium headOfGovernment Sophie_Wilmes
Berlin locatedIn Germany capital Berlin
Berlin locatedIn Germany headOfGovernment Angela_Merkel
Berlin locatedIn Germany partOf EU
Brussels locatedIn Belgium headOfGovernment Sophie_Wilmes
Brussels locatedIn Belgium partOf EU
Brussels locatedIn Belgium capital Brussels
EU governmentSeat Strasbourg locatedIn France
EU governmentSeat Brussels locatedIn Belgium
France headOfGovernment Emmanuel_Macron
France capital Paris locatedIn France
France partOf EU governmentSeat Brussels
France partOf EU governmentSeat Strasbourg
Germany partOf EU governmentSeat Brussels
Germany partOf EU governmentSeat Strasbourg
Germany capital Berlin locatedIn Germany
Germany headOfGovernment Angela_Merkel
Mannheim locatedIn Germany capital Berlin
Mannheim locatedIn Germany headOfGovernment Angela_Merkel
Mannheim locatedIn Germany partOf EU
Paris locatedIn France headOfGovernment Emmanuel_Macron
Paris locatedIn France partOf EU
Paris locatedIn France capital Paris
Strasbourg locatedIn France capital Paris
Strasbourg locatedIn France headOfGovernment Emmanuel_Macron
Strasbourg locatedIn France partOf EU
USA headOfGovernment Donald_Trump
USA capital Washington_DC locatedIn USA
Washington_DC locatedIn USA capital Washington_DC
Washington_DC locatedIn USA headOfGovernment Donald_Trump
Fig. 5. Walks extracted from the example graph.
Fig. 6. The skip gram variant of word2vec [30].
Considering again Fig. 6, given that the activation function which computes the output from the projection val-
ues is continuous, it implies that similar activations on the output layer requires similar values on the projection
layer. Hence, for a well fit model, the distance on the projection layer of Paris, Berlin, and Mannheim should be
comparatively lower than the distance of the other entities, since they activate similar outputs.3
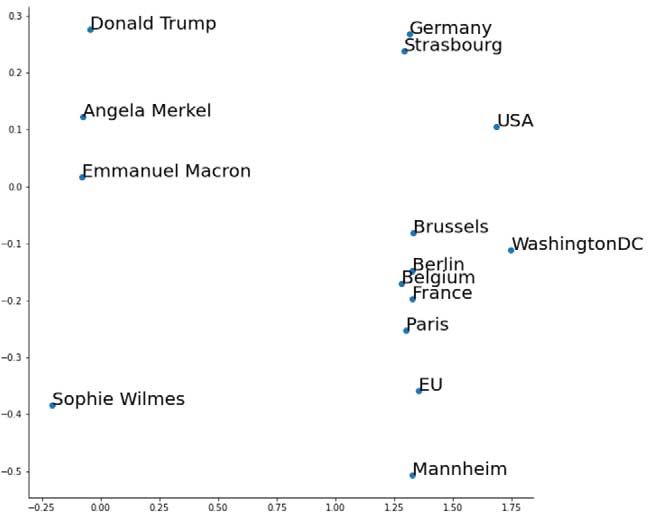
Figure 7 depicts a two-dimensional RDF2vec embedding learned for the example graph.4 We can observe that
there are clusters of persons, countries, and cities. The grouping of similar objects also goes further – we can, e.g.,
3 Note that there are still weights learned for the individual connections between the projection and the output layer, which emphasize some
connections more strongly than others. Hence, we cannot simplify our argumentation in a way like “with two common context words activated,
the entities must be projected twice as close as those with one common context word activated”.
4 Created with PyRDF2vec [41], using two dimensions, a walk length of 8, and standard configuration otherwise.406 J. Portisch et al. / Knowledge graph embedding for data mining vs. knowledge graph embedding for link prediction
Table 2
Training examples for instances Paris, Berlin, Mannheim, Angela Merkel, Donald Trump, and Belgium (upper part) and majority predictions
(lower part)
Target word w−2 w−1 w+1 w+2
Paris France capital locatedIn France
Paris – – locatedIn France
Paris – – locatedIn France
Paris – – locatedIn France
Paris France capital – –
Paris France capital – –
Berlin – – locatedIn Germany
Berlin Germany capital – –
Berlin – – locatedIn Germany
Berlin – – locatedIn Germany
Berlin Germany capital locatedIn Germany
Berlin Germany capital – –
Mannheim – – locatedIn Germany
Mannheim – – locatedIn Germany
Mannheim – – locatedIn Germany
Angela Merkel Germany headOfGovernment – –
Angela Merkel Germany headOfGovernment – –
Angela Merkel Germany headOfGovernment – –
Donald Trump USA headOfGovernment – –
Donald Trump USA headOfGovernment – –
Belgium – – partOf EU
Belgium – – capital Brussels
Belgium Brussels locatedIn – –
Belgium – – partOf EU
Belgium – – headOfGovernment Sophie Wilmes
Belgium Brussels locatedIn headOfGovernment Sophie Wilmes
Belgium Brussels locatedIn partOf EU
Belgium Brussels locatedIn capital Brussels
Belgium Brussels locatedIn – –
Paris France capital locatedIn France
Berlin Germany capital locatedIn Germany
Mannheim – – locatedIn Germany
Angela Merkel Germany headOfGovernment – –
Donald Trump USA headOfGovernment – –
Belgium Brussels locatedIn partOf EU
observe that European cities in the dataset are embedded closer to each other than to Washington D.C. This is in
line with previous observations showing that RDF2vec is particularly well suited in creating clusters also for finer-
grained classes [35]. A predictive model could now exploit those similarities, e.g., for type prediction, as proposed
in [16] and [35].
3.3. Usage for link prediction
From Fig. 7, we can assume that link prediction should, in principle, be possible. For example, the predictions
for heads of governments all point in a similar direction. This is in line with what is known about word2vec, whichJ. Portisch et al. / Knowledge graph embedding for data mining vs. knowledge graph embedding for link prediction 407
Fig. 7. The example graph embedded with RDF2vec.
allows for computing analogies, like the well-known example
v(King) − v(Man) + v(Woman) ≈ v(Queen) (1)
RDF2vec does not learn relation embeddings, only entity embeddings.5 Hence, we cannot directly predict links,
but we can exploit those analogies. If we want to make a tail prediction like
h, r, ?, (2)
we can identify another pair h , r, t and exploit the above analogy, i.e.,
t − h + h ≈ t (3)
To come to a stable prediction, we would use the average, i.e.,
h ,r,t t − h + h
t≈ , (4)
|h , r, t |
where |h , r, t | is the number of triples which have r as predicate.
With the same idea, we can also average the relation vectors r for each relation that holds between all its head
and tail pairs, i.e.,
h ,r,t t − h
r≈ , (5)
|h , r, t |
and thereby reformulate the above equation to
t ≈ h + r, (6)
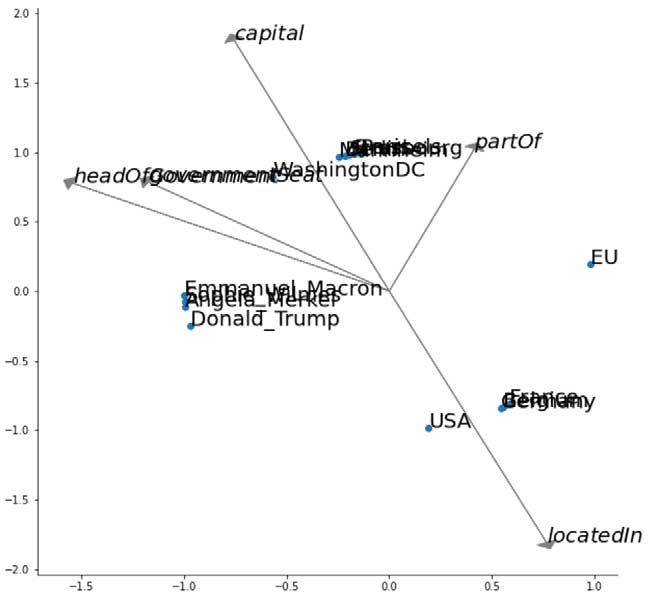
which is what we expect from an embedding model for link prediction. Those approximate relation vectors for the
example at hand are depicted in Fig. 8. We can see that in some (not all) cases, the directions of the vectors are
5 Technically, we can also make RDF2vec learn embeddings for the relations, but they would not behave the way we need them.408 J. Portisch et al. / Knowledge graph embedding for data mining vs. knowledge graph embedding for link prediction
Fig. 8. Average relation vectors for the example.
approximately correct: the partOf vector is roughly the difference between EU and Germany, France, and Belgium,
and the headOfGovernment vector is approximately the vector between the countries and the politicians cluster.
It can also be observed that the vectors for locatedIn and capitalOf point in reverse directions, which makes sense
because they form connections between two clusters (countries and cities) in opposite directions.
4. Knowledge graph embedding methods for link prediction
A larger body of work has been devoted on knowledge graph embedding methods for link prediction. Here, the
goal is to learn a model which embeds entities and relations in the same vector space.
4.1. Link prediction is based on vector operations
As the main objective is link prediction, most models, more or less, try to find a vector space embedding of
entities and relations so that
t ≈h⊕r (7)
holds for as many triples h, r, t as possible. ⊕ can stand for different operations in the vector space; in basic
approaches, simple vector addition (+) is used. In our considerations below, we will also use vector addition.
In most approaches, negative examples are created by corrupting an existing triple, i.e., replace the head or tail
with another entity from the graph (some approaches also foresee corrupting the relation). Then, a model is learned
which tries to tell apart corrupted from non-corrupted triples. The formulation in the original TransE paper [4]
defines the loss function L as follows:
L= γ + d(h + r, t) − d h + r, t + (8)
(h,r,t)∈S,
(h ,r,t )∈S
where γ is some margin, and d is a distance function, i.e., the L1 or L2 norm. S is the set of statements that are
in the knowledge graph, and S are the corrupted statements derived from them. In words, the formula states for a
triple h, r, t, h + r should be closer to t than to t for some corrupted tail, similarly for a corrupted head. However,
a difference of γ is accepted.J. Portisch et al. / Knowledge graph embedding for data mining vs. knowledge graph embedding for link prediction 409
Fig. 9. Example graph embedded by TransE.
Figure 9 shows the example graph from above, as embedded by TransE.6 Looking at the relation vectors, it can
be observed that they seem approximately accurate in some cases, e.g.,
Germany + headOfGovernment ≈ Angela_Merkel,
but not everywhere.7
Like in the RDF2vec example above, we can observe that the two vectors for locatedIn and capital point in
opposite directions. Also similar to the RDF2vec example, we can see that entities in similar classes form clusters:
cities are mostly in the upper part of the space, people in the left, countries in the lower right part.
4.2. Usage for data mining
As discussed above, positioning similar entities close in a vector space is an essential requirement for using entity
embeddings in data mining tasks. To understand why an approach tailored towards link prediction can also, to a
certain extent, cluster similar instances together (although not explicitly designed for this task), we first rephrase the
approximate link prediction Equation (8) as
t = h + r + ηh,r,t , (9)
where ηh,r,t can be considered an error term for the triple h, r, t. Moreover, we define
ηmax = max ηh,r,t (10)
h,r,t∈S
6 Created with PyKEEN [1], using 128 epochs, a learning rate of 0.1, the softplus loss function, and default parameters otherwise, as advised
by the authors of PyKEEN: https://github.com/pykeen/pykeen/issues/97.
7 This does not mean that TransE does not work. The training data for the very small graph is rather scarce, and two dimensions might not be
sufficient to find a good solution here.410 J. Portisch et al. / Knowledge graph embedding for data mining vs. knowledge graph embedding for link prediction
Next, we consider two triples h1 , r, t and h2 , r, t, which share a relation to an object – e.g., in our example,
France and Belgium, which both share the relation partOf to EU. In that case,
t = h1 + r + ηh1 ,r,t (11)
and
t = h2 + r + ηh2 ,r,t (12)
hold. From that, we get8
h1 − h2 = ηh2 ,r,t − ηh1 ,r,t
⇒ |h1 − h2 | = |ηh2 ,r,t − ηh1 ,r,t |
= ηh2 ,r,t + (−ηh1 ,r,t )
(13)
|ηh2 ,r,t | + | − ηh1 ,r,t |
= |ηh2 ,r,t | + |ηh1 ,r,t |
2 · ηmax
In other words, ηmax also imposes an upper bound of two entities sharing a relation to an object. As a consequence,
the lower the error in relation prediction, the closer are entities which share a common statement.
This also carries over to entities sharing the same two-hop connection. Consider two further triples h1a , ra , h1
and h2a , ra , h2 . In our example, this could be two cities located in the two countries, e.g., Strasbourg and Brussels.
In that case, we would have
h1 = h1a + ra + ηh1a ,ra ,h1 (14)
h2 = h2a + ra + ηh2a ,ra ,h2 (15)
Substituting this in (11) and (12) yields
t = h1a + ra + ηh1a ,ra ,h1 + r + ηh1 ,r,t (16)
t = h2a + ra + ηh2a ,ra ,h2 + r + ηh2 ,r,t . (17)
Consequently, using similar transformations as above, we get
h1a − h2a = ηh2a ,ra ,h2 − ηh1a ,ra ,h1 + ηh2 ,r,t − ηh1 ,r,t
(18)
⇒ |h1a − h2a | 4 · ηmax
Again, ηmax constrains the proximity of the two entities h1a and h2a , but only half as strictly as for the case of h1
and h2 .
4.3. Comparing the two notions of similarity
In the examples above, we can see that embeddings for link prediction have a tendency to project similar instances
close to each other in the vector space. Here, the notion of similarity is that two entities are similar if they share a
relation to another entity, i.e., e1 and e2 are considered similar if there exist two statements e1 , r, t and e2 , r, t or
8 Using the triangle inequality for the first inequation.J. Portisch et al. / Knowledge graph embedding for data mining vs. knowledge graph embedding for link prediction 411
h, r, e1 and h, r, e2 ,9 or, less strongly, if there exists a chain of such statements. More formally, we can write the
notion of similarity between two entities in link prediction approaches as
e1 ≈ e2 ← ∃t, r : r(e1 , t) ∧ r(e2 , t) (19)
e1 ≈ e2 ← ∃h, r : r(h, e1 ) ∧ r(h, e2 ) (20)
In other words: two entities are similar if they share a common connection to a common third entity.
RDF2vec, on the other hand, covers a wider range of such similarities. Looking at Table 2, we can observe that
two entities sharing a common relation to two different objects are also considered similar (Berlin and Mannheim
both share the fact that they are located in Germany, hence, their predictions for w+1 and w+2 are similar).
However, there in RDF2vec, similarity can also come in other notions. For example, Germany and USA are
also considered similar, because they both share the relations headOfGovernment and capital, albeit with different
object (i.e., their prediction for w1 is similar). In contrast, such similarities do not lead to close projections for link
prediction embeddings. In fact, in Fig. 9, it can be observed that USA and Germany are further away than Germany
and other European countries. In other words, the following two notions of similarity also hold for RDF2vec:
e1 ≈ e2 ← ∃t1 , t2 , r : r(e1 , t1 ) ∧ r(e2 , t2 ) (21)
e1 ≈ e2 ← ∃h1 , h2 , r : r(h1 , e1 ) ∧ r(h2 , e2 ) (22)
On a similar argument, RDF2vec also positions entities closer which share any relation to another entity. Although
this is not visible in the two-dimensional embedding depicted in Fig. 7, RDF2vec would also create vectors with
some similarity for Angela Merkel and Berlin, since they both have a (albeit different) relation to Germany (i.e.,
their prediction for w−2 is similar). Hence, the following notions of similarity can also be observed in RDF2vec:
e1 ≈ e2 ← ∃t, r1 , r2 : r1 (e1 , t) ∧ r2 (e2 , t) (23)
e1 ≈ e2 ← ∃h, r1 , r2 : r1 (h, e1 ) ∧ r2 (h, e2 ) (24)
The example with Angela Merkel and Berlin already hints at a slightly different notion of the interpretation of
proximity in the vector space evoked by RDF2vec: not only similar, but also related entities are positioned close
in the vector space. This means that to a certain extent, RDF2vec mixes the concepts of similarity and relatedness
in its distance function. We will see examples of this in later considerations, and discuss how they interfere with
downstream applications.
5. Experiments
To compare the two sets of approaches, we use standard setups for evaluating knowledge graph embedding
methods for data mining as well as for link prediction.
5.1. Experiments on data mining tasks
In our experiments, we follow the setup proposed in [28] and [25]. Those works propose the use of data mining
tasks with an external ground truth, e.g., predicting certain indicators or classes for entities. Those entities are then
linked to a knowledge graph. Different feature extraction methods – which includes the generation of embedding
vectors – can then be compared using a fixed set of learning methods.
The setup of [25] comprises six tasks using 20 datasets in total:
9 The argument in Section 4.2 would also work for shared relations to common heads.412 J. Portisch et al. / Knowledge graph embedding for data mining vs. knowledge graph embedding for link prediction
– Five classification tasks, evaluated by accuracy. Those tasks use the same ground truth as the regression tasks
(see below), where the numeric prediction target is discretized into high/medium/ low (for the Cities, AAUP,
and Forbes dataset) or high/low (for the Albums and Movies datasets). All five tasks are single-label classifi-
cation tasks.
– Five regression tasks, evaluated by root mean squared error. Those datasets are constructed by acquiring an
external target variable for instances in knowledge graphs which is not contained in the knowledge graph per
se. Specifically, the ground truth variables for the datasets are: a quality of living indicator for the Cities dataset,
obtained from Mercer; average salary of university professors per university, obtained from the AAUP; prof-
itability of companies, obtained from Forbes; average ratings of albums and movies, obtained from Facebook.
– Four clustering tasks (with ground truth clusters), evaluated by accuracy. The clusters are obtained by retrieving
entities of different ontology classes from the knowledge graph. The clustering problems range from distin-
guishing coarser clusters (e.g., cities vs. countries) to finer ones (e.g., basketball teams vs. football teams).
– A document similarity task (where the similarity is assessed by computing the similarity between entities
identified in the documents), evaluated by the harmonic mean of Pearson and Spearman correlation coefficients.
The dataset is based on the LP50 dataset [18]. It consists of 50 documents, each of which have been annotated
with DBpedia entities using DBpedia spotlight [21]. The task is to predict the similarity for each pair of
documents.
– An entity relatedness task (where semantic similarity is used as a proxy for semantic relatedness), evaluated
by Kendall’s Tau. The dataset is based on the KORE dataset [13]. The dataset consists of 20 seed entities from
the YAGO knowledge graph, and 20 related entities each. Those 20 related entities per seed entity have been
ranked by humans to capture the strength of relatedness. The task is to rank the entities per seed by relatedness.
– Four semantic analogy tasks (e.g., Athens is to Greece as Oslo is to X), which are based on the original datasets
on which word2vec was evaluated [22]. The datasets were created by manual annotation. In our evaluation, we
aim at predicting the fourth element (D) in an analogy A : B = C : D by considering the closest n vectors to
B − A + C. If the element is contained the top n predictions, we consider the answer correct, i.e., the evaluation
metric top-n accuracy. In the default setting of the evaluation framework used, n is set to 2.
Table 3 shows a summary of the characteristics of the datasets used in the evaluation. It can be observed that they
cover a wide range of tasks, topics, sizes, and other characteristics (e.g., balance). More details on the construction
of the datasets can be found in [25] and [28].
Note that all datasets are provided with predefined instance links to DBpedia. For the smaller ones, the creators
of the datasets created and checked the links manually; for the larger ones, the linking had been done heuristically.
We used the links provided in the evaluation framework as is, including possible linkage errors.
We follow the evaluation protocol suggested in [25]. This protocol foresees the usage of different algorithms
on each task for each embedding (e.g., Naive Bayes, Decision Tree, k-NN, and SVM for classification), and also
performs parameter tuning in some cases. In the end, we report the best results per task and embedding method.
Those results are depicted in Table 4.
All embeddings are trained on DBpedia 2016-10.10 For generating the different embedding vectors, we use the
DGL-KE framework [47] in the respective standard settings, and we use the RDF2vec vectors provided by the
KGvec2go API [26], trained with 500 walks of depth 8 per entity, Skip-Gram, and 200 dimensions. We compare
RDF2vec [30], TransE (with L1 and L2 norm) [4], TransR [19], RotatE [37], DistMult [46], RESCAL [23], and
ComplEx [40]. To create the embedding vectors with DGL-KE, we use the parameter configurations recommended
by the framework, a dimension of 200, and a step maximum of 1,000,000. The RDF2vecoa vectors were generated
with the same configuration, but using the order-aware variant of Skip-Gram [20,27]. For node2vec, DeepWalk, and
KGlove, we use the standard settings and the code provided by the respective authors.11,12,13 For KGlove, we use
the Inverse Predicate Frequency, which has been reported to work well on many tasks by the original paper [7].
10 The code for the experiments as well as the resulting embeddings can be found at https://github.com/nheist/KBE-for-Data-Mining.
11 https://github.com/D2KLab/entity2vec
12 https://github.com/phanein/deepwalk
13 https://github.com/miselico/globalRDFEmbeddingsISWCJ. Portisch et al. / Knowledge graph embedding for data mining vs. knowledge graph embedding for link prediction 413
Table 3
Overview on the evaluation datasets
Task Dataset # entities Target variable
Classification Cities 212 3 classes (67/106/39)
AAUP 960 3 classes (236/527/197)
Forbes 1,585 3 classes (738/781/66)
Albums 1,600 2 classes (800/800)
Movies 2,000 2 classes (1,000/1,000)
Regression Cities 212 Numeric [23, 106]
AAUP 960 Numeric [277, 1009]
Forbes 1,585 Numeric [0.0, 416.6]
Albums 1,600 Numeric [15, 97]
Movies 2,000 Numeric [1, 100]
Clustering Cities and countries (2k) 4,344 2 clusters (2,000/2,344)
Cities and countries 11,182 2 clusters (8,838/2,344)
Cities, countries, albums, movies, AAUP, Forbes 6,357 5 clusters (2,000/960/1,600/212/1,585)
Teams 4,206 2 clusters (4,185/21)
Document similarity Pairs of 50 documents with entities 1,225 Numeric similarity score [1.0,5.0]
Entity relatedness 20 × 20 entity pairs 400 Ranking of entities
Semantic analogies (All) capitals and countries 4,523 Entity prediction
Capitals and countries 505 Entity prediction
Cities and states 2,467 Entity prediction
Countries and currencies 866 Entity prediction
It is noteworthy that the default settings for node2vec and DeepWalk differ in one crucial property. While
node2vec interprets the graph as a directed graph by default and only traverses edges in the direction in which
they are defined, DeepWalk treats all edges as undirected, i.e., it traverses them in both directions.
From the table, we can observe a few expected and a few unexpected results. First, since RDF2vec is tailored
towards classic data mining tasks like classification and regression, it is not much surprising that those tasks are
solved better by using RDF2vec (and even slightly better by using RDF2vecoa ) vectors. Still, some of the link
prediction methods (in particular TransE and RESCAL) perform reasonably well on those tasks. In contrast, KGloVe
rarely reaches the performance level of RDF2vec, while the two approaches for unlabeled graphs – i.e., DeepWalk
and node2vec – behave differently: while the results of DeepWalk are at the lower end of the spectrum, node2vec is
competitive. The latter is remarkable, showing that pure neighborhood information, ignoring the direction and edge
labels, can be a strong signal when embedding entities.
Referring back to the different notions of similarity that these families of approaches imply (cf. Section 4.3), this
behavior can be explained by the tendency of RDF2vec (and also node2vec) to positioning entities closer in the
vector space which are more similar to each other (e.g., two cities that are similar). Since it is likely that some of
those dimensions are also correlated with the target variable at hand (in other words: they encode some dimension of
similarity that can be used to predict the target variable), classifiers and regressors can pick up on those dimensions
and exploit them in their prediction model.
What is also remarkable is the performance on the entity relatedness task. While RDF2vec embeddings, as well as
node2vec, KGlove, and, to a lesser extent, DeepWalk, reflect entity relatedness to a certain extent, this is not given
for any of the link prediction approaches. According to the notions of similarity discussed above, this is reflected in
the RDF2vec mechanism: RDF2vec has an incentive to position two entities closer in the vector space if they share
relations to a common entity, as shown in Equations (21)-(24). One example is the relatedness of Apple Inc. and414
Table 4
J. Portisch et al. / Knowledge graph embedding for data mining vs. knowledge graph embedding for link prediction
Results of the different data mining tasks. DM denotes approaches originally developed for node representation in data mining, LP denotes approaches originally developed for link prediction
Task (metric) Dataset RDF2vec RDF2vecOA TransE-L1 TransE-L2 TransR RotatE DistMult RESCAL ComplEx node2vec DeepWalk KGloVe
(DM) (DM) (LP) (LP) (LP) (LP) (LP) (LP) (LP) (DM) (DM) (DM)
Classification AAUP 0.676 0.671 0.628 0.651 0.607 0.617 0.597 0.623 0.602 0.694 0.549 0.558
(ACC) Cities 0.810 0.837 0.676 0.752 0.757 0.581 0.666 0.740 0.637 0.774 0.495 0.496
Forbes 0.610 0.626 0.550 0.601 0.561 0.526 0.601 0.563 0.578 0.618 0.490 0.502
Albums 0.774 0.787 0.637 0.746 0.728 0.550 0.666 0.678 0.693 0.789 0.543 0.548
Movies 0.739 0.736 0.603 0.728 0.715 0.567 0.668 0.693 0.655 0.763 0.555 0.563
Clustering (ACC) Cities and countries (2K) 0.758 0.931 0.982 0.994 0.962 0.510 0.957 0.991 0.955 0.939 0.557 0.623
Cities and countries 0.696 0.760 0.953 0.979 0.952 0.691 0.909 0.990 0.591 0.743 0.817 0.765
Cities, albums, movies, 0.926 0.928 0.946 0.944 0.908 0.860 0.878 0.936 0.914 0.930 0.335 0.525
AAUP, Forbes
Teams 0.917 0.958 0.887 0.977 0.844 0.853 0.883 0.881 0.881 0.931 0.830 0.740
Regression AAUP 68.745 66.505 81.503 69.728 88.751 80.177 78.337 72.880 73.665 68.007 103.235 98.794
(RMSE) Cities 15.601 13.486 19.694 14.455 13.558 26.846 19.785 15.137 19.809 15.363 25.323 24.151
Forbes 36.459 36.124 37.589 38.398 39.803 38.343 38.037 35.489 37.877 35.684 41.384 40.141
Albums 11.930 11.597 14.128 12.589 12.789 14.890 13.452 13.537 13.009 15.165 15.129 11.739
Movies 19.648 11.739 23.286 20.635 20.699 23.878 22.161 21.362 22.229 18.877 24.215 24.000
Semantic (All) capitals and countries 0.685 0.895 0.709 0.675 0.938 0.377 0.782 0.211 0.814 0.284 0.000 0.011
analogies Capitals and countries 0.648 0.913 0.840 0.792 0.937 0.640 0.802 0.312 0.864 0.164 0.000 0.043
(precision@k) Cities and state 0.342 0.629 0.335 0.209 0.392 0.294 0.379 0.089 0.309 0.068 0.000 0.029
Currency (and countries) 0.339 0.427 0.005 0.285 0.143 0.000 0.001 0.000 0.000 0.420 0.005 0.003
Document LP50 0.348 0.307 0.343 0.397 0.434 0.326 0.360 0.344 0.341 0.333 0.243 0.225
similarity
(harmonic mean)
Entity relatedness KORE 0.504 0.779 0.002 −0.081 0.139 −0.039 0.147 0.087 0.115 0.525 0.129 0.421
(KendallTau)J. Portisch et al. / Knowledge graph embedding for data mining vs. knowledge graph embedding for link prediction 415
Steve Jobs – here, we can observe the two statements
product(Apple Inc., IPhone)
knownfor(Steve Jobs, IPhone)
in DBpedia, among others. Those lead to similar vectors in RDF2vec according to Equation (23). A similar argument
can be made for node2vec and DeepWalk, and also for KGlove, which looks at global cooccurences of entities, i.e.,
it also favors closer embeddings of related entities.
The same behavior of RDF2vec – i.e., assigning close vectors to related entities – also explains the comparatively
bad results of RDF2vec on the first two clustering tasks. Here, the task is to separate cities and countries in two
clusters, but since a city is also related to the country it is located in, RDF2vec may position that city and country
rather closely together (RDF2vecoa changes that behavior, as argued in [27], and hence produces better results for the
clustering problems). Hence, that city has a certain probability of ending up in the same cluster as the country. The
latter two clustering tasks are different: the third one contains five clusters (cities, albums, movies, universities, and
companies), which are less likely to be strongly related (except universities and companies to cities) and therefore
are more likely to be projected in different areas in the vector space. Here, the difference of RDF2vec to the best
performing approaches (i.e., TransE-L1 and TransE-L2) is not that severe. The same behavior can also be observed
for the other embedding approaches for data mining, i.e., node2vec, DeepWalk, and KGlove, which behave similarly
in that respect.
The problem of relatedness being mixed with similarity does not occur so strongly for homogeneous sets of
entities, as in the classification and regression tasks, where all entities are of the same kind (cities, companies,
etc.) – here, two companies which are related (e.g., because one is a holding of the other) can also be considered
similar to a certain degree (in that case, they are both operating in the same branch). This also explains why the forth
clustering task (where the task is to assign sports teams to clusters by the type of sports) works well for RDF2vec –
here, the entities are again homogeneous.
At the same time, the test case of clustering teams can also be used to explain why link prediction approaches
work well for that kind of tasks: here, it is likely that two teams in the same sports share a relation to a common
entity, i.e., they fulfill Equations (19) and (20). Examples include participation in the same tournaments or common
former players.
The semantic analogies task also reveals some interesting findings. First, it should be noted that the relations
which form the respective analogies (capital, state, and currency) is contained in the knowledge graph used for the
computation. That being said, we can see that most of the link prediction results (except for RotatE and RESCAL)
perform reasonably well here. Particularly, the first cases (capitals and countries) can be solved particularly well in
those cases, as this is a 1:1 relation, which is the case in which link prediction is a fairly simple task. On the other
hand, most of the data-mining-centric approaches (i.e., node2vec, DeepWalk, KGlove) solve this problem relatively
bad. A possible explanation is that the respective entities belong to the strongly interconnected head entities of the
knowledge graphs, and also the false solutions are fairly close to each other in the graph (e.g., US Dollar and Euro
are interconnected through various short paths). This makes it hard for approaches concentrating on a common
neighborhood to produce decent results here.
On the other hand, the currency case is solved particularly bad by most of the link prediction results. This relation
is an n:m relation (there are countries with more than one official, unofficial, or historic currency, and many curren-
cies, like the Euro, are used across many countries. Moreover, looking into DBpedia, this relation contains a lot of
mixed usage and is not maintained with very high quality. For example, DBpedia lists 33 entities whose currency
is US Dollars14 – the list contains historic entities (e.g., West Berlin), errors (e.g., Netherlands), and entities which
are not countries (e.g., OPEC), but the United States are not among those. For such kind of relations which contain
a certain amount of noise and heterogeneous information, many link prediction approaches are obviously not well
suited.
14 http://dbpedia.org/page/United_States_dollar416 J. Portisch et al. / Knowledge graph embedding for data mining vs. knowledge graph embedding for link prediction
RDF2vec, in contrast, can deal reasonably well with that case. Here, two effects interplay when solving such
tasks: (i) as shown above, relations are encoded by the proximity in RDF2vec to a certain extent, i.e., the properties
in Equations (3) and (4) allow to perform analogy reasoning in the RDF2vec space in general. Moreover, (ii) we
have already seen the tendency of RDF2vec to position related entities in relative proximity. Thus, for RDF2vec, it
can be assumed that the following holds:
UK ≈ Pound Sterling (25)
USA ≈ US Dollar (26)
Since we can rephrase the first equation as
Pound Sterling − UK ≈ 0 (27)
we can conclude that analogy reasoning in RDF2vec would yield
Pound Sterling − UK + USA ≈ US Dollar (28)
Hence, in RDF2vec, two effects – the preservation of relation vectors as well as the proximity of related entities –
are helpful for analogy reasoning, and the two effects also work for rather noisy cases. However, for cases which are
1:1 relations in the knowledge graph with rather clean training data available, link prediction approaches are better
suited for analogy reasoning.
5.2. Experiments on link prediction tasks
In a second series of experiments, we analyze if we can use embedding methods developed for similarity compu-
tation, like RDF2vec, also for link prediction. We use the two established tasks WN18 and FB15k for a comparative
study.
While link prediction methods are developed for the task at hand, approaches developed for data mining are
not. Although RDF2vec computes vectors for relations, they do not necessarily follow the same notion as relation
vectors for link prediction, as discussed above. Hence, we investigate two approaches:
1. We average the difference for each pair of a head and a tail for each relation r, and use that as average as a
proxy for a relation vector for prediction, as shown in Equation (4). The predictions are the entities whose
embedding vectors are the closest to the approximate prediction. This method is denoted as avg.
2. For predicting the tail of a relation, we train a neural network to predict an embedding vector of the tail based
embedding vectors, as shown in Fig. 10. The predictions for a triple h, r, ? are the entities whose embedding
vectors are closest to the predicted vector for h and r. As similar network is trained to predict h from r and t.
This method is denoted as ANN.
We trained the RDF2vec embeddings with 2,000 walks, a depth of 4, a dimension of 200, a window of 5, and 25
epochs in SG mode. For the second prediction approach, the two neural networks each use two hidden layers of size
200, and we use 15 epochs, a batch size of 1,000, and mean squared error as loss. KGlove, node2vec, and DeepWalk
do not produce any vectors for relations. Hence, we only use the avg strategy for those approaches.
The results of the link prediction experiments are shown in Table 5.15 We can observe that the RDF2vec based
approaches perform at the lower end of the spectrum. The avg approach outperforms DistMult and RESCAL on
WN18, and both approaches are about en par with RESCAL on FB15k. Except for node2vec on FB15k, the other
data mining approaches fail at producing sensible results.
While the results are not overwhelming, they show that similarity of entities, as RDF2vec models it, is at least a
useful signal for implementing a link prediction approach.
15 The code for the experiments can be found at https://github.com/janothan/kbc_rdf2vec.J. Portisch et al. / Knowledge graph embedding for data mining vs. knowledge graph embedding for link prediction 417
Fig. 10. Training a neural network for link prediction with RDF2vec.
5.3. Discussion
As already discussed above, the notion of similarity which is conveyed by RDF2vec mixes similarity and relat-
edness. This can be observed, e.g., when querying for the 10 closest concepts to Angela Merkel (the chancellor, i.e.,
head of government in Germany) in DBpedia in the different spaces, as shown in Table 6. The approach shows a
few interesting effects:
– While most of the approaches (except for RotatE, KGlove and DeepWalk) provide a clean list of people,
RDF2vec brings up a larger variety of results, containing also Germany and Berlin (and also a few results
which are not instances, but relations; however, those could be filtered out easily in downstream applications if
necessary). This demonstrates the property of RDF2vec of mixing similarity and relatedness. The people in the
RDF2vec result set are all related to Angela Merkel: Joachim Gauck was president during her chancellorship,
Norbert Lammert was the head of parliament, Stanislaw Tillich was a leading board member in the same party
as Merkel, and Andreas Voßkuhle was the head of the highest court during her chancellorship.
– The approaches at hand have different foci in determining similarity. For example, TransE-L1 outputs mostly
German politicians (Schröder, Gauck, Trittin, Gabriel, Westerwelle, Wulff) and former presidents of other
countries (Buchanan as a former US president, Sarkozy and Chirac as former French presidents) TransE-L2
outputs a list containing many former German chancellors (Schröder, Kohl, Adenauer, Schmidt, Kiesinger,
Erhardt), TransR mostly lists German party leaders (Gabriel, Steinmeier, Rösler Schröder, Wulff, Westerwelle,
Kohl, Trittin). Likewise, node2vec produces a list of German politicians, with the exception of Merkel’s hus-
band Joachim Sauer.16 In all of those cases, the persons share some property with the query entity Angela
Merkel (profession, role, nationality, etc.), but similarity is usually affected only by one of those properties. In
other words: one notion of similarity dominates the others.
– In contrast, the persons in the output list of RDF2vec are related to the query entity in different respects. In
particular, they played different roles during Angela Merkel’s chancellorship (Gauck was the German president,
Lammert was the chairman of the parliament, and Voßkuhle was the chairman of the federal court). Here,
there is no dominant property, instead, similarity (or rather: relatedness) is encoded along various properties.
RDF2vecoa brings up a results which is slightly closer to the politicians lists of the other approaches, while
the result list of KGlove looks more like a random list of entities. A similar observation can be made for
DeepWalk, which, with the exception of the first result (which is a German politician) does not produce any
results seemingly related to the query concept at hand.
With that observation in mind, we can come up with an initial set of recommendations for choosing embedding
approaches:
16 The remaining approaches – RotatE, DistMult, RESCAL, ComplEx, KGlove, DeepWalk – produce lists of (mostly) persons which, in their
majority, share no close link to the query concept Angela Merkel.You can also read