Interrupted time series segmented regression analysis for detecting waterborne disease outbreaks by syndromic surveillance
←
→
Page content transcription
If your browser does not render page correctly, please read the page content below
2023 . Volume 47

Communicable Diseases Intelligence
Interrupted time series segmented regression
analysis for detecting waterborne disease
outbreaks by syndromic surveillance
Aidan Yuen, Davoud Pourmarzi, Suzie Sarkis, Carmela Luisetto, Kamal Khatri, Angie Bone, Jim Black

https://doi.org/10.33321/cdi.2023.47.5
Electronic publication date: 28/02/2023
http://health.gov.au/cdi

Communicable Diseases Intelligence                                      Communicable Diseases Intelligence
ISSN: 2209-6051 Online                                                  (CDI) is a peer-reviewed scientific
                                                                        journal published by the Office of Health
                                                                        Protection, Department of Health and
This journal is indexed by Index Medicus and Medline.
                                                                        Aged Care. The journal aims to disseminate
                                                                        information on the epidemiology,
Creative Commons Licence - Attribution-NonCommercial-
                                                                        surveillance, prevention and control of
NoDerivatives CC BY-NC-ND
                                                                        communicable diseases of relevance to
© 2023 Commonwealth of Australia as represented by the                  Australia.
Department of Health and Aged Care
                                                                        Editor
This publication is licensed under a Creative Commons Attribution-      Noel Lally
Non-Commercial NoDerivatives 4.0 International Licence from
                                                                        Deputy Editor
https://creativecommons.org/licenses/by-nc-nd/4.0/legalcode
                                                                        Simon Petrie
(Licence). You must read and understand the Licence before using
any material from this publication.
                                                                        Design and Production
                                                                        Kasra Yousefi
Restrictions
The Licence does not cover, and there is no permission given for, use
                                                                        Editorial Advisory Board
of any of the following material found in this publication (if any):
                                                                        David Durrheim, Mark Ferson,
                                                                        Clare Huppatz, John Kaldor,
• the Commonwealth Coat of Arms (by way of information, the
                                                                        Martyn Kirk, Meru Sheel and
  terms under which the Coat of Arms may be used can be found at
                                                                        Steph Williams
  www.itsanhonour.gov.au);
                                                                        Website
• any logos (including the Department of Health and Aged Care’s
                                                                        http://www.health.gov.au/cdi
  logo) and trademarks;
                                                                        Contacts
• any photographs and images;
                                                                        CDI is produced by the Office
• any signatures; and                                                   of Health Protection, Australian
                                                                        Government Department of
• any material belonging to third parties.                              Health and Aged Care, GPO Box
                                                                        9848, (MDP 6) CANBERRA ACT
Disclaimer                                                              2601
Opinions expressed in Communicable Diseases Intelligence are
those of the authors and not necessarily those of the Australian        Email:
Government Department of Health and Aged Care or the                    cdi.editor@health.gov.au
Communicable Diseases Network Australia. Data may be subject to
revision.                                                               Submit an Article
                                                                        You are invited to submit
Enquiries                                                               your next communicable
Enquiries regarding any other use of this publication should be         disease related article
addressed to the Communication Branch, Department of Health and         to the Communicable
Aged Care, GPO Box 9848, Canberra ACT 2601, or via e-mail to:           Diseases Intelligence (CDI)
copyright@health.gov.au                                                 for consideration. More
                                                                        information regarding CDI can
Communicable Diseases Network Australia                                 be found at:
Communicable Diseases Intelligence contributes to the work of the       http://health.gov.au/cdi.
Communicable Diseases Network Australia.
http://www.health.gov.au/cdna                                           Further enquiries should be
                                                                        directed to:

                                                                        cdi.editor@health.gov.au.
Original articles

Interrupted time series segmented regression
analysis for detecting waterborne disease
outbreaks by syndromic surveillance
Aidan Yuen, Davoud Pourmarzi, Suzie Sarkis, Carmela Luisetto, Kamal Khatri, Angie Bone, Jim Black

Abstract

Introduction

Pathogens can enter the drinking water supply and cause gastroenteritis outbreaks. Such events can
affect many people in a short time, making them a high risk for public health. In Australia, the
Victoria State Government Department of Health is deploying a syndromic surveillance system for
drinking water contamination events. We assessed the utility of segmented regression models for
detecting such events and determined the number of excess presentations needed for such methods
to signal a detection.

Methods

The study involved an interrupted time series study of a past lapse in water treatment. The baseline
period comprised the four weeks before the minimum incubation period of suspected pathogens,
set at two days post-event. The surveillance period comprised the week after. We used segmented
linear regression to compare the count of gastroenteritis presentations to public hospital emergency
departments (EDs) between the surveillance and baseline periods. We then simulated events result-
ing in varying excess presentations. These were superimposed onto the ED data over fifty different
dates across 2020. Using the same regression, we calculated the detection probability at p < 0.05 for
each outbreak size.

Results

In the retrospective analysis, there was strong evidence for an increase in presentations shortly after
the event. In the simulations, with no excess presentations (i.e., with the ED data as is) the models
signalled 8% probability of detection. The models returned 50% probability of detection with 28
excess presentations and 100% probability of detection with 78 excess presentations.

Conclusions

The transient increase in presentations after the event may be attributed to microbiological hazards
or increased health-seeking behaviour following the issuing of boil water advisories. The simulations
demonstrated the ability for segmented regressions to signal a detection, even without a large excess
in presentations. The approach also demonstrated high specificity and should be considered for
informing Victoria’s syndromic surveillance system.

Keywords: Drinking water contamination; syndromic surveillance; waterborne disease outbreaks.

health.gov.au/cdi            Commun Dis Intell (2018) 2023;47 (https://doi.org/10.33321/cdi.2023.47.5) Epub 28/02/2023   1 of 12
Introduction                                                            industrial waste discharges) and diffuse sources
                                                                        (e.g., agricultural and animal husbandry
In drinking water contamination events, patho-                          activities).17
gens, such as Shiga toxin-producing Escherichia
coli (STEC) and Cryptosporidium, can cause                              In Victoria, water agencies are required to notify
outbreaks of acute gastroenteritis.1–3 Such out-                        the Victorian State Government Department
breaks can affect many people in a short time,                          of Health of any known or suspected con-
making them a high risk for public health.4                             tamination events pursuant to Sections 18
Recognising and responding to such outbreaks                            or 22 of the Safe Drinking Water Act 2003
quickly can therefore mitigate downstream                               (Victoria). Following such events, the Victorian
morbidity and mortality, and associated costs.5,6                       Department of Health may issue boil water
In the cryptosporidiosis outbreak in Milwaukee,                         advisories; these are public announcements
Wisconsin in 1993, for example, up to 85% of                            advising that drinking water should be boiled
the 403,000 cases could have been avoided had                           (or otherwise disinfected) prior to consumption
surveillance systems detected it earlier.7                              until the issue is rectified.17

One avenue for early detection is syndromic                             One example of a drinking water contamination
surveillance. Syndromic surveillance uses pre-                          event occurred in 2020, when a storm caused a
clinical and clinical pre-diagnostic data, and                          power outage, which then caused a generator to
proxy measures, such as hospital admission                              fail. Undisinfected water subsequently entered
reports and over-the-counter pharmaceuti-                               the water distribution zones of the two affected
cal sales, to identify potential outbreaks.8–11                         water agencies, resulting in the issuing of boil
Syndromic surveillance can therefore detect                             water advisories. Although there is little evi-
outbreaks earlier than surveillance systems that                        dence that this event, or any other recent events,
rely on laboratory-confirmed cases.5,6 In the                           resulted in outbreaks, preparedness for future
Milwaukee outbreak, for example, calls to nurse                         outbreaks is important to avoid situations like
hotlines reported a fourfold increase in diar-                          the Milwaukee event.
rhoeal disease; this was observed one day before
local pharmacists noticed that over-the-counter                         Given this, the Victorian Department of Health
anti-diarrhoeal drugs were selling out, and five                        is building its capacity for the syndromic
days before the local public health unit was noti-                      surveillance of such events by using rapidly
fied of a potential outbreak.12,13 Although the                         acquired but non-specific information on
impetus for the initial expansion of syndromic                          gastroenteritis presentations to public hospital
surveillance was for bioterrorism preparedness,                         emergency departments (EDs). This system
the Milwaukee event demonstrated the utility of                         will consider incorporating inferential statis-
the approach for detecting waterborne disease                           tics to help signal the occurrence of potential
outbreaks.14                                                            outbreaks. One potential analytical approach
                                                                        is interrupted time series segmented regression
In Australia, reports of waterborne gastroen-                           analysis, a powerful statistical method typically
teritis outbreaks are rare.15 Most Australians                          used to evaluate policy interventions.18 In this
are supplied with potable water by retail water                         paper, we adapted this approach to the study
corporations. This water is often disinfected,                          of drinking water contamination events, which
which, together with filtration, is credited with                       can similarly affect a large population.
substantial reductions in waterborne disease.16
Disinfection reduces the risk of microbial con-                         By retrospectively analysing the 2020 event, we
taminants that may enter the supply through                             aimed to answer the following question: What
point sources of pollution (e.g., human and                             is the utility of applying interrupted time series
                                                                        segmented regression analysis for detecting

2 of 12               Commun Dis Intell (2018) 2023;47 (https://doi.org/10.33321/cdi.2023.47.5) Epub 28/02/2023   health.gov.au/cdi
excess gastroenteritis presentations to public Unserved populations commonly access their
hospital EDs following a drinking water con- drinking water from bores, wells, and rainwater
tamination event? collections.
Given there is little evidence of recent events ED presentations were retrieved from the
resulting in outbreaks, we then simulated out- Victorian Emergency Minimum Dataset
breaks of various sizes to answer the following (VEMD), which is updated daily by health ser-
question: What number of excess presentations vices and includes de-identified demographic,
to public hospital EDs are needed for such administrative and clinical data detailing
methods to statistically signal a detection? presentations at Victorian public hospital EDs.
VEMD data are subject to a validation process,
Methods which includes checks for valid values and
compliance with VEMD business rules. The
Study design Victorian Department of Health also performs
monthly data quality checks on ED-only admis-
This study involved an ecological time series sions, overlapping ED presentation times and
study of secondary panel data stratified by post- admission times, and VEMD length of stays of
code and days. over 24 hours. Health services are required to
correct the data where anomalies are detected.
Study setting
Residential addresses for each VEMD presenta-
The study population included all people resi- tion were mapped to their corresponding water
dent in the affected Victorian postcodes for the distributions zones. Gastroenteritis presenta-
period from 1 January 2020 to 31 December tions were identified using diagnosis fields that
2020. included an ICD-10 code with the prefix ‘A0’,
which were assigned by clinical coders at each
Data sources and measurements health service.
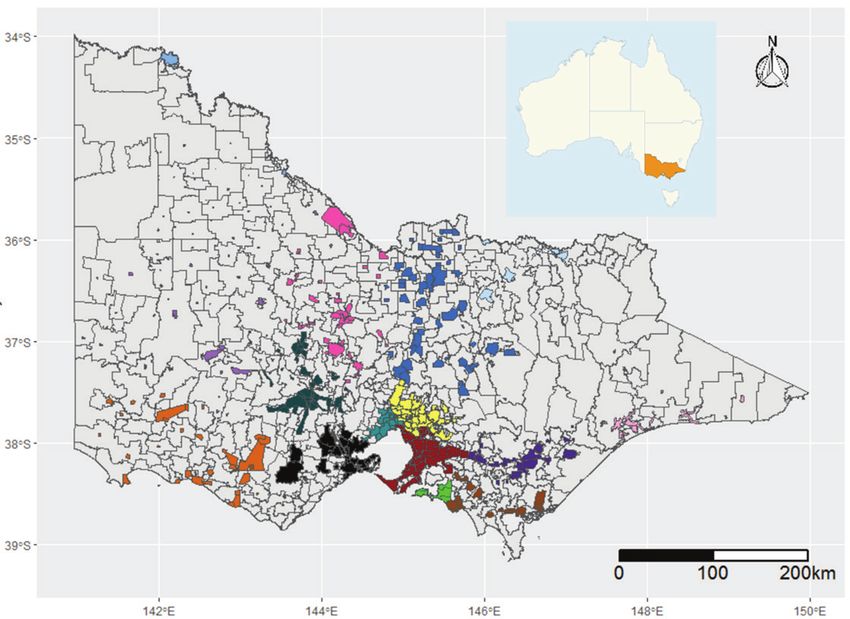
Shapefiles of the various water distribution Interrupted time series analysis
zones were provided by each water agency. By
layering these zones over Victorian postcodes, Suspected contamination event
we determined which postcodes are served by
which agencies (Figure 1). Because some post- The dataset was restricted to those postcodes
codes are served by multiple agencies, or only served by the affected water agencies for both
partially served by an agency, we defined two the ‘inclusive’ and ‘core’ definitions described
different analyses: above.
• An ‘inclusive’ option, where postcodes are The baseline period was defined as the four
considered part of a zone if they are served at weeks before the minimum incubation period of
least in part by a water agency; and pathogens commonly implicated in such events,
like Cryptosporidium and STEC;19,20 this was set
• A ‘core’ option, where postcodes are consid- at two days post-event. The surveillance period
ered part of a zone if they are only served by was defined as the week after that minimum
a water agency, and wholly served by that incubation period. Interrupted time series anal-
agency. ysis was used to test the hypothesis that the count
of gastroenteritis presentations was different
Of note, not all postcodes are served by a water between the baseline and surveillance periods.
agency. And of those that are, not all areas in
that postcode are connected to the network.
health.gov.au/cdi Commun Dis Intell (2018) 2023;47 (https://doi.org/10.33321/cdi.2023.47.5) Epub 28/02/2023 3 of 12Figure 1: Water distribution zones of water agencies overlaying Victorian postcodesa
4 of 12
Commun Dis Intell (2018) 2023;47 (https://doi.org/10.33321/cdi.2023.47.5) Epub 28/02/2023
a Postcodes are shown in grey borders. Each colour represents the area served by one of fifteen different water agencies included in the reported modelling. Inset shows the Australian state of Victoria
health.gov.au/cdi
highlighted.The following segmented linear regression were then superimposed onto the existing
model was used for our interrupted time series VEMD data for the same postcodes as in the
analysis: previous analysis, but over a different date. We
reran the same segmented regression model
Yt = β0 + β1T + β2Xt + β3TXt and used p < 0.05 for the β2 coefficient to signal
a detection. We repeated this process for 50 dif-
This model required three key variables: ferent dates across 2020 and calculated the pro-
portion of positive detections for each outbreak
• T: the days since the start of the study period. size simulated in Figure 2.
• Xt: a dummy variable indicating the baseline Results
(coded 0) and surveillance (coded 1) peri-
ods. Suspected contamination event
• Yt: the outcome at time t, i.e., gastroenteritis The ‘inclusive’ analysis included 237 postcodes
presentations to public hospital EDs. and 521 gastroenteritis presentations over the
study period, with a median of 14 (and a range
Upon entering these variables into the model, we of eight to 24) presentations per day. In the
retrieved the following coefficients for analysis: regression, there were approximately 15 presen-
tations at the beginning of the study (β0 = 15.52,
• β0: the constant, i.e., the value at which the p < 0.001), with little evidence for a change in
regression crosses the y-axis. rate across the baseline period (β1 = -0.08, p =
0.33). There was very strong evidence for a level
• β1: the baseline trend, i.e., the change in change in approximately 11 additional presen-
presentations with a time unit increase in the tations immediately following the minimum
baseline period. incubation period of suspected pathogens (β2 =
10.94, p < 0.001), with strong evidence showing
• β2: the level change, i.e. the immediate a subsequent decrease in presentations over the
change in presentations in the surveillance surveillance week (β3 = -1.67, p = 0.02) (Figure 3).
period compared to the baseline period; this
coefficient can signal a point-source out- The ‘core’ analysis included 97 postcodes and
break. 234 presentations over the study period, with a
median of six (and a range of two to 17) presen-
• β3: the slope change, i.e. the change in the tations per day. In the regression, the start of the
regression gradient of the surveillance period study period saw approximately seven presenta-
compared to the baseline period; this coef- tions (β0 = 6.56, p < 0.001), with little evidence
ficient can signal a continuous-source out- for a change in rate across the baseline period
break. (β1 = -0.03, p = 0.68). There was strong evidence
for an immediate increase in presentations
Simulated outbreaks following the minimum incubation period of
suspected pathogens (β2 = 7.39, p = 0.01), and
To help interpret negative and positive results of some evidence to show a subsequent decrease in
future analyses, we simulated single-day water presentations over the surveillance week (β3 =
contamination events causing point-source -1.04, p = 0.07) (Figure 3).
outbreaks of log-normal distribution, resulting
in varying numbers of excess gastroenteritis Simulated outbreaks
presentations to public hospital EDs (Figure 2).
Given there is little evidence of recent events Over fifty runs of the simulated outbreaks for the
leading to outbreaks, these excess presentations ‘inclusive’ analysis, with no excess presentations
health.gov.au/cdi Commun Dis Intell (2018) 2023;47 (https://doi.org/10.33321/cdi.2023.47.5) Epub 28/02/2023 5 of 12(i.e., with the ED data as is) the models signalled to outbreaks, and demonstrated the ability of
a detection 8% of the time. With 28 excess pres- segmented regressions to statistically signal a
entations, the models returned detections 50% detection, even without a large excess in pres-
of the time; with 78 excess presentations, detec- entations. Our study therefore supports the use
tions were returned 100% of the time (Table 1). of interrupted time series analysis for inform-
For the ‘core’ analysis, with no excess presenta- ing Victoria’s syndromic surveillance system for
tions, the models signalled a detection 6% of the such events in conjunction with timely public
time. The models returned over 50% detections hospital ED data.
with 21 excess presentations, and 100% detec-
tions with 45 excess presentations (Table 1). In this study, the suspected contamination
event saw a transient increase in presentations,
Discussion but indicator microorganisms were undetected
in samples taken from the affected waterbod-
This study demonstrated the utility of applying ies. We recognise there are limitations to
segmented regression analysis to an interrupted monitoring extensively for specific pathogens
time series study of gastroenteritis presenta- in large water distribution networks, like those
tions to public hospital EDs before and after implicated in this event. It therefore remains
a suspected drinking water contamination possible that this increase in presentations
event. We also simulated outbreaks of various was the result of to microbiological hazards.
sizes given the absence of recent events leading
Figure 2: Simulated point-source outbreaks of Shiga-toxin producing Escherichia coli following
a single-day water contamination event resulting in excess gastroenteritis presentations to public
hospital emergency departmentsa
a Each line represents a different simulation. In ascending order, the number of excess presentations in each simulation are: 1, 3, 6, 10, 15,
21, 28, 36, 45, 55, 66 and 78.
6 of 12 Commun Dis Intell (2018) 2023;47 (https://doi.org/10.33321/cdi.2023.47.5) Epub 28/02/2023 health.gov.au/cdiFigure 3: Interrupted time series study of gastroenteritis presentations to public hospital emergency departments (EDs) before and after a
suspected contamination event in affected postcodes in Victoria, Australia, 2020, showing (A) the ‘inclusive’ and (B) the ‘core’ analysisa
health.gov.au/cdi
A B
a The ‘inclusive’ model includes postcodes that are served at least in part by the affected source; the ‘core’ model includes postcodes that are only served, and wholly served, by the affected source.
Commun Dis Intell (2018) 2023;47 (https://doi.org/10.33321/cdi.2023.47.5) Epub 28/02/2023
7 of 12Alternatively, our findings may be ascribed to Our analyses did have some limitations. Firstly,
increased health-seeking behaviour following gastroenteritis syndromes were identified using
the issuing of boil water advisories.3 ICD-10 codes, which can be subject to misclas-
sification. Similarly, there is likely misclassifica-
In our simulations, the segmented regressions tion in how we determined which postcodes are
also signalled detections when applied to other served by which water sources. The ‘inclusive’
dates in the VEMD, a likely consequence of definition will have captured all affected post-
random error.21 Reassuringly, the false-positive codes, with the drawback being the inclusion
rate was less than 10% for both the ‘inclusive’ of unaffected populations in sections served by
and ‘core’ analyses. Given its high specificity, a other zones. The ‘core’ definition has the advan-
positive detection is therefore likely suggestive tage of restricting analyses to postcodes com-
of a waterborne disease outbreak. Its sensitiv- pletely affected by the event, at the expense of
ity, i.e., its true-positive detection rate, was excluding affected postcodes served additionally
dose-dependent. This is consistent with other by other zones. The misclassification in ICD-10
syndromic surveillance approaches that use codes and postcodes are likely non-differential
health insurance data, telephone triage and between the baseline and surveillance periods,
over-the-counter pharmacy sales.8,22 thus biasing the effect estimates towards the
null. As such, the sensitivity estimates of our
Of note, our study period occurred during the models are likely minimum estimates of the
COVID-19 pandemic. ED presentations likely true value.
fluctuated with stay-at-home orders, which may
have introduced additional noise to the rates of Furthermore, some people may have ingested
gastroenteritis presentations. By restricting the water in the affected postcodes, but may have
baseline period to four weeks, we were able to become ill in another, thereby reducing case
retain sufficient data to establish a robust base- ascertainment. This was minimised by the pres-
line, while minimising the impact of variable ence of stay-at-home orders during the study
lockdowns and seasonal variability. period. We recognise that this remains a limita-
tion if used for syndromic surveillance during
We also want to highlight that our analyses non-lockdown contexts.
focused on p-values to signal a detection. We
note that a statistical signal at p < 0.05 may not Our simulation was also run over 50 different
have public health significance. Such analyses dates across 2020; the results may therefore
should therefore be used in conjunction with lack precision and may benefit from additional
microbiological testing and consultation with runs. Furthermore, all simulations were mod-
key stakeholders (including waterborne and elled after single-day water contamination
foodborne disease experts) to inform public events leading to point-source outbreaks of
health decision making. STEC. Therefore, our findings may not be
Table 1: Probability of detection in an interrupted time series study of gastroenteritis
presentations to public hospital emergency departments (EDs) before and after simulated
outbreaks of various sizes in affected postcodes in Victoria, Australia, 2020a
Excess presentations to public hospital EDs (n) 0 1 3 6 10 15 21 28 36 45 55 66 78
Proportion detected for the ‘inclusive’ analysisb 8% 8% 10% 18% 24% 32% 44% 50% 58% 76% 88% 94% 100%
Proportion detected for the ‘core’ analysisc 6% 10% 14% 20% 36% 44% 60% 78% 88% 100% 100% 100% 100%
a Details of the simulated outbreaks and resultant excess presentations are given in Figure 2.
b Includes postcodes that are served at least in part by the affected sources.
c Includes postcodes that are only served, and wholly served, by the affected sources.
8 of 12 Commun Dis Intell (2018) 2023;47 (https://doi.org/10.33321/cdi.2023.47.5) Epub 28/02/2023 health.gov.au/cdigeneralisable to outbreaks with different char- Ethical statement
acteristics. Future simulations could incorpo-
rate other pathogens and other outbreak types, Ethical approval was obtained from the State
including continuous-source outbreaks, to bet- Government of Victoria’s Department of Health
ter assess the model’s sensitivity and specificity. and Department of Families, Fairness and
Future studies could also explore the utility Housing Human Research Ethics Committee
of interrupted times series analysis applied to (ref: HREC/80437/DOH-2021-294619).
other outcome data, such as telephone triage,
web-based queries, and over-the-counter phar- Funding statement
maceutical sales.8
This research did not receive any specific
In closing, this study demonstrated the utility funding.
of interrupted time series analysis for the early
detection of waterborne disease outbreaks when Data availability
used in conjunction with timely public hospital
ED data. This approach should therefore be Data requests can be directed to the corre-
considered for informing Victoria’s syndromic sponding author.
surveillance system for monitoring and evaluat-
ing such events. Conflict of interest
We declare no known competing interests that
could have influenced this work.
health.gov.au/cdi Commun Dis Intell (2018) 2023;47 (https://doi.org/10.33321/cdi.2023.47.5) Epub 28/02/2023 9 of 12Acknowledgements Corresponding author
The authors acknowledge the contributions of Aidan Yuen
the staff at the State Government of Victoria’s
Department of Health and the Victorian water National Centre for Epidemiology and
agencies. Population Health, Australian National
University, Canberra, Australian Capital
Author details Territory 2600, Australia
Mr Aidan Yuen1,2,3 Email: aidan.yuen@anu.edu.au
Dr Davoud Pourmarzi1
Ms Suzie Sarkis2
Ms Carmela Luisetto2
Mr Kamal Khatri2
Dr Angie Bone2
Dr Jim Black 2
1. National Centre for Epidemiology and Popu-
lation Health, Australian National University,
Canberra, Australian Capital Territory 2600,
Australia
2. Department of Health, State Government of
Victoria, Melbourne, Victoria 3000, Australia
3. http://orcid.org/ 0000-0002-8642-8619
10 of 12 Commun Dis Intell (2018) 2023;47 (https://doi.org/10.33321/cdi.2023.47.5) Epub 28/02/2023 health.gov.au/cdiReferences 1. Pignata C, Bonetta S, Bonetta S, Cacciò SM, Sannella AR, Gilli G et al. Cryptosporidium oo- cyst contamination in drinking water: a case study in Italy. Int J Environ Res Public Health. 2019;16(11):2055. doi: https://doi.org/10.3390/ijerph16112055. 2. Reynolds C, Checkley S, Chui L, Otto S, Neumann NF. Evaluating the risks associated with Shiga-toxin-producing Escherichia coli (STEC) in private well waters in Canada. Can J Microbiol. 2020;66(5):337–50. doi: https://doi.org/10.1139/cjm-2019-0329. 3. Lin CJ, Richardson DB, Hilborn ED, Weinberg H, Engel LS, Wade TJ. Emergency department visits for acute gastrointestinal illness after a major water pipe break in 2010. Epidemiology. 2019;30(6):893–900. doi: https://doi.org/10.1097/EDE.0000000000001083. 4. Mac Kenzie WR, Hoxie NJ, Proctor ME, Gradus MS, Blair KA, Peterson DE et al. A massive out- break in Milwaukee of cryptosporidium infection transmitted through the public water supply. N Engl J Med. 1994;331(3):161–7. doi: https://doi.org/10.1056/NEJM199407213310304. 5. Paterson BJ, Durrheim DN. The remarkable adaptability of syndromic surveillance to meet public health needs. J Epidemiol Glob Health. 2013;3(1):41–7. doi: https://doi.org/10.1016/j. jegh.2012.12.005. 6. Nygård K, Schimmer B, Søbstad Ø, Walde A, Tveit I, Langeland N et al. A large community outbreak of waterborne giardiasis—delayed detection in a non-endemic urban area. BMC Public Health. 2006;6(1):141. doi: https://doi.org/10.1186/1471-2458-6-141. 7. Eisenberg JN, Seto EY, Colford JM, Olivieri A, Spear RC. An analysis of the Milwaukee crypto- sporidiosis outbreak based on a dynamic model of the infection process. Epidemiology. 1998;9(3):255–63. 8. Andersson T, Bjelkmar P, Hulth A, Lindh J, Stenmark S, Widerström M. Syndromic surveillance for local outbreak detection and awareness: evaluating outbreak signals of acute gastroenteritis in telephone triage, web-based queries and over-the-counter pharmacy sales. Epidemiol Infect. 2014;142(2):303–13. doi: https://doi.org/10.1017/S0950268813001088. 9. Groeneveld GH, Dalhuijsen A, Kara-Zaïtri C, Hamilton B, de Waal MW, van Dissel JT et al. ICARES: a real-time automated detection tool for clusters of infectious diseases in the Nether- lands. BMC Infect Dis. 2017;17(1):201. doi: https://doi.org/10.1186/s12879-017-2300-5. 10. Shortridge JE, Guikema SD. Public health and pipe breaks in water distribution systems: analysis with internet search volume as a proxy. Water Res. 2014;53:26–34. doi: https://doi.org/10.1016/j. watres.2014.01.013. 11. Pivette M, Mueller JE, Crépey P, Bar-Hen A. Drug sales data analysis for outbreak detection of infectious diseases: a systematic literature review. BMC Infect Dis. 2014;14(1):604. doi: https:// doi.org/10.1186/s12879-014-0604-2. 12. Proctor ME, Blair KA, Davis JP. Surveillance data for waterborne illness detection: an assess- ment following a massive waterborne outbreak of Cryptosporidium infection. Epidemiol Infect. health.gov.au/cdi Commun Dis Intell (2018) 2023;47 (https://doi.org/10.33321/cdi.2023.47.5) Epub 28/02/2023 11 of 12
1998;120(1):43–54. doi: https://doi.org/10.1017/s0950268897008327.

13. Rodman JS, Frost F, Jakubowski W. Using nurse hot line calls for disease surveillance. Emerg
  Infect Dis. 1998;4(2):329–32. doi: https://doi.org/10.3201/eid0402.980226.

14. Berger M, Shiau R, Weintraub JM. Review of syndromic surveillance: implications for water-
  borne disease detection. J Epidemiol Community Health. 2006;60(6):543–50. doi: https://doi.
  org/10.1136/jech.2005.038539.

15. Dale K, Kirk M, Sinclair M, Hall R, Leder K. Reported waterborne outbreaks of gastrointestinal
  disease in Australia are predominantly associated with recreational exposure. Aust N Z J Public
  Health. 2010;34(5):527–30. doi: https://doi.org/10.1111/j.1753-6405.2010.00602.x.

16. Cutler D, Miller G. The role of public health improvements in health advances: the twen-
  tieth-century United States. Demography. 2005;42(1):1–22. doi: https://doi.org/10.1353/
  dem.2005.0002.

17. National Health and Medical Research Council (NHMRC), National Resource Management
  Ministerial Council (NRMMC). National Water Quality Management Strategy: Australian Drink-
  ing Water Guidelines 6: 2011. [Internet]. Canberra: Australian Government, NHMRC, NRMMC;
  October 2017. Available from: https://www.nhmrc.gov.au/sites/default/files/documents/reports/
  aust-drinking-water-guidelines.pdf

18. Schober P, Vetter TR. Segmented regression in an interrupted time series study design. Anesth
  Analg. 2021;132(3):696–7. doi: https://doi.org/10.1213/ANE.0000000000005269.

19. Onyango LA, Quinn C, Tng KH, Wood JG, Leslie G. A study of failure events in drinking water
  systems as a basis for comparison and evaluation of the efficacy of potable reuse schemes. Environ
  Health Insights. 2016;9(Suppl 3):11–8. doi: https://doi.org/10.4137/EHI.S31749.

20. Motlagh AM, Yang Z. Detection and occurrence of indicator organisms and pathogens. Water
  Environ Res. 2019;91(10):1402–8. doi: https://doi.org/10.1002/wer.1238.

21. Hyllestad S, Amato E, Nygård K, Vold L, Aavitsland P. The effectiveness of syndromic surveil-
  lance for the early detection of waterborne outbreaks: a systematic review. BMC Infect Dis.
  2021;21(1):696. doi: https://doi.org/10.1186/s12879-021-06387-y.

22. Mouly D, Goria S, Mounié M, Beaudeau P, Galey C, Gallay A, et al. Waterborne disease outbreak
  detection: a simulation-based study. Int J Environ Res Public Health. 2018;15(7):1505. doi: htt-
  ps://doi.org/10.3390/ijerph15071505.

12 of 12             Commun Dis Intell (2018) 2023;47 (https://doi.org/10.33321/cdi.2023.47.5) Epub 28/02/2023   health.gov.au/cdi
You can also read