Internet Speed Measurement: Current Challenges and Future Recommendations
←
→
Page content transcription
If your browser does not render page correctly, please read the page content below
Internet Speed Measurement:
                                                   Current Challenges and Future Recommendations
                                                                               Nick Feamster                      Jason Livingood
                                                                             Princeton University                       Comcast

                                         Abstract                                                              constrained (bottleneck) link. This is no longer a good as-
                                         Government organizations, regulators, consumers, Internet             sumption, due to the significant increases in Internet access
arXiv:1905.02334v2 [cs.NI] 15 May 2019

                                         service providers, and application providers alike all have           speeds due to new technologies. Ten years ago, a typical
                                         an interest in measuring user Internet “speed”. A decade              ISP in the United States may have delivered tens of megabits
                                         ago, speed measurement was more straightforward. Today,               per second (Mbps). Today, it is common to have ten times
                                         as access speeds have increased by an order of magnitude—             faster (hundreds of megabits per second), and gigabit speeds
                                         many users have multi-hundred megabits per second service             are available to tens of millions of homes. As a result, the
                                         and gigabit speeds are available to tens of millions of homes—        performance bottleneck has often shifted from the ISP ac-
                                         conventional approaches to speed testing no longer accurately         cess network to a user’s device, home WiFi network, network
                                         reflect the user experience. Worse, some tests are increasingly       interconnections, speed testing infrastructure, and other areas.
                                         divorced from performance metrics that users care about—                 Content delivery on the Internet has significantly matured
                                         the performance of the applications that they use—and others          to the extent that it no longer mimics the design of most
                                         are completely unable to accurately measure contemporary              Internet speed tests. Many speed tests measure throughput
                                         broadband speeds. This paper offers historical and technical          with a connection to a single server. On the other hand,
                                         background on current speed testing methods, highlights their         today, each web page a user loads may initiate connections to
                                         limitations as access network speeds continue to increase, and        dozens or more servers, and users are dynamically directed to
                                         offers recommendations for the next generation of Internet            servers closest to them that utilize high capacity direct links
                                         “speed” measurement.                                                  to ISP networks. This content is generally delivered using
                                                                                                               distributed cloud services and Content Delivery Networks
                                         1 Introduction                                                        (CDNs), which have emerged as the dominant sources of
                                                                                                               content, and with streaming video as one of the dominant
                                         Various governmental organizations have begun to rely on
                                                                                                               applications. As a result, most content is now delivered from
                                         so-called “Internet speed tests” to measure broadband In-
                                                                                                               servers that are much closer to the user. Finally, even the most
                                         ternet speed. Examples of these programs include the Fed-
                                                                                                               throughput-intensive applications such as 4K video consume
                                         eral Communications Commission’s “Measuring Broadband
                                                                                                               only tens of megabits per second—far less capacity than a
                                         America” program [7], California’s CALSPEED program [4],
                                                                                                               user’s wired Internet access link often provides—so the speed
                                         the United Kingdom’s Home Broadband Performance Pro-
                                                                                                               of the access link is often no longer the key constraint on
                                         gram [23], and various other initiatives in states including
                                                                                                               performance.
                                         Minnesota [18], New York [19–21], and Pennsylvania [26].
                                                                                                                  These developments suggest the need to evolve our under-
                                         These programs have various goals, ranging from assessing
                                                                                                               standing of the utility of existing Internet speed test tools, and
                                         whether ISPs are delivering on advertised speeds to assessing
                                                                                                               consider how these tools may need to be redesigned to present
                                         potentially underserved rural areas that could benefit from
                                                                                                               a more representative measure of a user’s Internet experience.
                                         broadband infrastructure investments.
                                                                                                               We offer the following recommendations:
                                            Measurement accuracy is critical to these assessments, as
                                         it can inform everything from investment decisions to policy            1. Control for network factors that could affect a test, rang-
                                         actions and even litigation. Unfortunately, these efforts some-            ing from cross-traffic to the quality and capacity of the
                                         times rely on outmoded technology, making the resulting data               user’s WiFi network.
                                         unreliable or misleading. This paper describes the current              2. Prefer speed tests that operate as native applications,
                                         state of speed testing tools, outlines their limitations, and              use dedicated hardware, or are directly embedded into
                                         explores paths forward to better inform the various technical              hardware devices (e.g., customer premises equipment,
                                         and policy ambitions and outcomes.                                         set top boxes), as opposed to from the web browser.
                                            Some current speed test tools were well-suited to measur-            3. Publish and standardize speed testing methods to allow
                                         ing access link capacity a decade ago but are no longer useful             the community to converge not only on a common set of
                                         because they made a design assumption that the Internet Ser-               definitions and specifications, but also appropriate uses
                                         vice Provider (ISP) last mile access network was the most                  of these tests.

                                                                                                           1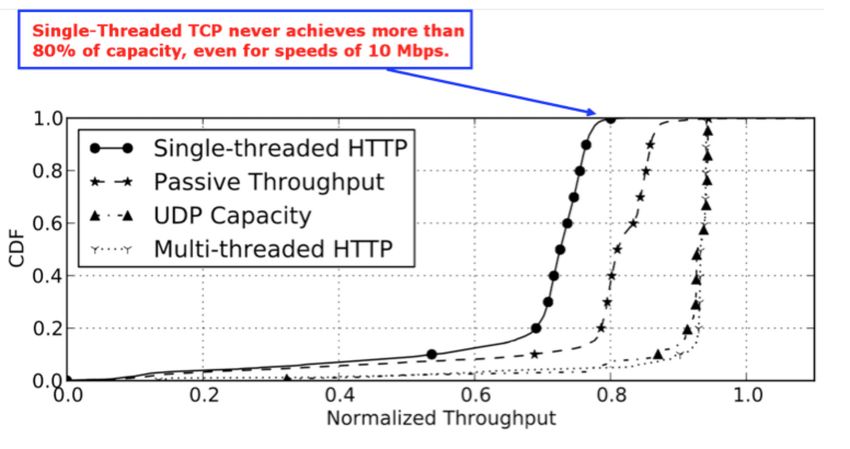
ing the amount of queueing or buffering along an end-to-end
                                                                         path, as well as the actual network path that traffic takes from
                                                                         one endpoint to another. TCP throughput is inversely propor-
                                                                         tional to end-to-end latency; all things being equal, then, a
                                                                         client will see a higher throughput to a nearby server than it
                                                                         will to a distant one.
                                                                         Jitter is the variation between two latency measurements.
                                                                         Less jitter is preferable.
                                                                         Packet Loss Rate is typically computed as the number of
                                                                         lost packets divided by the number of packets transmitted.
                                                                         Although high packet loss rates generally correspond to worse
                                                                         performance, some amount of packet loss is normal because a
                                                                         TCP sender typically uses packet loss as the feedback signal
                                                                         to determine the best transmission rate. Many applications
Figure 1: Example metrics from an Ookla Speedtest in New Jersey.         such as video streaming are designed to adapt well to packet
                                                                         loss without noticeably affecting the end user experience, so
                                                                         there is no single level of packet loss that automatically trans-
2 Background
                                                                         lates to poor application performance. Additionally, certain
In this section, we discuss and define key network perfor-               network design choices, such as increasing buffer sizes, can
mance metrics, introduce the general principles of Internet              reduce packet loss, but at the expense of latency, leading to a
“speed tests” and explore the basic challenges facing any speed          condition known as “buffer bloat” [3, 13].
test.
                                                                         2.2    Speed Test Principles and Best Practices
2.1    Performance Metrics
                                                                         Active Measurement. Today’s speed tests are generally re-
When people talk about Internet “speed”, they are generally              ferred to as active measurement tests, meaning that they at-
talking about throughput. End-to-end Internet performance is             tempt to measure network performance by introducing new
typically measured with a collection of metrics—specifically             traffic into the network (i.e., so-called “probe traffic). This is
throughput (i.e., “speed”), latency, and packet loss. Figure 1           in contrast to passive tests, which observe traffic passing over
shows an example speed test from a mobile phone on a home                a network interface to infer performance metrics. For speed
WiFi network. It shows the results of a “native” speed test              testing, active measurement is the recognized best practice,
from the Ookla Android speed test application run in New Jer-            but passive measurement can be used to gauge other perfor-
sey. This native application reports the users ISP, the location         mance factors, such as latency, packet loss, video quality, and
of the test server destination, and the following performance            so on.
metrics:                                                                 Measuring the Bottleneck Link. A typical speed test sends
Throughput is the amount of data that can be transferred be-             traffic that traverses many network links, including the WiFi
tween two network endpoints over a given time interval. For              link inside the user’s home network, the link from the ISP
example, throughput can be measured between two points in a              device in the home to the ISP network, and the many network
given ISP’s network, or it can be measured for an end-to-end             level hops between the ISP and the speed test server, which
path, such as between a client device and a server at some               is often hosted on a network other than the access ISP. The
other place on the Internet. Typically a speed test measures             throughput measurement that results from such a test in fact
both downstream (download), from server to client, and up-               reflects the capacity of the most constrained link, sometimes
stream (upload), from client to server (Bauer et al. [2] offer           referred to as the “bottleneck” link—the link along the end-to-
an in-depth discussion of throughput metrics). Throughput is             end path that is the limiting factor in end-to-end throughput.
not a constant; it changes from minute to minute based on a              If a user has a 1 Gbps connection to the Internet but their
wide range of factors, including what other users are doing              home WiFi network is limited to 200 Mbps, then any speed
on the Internet. Many network performance tests, such as                 test from a device on the WiFi network to the Internet will
the FCC test [7] and Ookla’s speed test, include additional              not exceed 200 Mbps. Bottlenecks can exist in an ISP access
metrics that reflect the user’s quality of experience.                   network, in a transit network between a client and server, in
Latency is the time it takes for a single data packet to travel to       the server or server data-center network, or other places. In
a destination. Typically latency is measured in terms of round-          many cases the bottleneck is located somewhere along the
trip latency, since measuring one-way latency would require              end-to-end path that is not under the ISPs or user’s direct
tight time synchronization and the ability to instrument both            control.
sides of the Internet path. Latency generally increases with             Use of Transmission Control Protocol. Speed tests typi-
distance, due to factors such as the speed of light for optical          cally use the Transmission Control Protocol (TCP) to mea-
network segments; other factors can influence latency, includ-           sure throughput. In keeping with the nature of most Internet

                                                                     2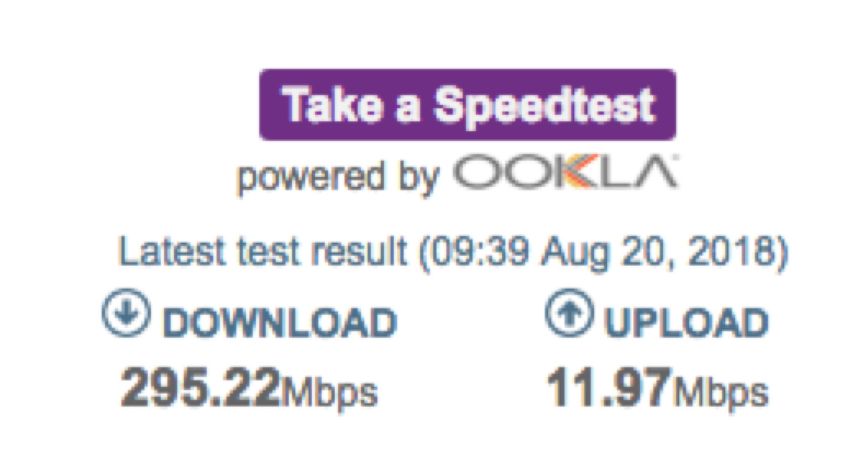
(b) Internet Health Test runs
                                                                                                             in succession to six different
                                                                                                             servers. The test measures con-
                   Figure 2: TCP Dynamics.
                                                                        (a) Five successive runs of          sistently lower throughput and
                                                                        Ookla Speedtest yield vari-          also shows variability, both
application transfers today—including, most notably, web                able results on downstream           to different servers and across
browsers—most speed tests use multiple parallel TCP con-                throughput.                          successive test runs.
nections. Understanding TCP’s operation is critical to the
design of an accurate speed test. Any TCP-based speed test                    Figure 3: Successive runs of different throughput tests.
should be: (1) long enough to measure steady-state transfer,
not just TCP slow start; (2) recognize that TCP transmis-               3.1    User-Related Considerations
sion rates naturally vary over time, and (3) use multiple TCP
connections. Figure 2 shows TCP’s dynamics, including the               The home wireless network. Speed tests that are run over a
initial slow start phase. During TCP slow start, the transmis-          home wireless connection often reflect a measurement of the
sion rate is far lower than the network capacity. Including             user’s home wireless connection, not that of the access ISP,
this period as part of a throughput calculation will result in a        because the WiFi network itself is usually the lowest capacity
throughput measurement that is less than the actual available           link between the user and test server [1,5,16,25,27,30]. Many
network capacity. If test duration is too short, the test will          factors affect the performance of the user’s home wireless
tend to underestimate throughput. As a result, accurate speed           network, including: distance to the WiFi Access Point (AP)
test tools must account for TCP slow start. Additionally, in-           and WiFi signal strength, technical limitation of a wireless
stantaneous TCP throughput continually varies because the               device and/or AP, other users and devices operating on the
sender tries to increase its transfer rate in an attempt to find        same network, interference from nearby APs using the same
and use any spare capacity (a process known as “additive                spectrum, and interference from non-WiFi household devices
increase multiplicative decrease” or AIMD).                             that operate on the same spectrum (e.g., microwave ovens,
                                                                        baby monitors, security cameras).
Inherent Variability. A speed test measurement can produce
highly variable results. Figure 3 shows an illustrative example            Many past experiments demonstrate that the user’s WiFi—
of typical variability that a speed test might yield, both for          not the ISP—is often the network performance bottleneck.
Internet Health Test (IHT) and Ookla Speedtest. These mea-              Sundaresan et al. found that whenever downstream through-
surements were performed successively on the same Comcast               put exceeded 25 Mbps, the user’s home wireless network
connection provisioned for 200 Mbps downstream and 10                   was almost always the bottleneck [30]. Although the study is
Mbps upstream throughput. The tests were performed in                   from 2013, and both access link speeds and wireless network
succession. Notably, successive tests yield different measure-          speeds have since increased, the general trend of home wire-
ments. IHT, a web front-end to NDT, also consistently and               less bottlenecks is still prevalent, especially given that many
significantly under-reports throughput, especially at higher            users continue to use older wireless devices in their homes
speeds.                                                                 (e.g., old iPads and home routers) that do not support higher
                                                                        speeds.
3 Limitations of Existing Speed Tests                                   Client hardware and software. Client types range from
Existing speed tests have a number of limitations that have             dedicated hardware, to software embedded in a device on
become more acute in recent years, largely as a result of faster        the user’s network, to native software made for a particular
ISP access links and the proliferation of home wireless net-            user operating system, and web browsers. Client type has
works. The most profound change is that as network access               an important influence on the test results, because some may
links have become faster, the network bottleneck has moved              be inherently limited or confounded by user factors. Dedi-
from the ISP access link to elsewhere on the network. A                 cated hardware examples include the SamKnows whitebox
decade ago, the network bottleneck was commonly the access              and RIPE Atlas probe. Embedded software refers to exam-
ISP link; with faster ISP access links, the network bottleneck          ples where the software is integrated into an existing network
may have moved any number of places, from the home wire-                device such as cable modem, home gateway device, or WiFi
less network to the user’s device itself. Other design factors          access point. A native application is software made specif-
may also play a role, including how measurement samples                 ically to run on a given operating system such as Android,
are taken and the provisioning of the test infrastructure itself.       iOS, Windows, and Mac OS. Finally, web-based tests simply

                                                                    3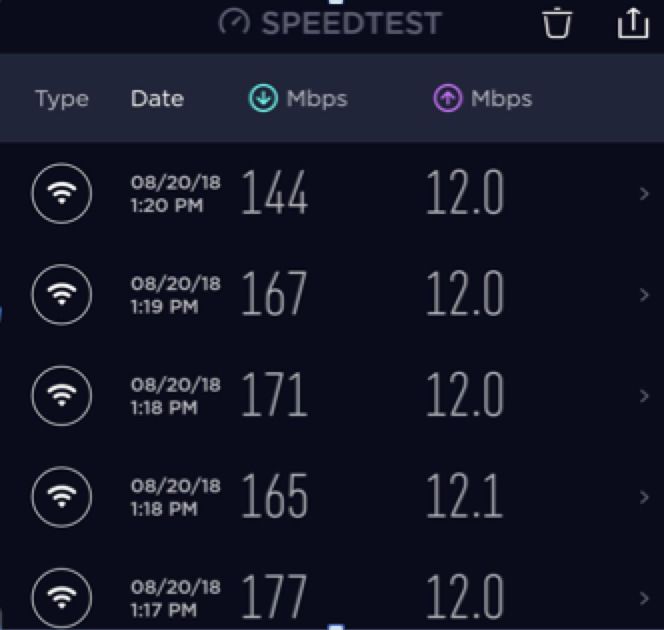
the same speed test (i.e., Ookla Speedtest), on the same net-
work, performed immediately following the router-based test
using native software on a mobile device over WiFi. The
throughput reported from the user’s mobile device on the
home network is almost half of the throughput that is reported
when the speed test is taken directly from the router.
Competing “cross traffic”. At any given time, a single
network link is simultaneously carrying traffic from many
senders and receivers. Thus, any single network transfer must
share the available capacity with the competing traffic from
other senders—so-called cross traffic. Although sharing ca-
pacity is natural for normal application traffic, a speed test
that shares the available capacity with competing cross traf-
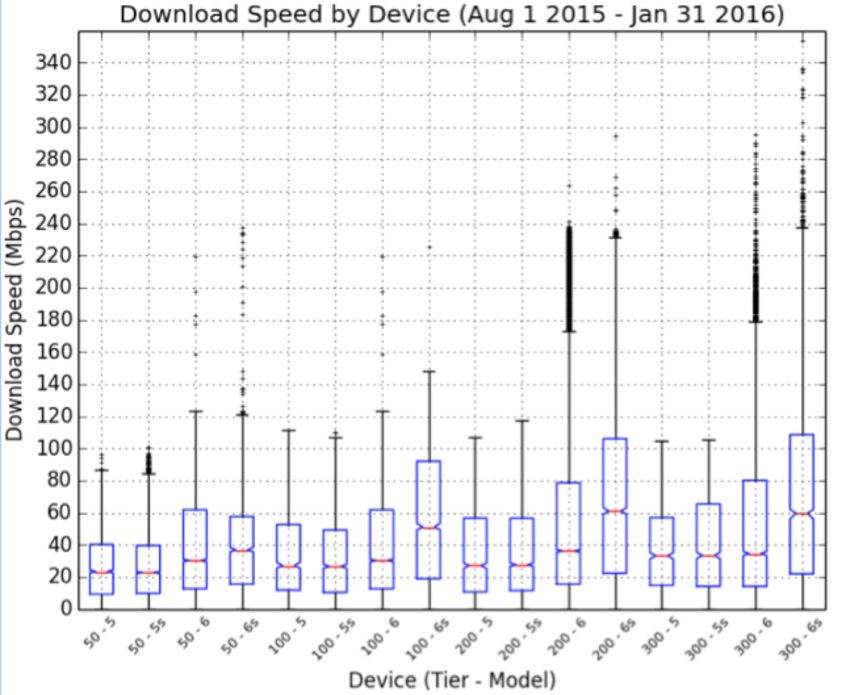
Figure 4: Distribution of download speeds across different device fic will naturally underestimate the total available network
types. Older devices do not support 802.11ac, so fail to consistently capacity. Client-based speed tests cannot account for cross
hit 100 Mbps.
traffic because the client cannot see other traffic on the same
network, whereas a test that runs on the user’s home router
can account for cross traffic when conducting throughput
measurements.
3.2 Wide-Area Network Considerations
Impaired ISP Access Network Links An ISP’s “last mile”
access network links can become impaired. For example,
the quality of a DOCSIS connection to a home can become
impaired by factors such as a squirrel chewing through a line
or a bad ground wire. Similarly, fixed wireless connections
can be impaired by weather or leaves blocking the antenna.
To mitigate the potential for an individual impairment unduly
influencing ISP-wide results, tests should be conducted with
(a) Ookla router-based test. (b) Ookla native desktop test. a large number of users.
Access ISP capacity. Capacity constraints within an ISP’s
Figure 5: Ookla Speedtest, router-based test and native desktop test network can exist, whether in the access network, regional net-
from the same home network. work (metropolitan area), or backbone network. Regional and
backbone networks generally have significant excess capacity
run from a web browser. In general, dedicated hardware and so the only periods when they may be constrained would be
embedded software approaches tend to be able to minimize the result of a disaster (e.g., hurricane damage) or temporary
the effect of user-related factors and are more accurate as a conditions such fiber cuts or BGP hijacking. Usually ISP
result. capacity constraints arise in the last mile access networks,
Factors such as memory, CPU, operating system, and net- which are by nature shared in the first mile or first network
work interface card (NIC) can significantly affect throughput element, (e.g., passive optical networking (PON), DOCSIS,
measurements. For example, if a user has a 100 Mbps Ether- DSL, 4G/5G, WiFi, point-to-point wireless). ISPs take steps
net card in their PC connected to a 1 Gbps Internet connection, to detect increases in utilization and then add capacity, such
their speed tests will never exceed 100 Mbps and that test as via node splits (DOCSIS) or adding radio towers (4G/5G).
result cannot be said to represent a capacity issue in the ISP While most ISPs do a good job of managing capacity, this can
network; it is a device limitation. As a result, many ISPs doc- still be problematic on a short-term basis (e.g., large public
ument recommended hardware and software standards [32], event).
especially for 1 Gbps connections. The limitations of client Transit and interconnect capacity. Another significant con-
hardware can be more subtle. Figure 4 shows an example sideration is the connection to “transit” and “middle mile”
using iPhone released in 2012–2015. This shows that any networks. The interconnects between independently oper-
user with an iPhone 5s or older is unlikely to reach 100 Mbps, ated networks may also introduce throughput bottlenecks. As
likely due to the lack of a newer 802.11ac wireless interface. user speeds reach 1 Gbps, ensuring that there are no capacity
Router-based testing vs. device-based testing. Figure 5 constraints on the path between the user and test server—
shows an example of two successive speed tests. Figure 5a especially across transit networks—is a major consideration.
uses software embedded in the users router, so that no other In one incident in 2013, a bottleneck in the Cogent transit
effects of the local network could interfere. Figure 5b shows network reduced NDT throughput measurements by as much
4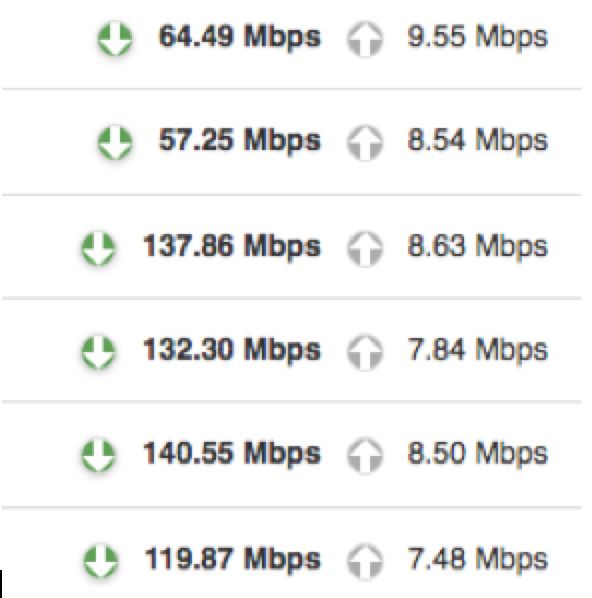
as 90%. Test results improved when Cogent began prioritiz-
ing NDT test traffic over other traffic. Transit-related issues
have often affected speed tests. In the case of the FCC’s MBA
platform, this prompted them to add servers on the Level 3
network to isolate the issues experienced with M-Lab’s in-
frastructure and the Cogent network, and M-Labs has also
added additional transit networks to reduce their reliance on
one network.                                                             (a) Internet Health Test mistak-    (b) Ookla Speedtest directing
Middleboxes. End-to-end paths often have devices along the               enly locating a client in Prince-   a client in Princeton, NJ to
path, called “middleboxes”, which can affect performance.                ton, NJ to Philadelphia, PA         an on-net Speedtest server in
For example, a middlebox may perform load balancing or                   (50+ miles away), and per-          Plainfield, NJ. Ookla also al-
security functions (e.g., malware detection, firewalls). As              forming a speed test to a server    lows a user to select another
                                                                         to New York City.                   nearby server.
access speeds increase, the capacity of middleboxes may
increasingly be a constraint, which will mean that test results                         Figure 6: IHT and Ookla geolocation.
will reflect the capacity of those middleboxes rather than the
access link or other measurement target.
Rate-limiting. Application-layer or destination-based rate               ments. Similarly, the data center switches or other network
limiting, often referred to as throttling, can also cause the            equipment to which the servers connect may be experienc-
performance that users experience to diverge from conven-                ing technical problems or be subject to other performance
tional speed tests. Choffnes et al. have developed Wehe,                 limitations. In the case of the FCC MBA reports, at one
which detects application-layer rate limiting [31]; thus far,            point this resulted in discarding of data collected from M-Lab
the research has focused on HTTP-based video streaming                   servers due to severe impairments [6, 9]. The connection
de-prioritization and rate-limiting. Such rate limiting could            between a given data-center and the Internet may also be
exist at any point on the network path, though most com-                 constrained, congested, or otherwise technically impaired, as
monly it may be expected in an access network or on the                  was the case when some M-Lab servers were single-homed to
destination server network. In the latter case, virtual servers          a congested Cogent network. Finally, the servers themselves
or other hosted services may be priced by peak bitrate and               may be limited in their capacity: if, for example, a server has
therefore a hard-set limit on total peak bitrate or per-user-flow        a 1 Gbps Ethernet connection (with real-world throughput
bitrate may exist. Web software such as Nginx has features               below 1 Gbps) then the server cannot be expected to mea-
for configuring rate limiting [22], as cloud-based services              sure several simultaneous 1 or 2 Gbps tests. Many other
may charge by total network usage or peak usage; for exam-               infrastructure-related factors can affect a speed test, including
ple, Oracle charges for total bandwidth usage [24], and FTP              server storage input and output limits, available memory and
services often enforce per-user and per-flow rate limits [12].           CPU, and so on. Designing and operating a high scale, reli-
                                                                         able, high performance measurement platform is a difficult
Rate-boosting. Rate-boosting is the opposite of rate limiting;
                                                                         task, and as more consumers adopt 1 Gbps services this may
it can enable a user to temporarily exceed their normal pro-
                                                                         become even more challenging [17].
visioned rate for a limited period. For example, a user may
a 100 Mbps plan but may be allowed to burst to 250 Mbps                     Different speed test infrastructures have different means
for limited periods if spare capacity exists. This effect was            for incorporating measurement servers into their infrastruc-
noted in the FCCs first MBA report in 2011 and led to use of             ture. Ookla allows volunteers to run servers on their own
a longer duration test to measure “sustained speeds [8]. Such            and contribute these servers to the list of possible servers that
rate-boosting techniques appear to have fallen out of favor,             users can perform tests against. Ookla uses empirical mea-
perhaps partly due greater access speeds or the introduction             surements over time to track the performance of individual
of new technologies such as DOCSIS channel bonding.                      servers. Those that perform poorly over time are removed
                                                                         from the set of candidate servers that a client can use. Mea-
3.3    Test Infrastructure Considerations                                surement Lab, on the other hand, uses a fixed, dedicated set of
Because speed tests based on active measurements rely on                 servers as part of a closed system and infrastructure. For many
performing measurements to some Internet endpoint (i.e., a               years, these servers have been: (1) constrained by a 1 Gbps
measurement server), another possible source of a perfor-                uplink; (2) shared with other measurement experiments (re-
mance bottleneck is the server infrastructure itself.                    cently, Measurement Lab has begun to upgrade to 10 Gbps
                                                                         uplinks). Both of these factors can and did contribute to the
Test infrastructure provisioning. The test server infrastruc-
                                                                         platform introducing its own set of performance bottlenecks.
ture must be adequately provisioned so that it does not become
the bottleneck for the speed tests. In the past, test servers have       Server placement and selection. A speed test estimates the
been overloaded, misconfigured, or otherwise not performing              available capacity of the network between the client and the
as necessary, as has been the case periodically with M-Lab               server. Therefore, the throughput of the test will naturally
servers used for both FCC MBA testing and NDT measure-                   depend on the distance between these endpoints as measured

                                                                     5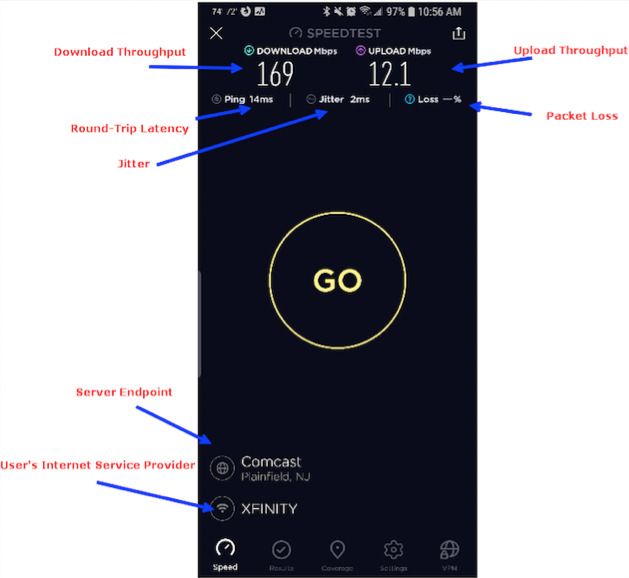
by a packet’s round trip time (RTT). This is extremely impor-
tant, because TCP throughput is inversely proportional to the
RTT between the two endpoints. For this reason, speed test
clients commonly attempt to find the “closest” throughput
measurement server to provide the most accurate test result
and why many speed tests such as Ookla’s, use thousands
of servers distributed around the world. to select the clos-
est server, some tests use a process called “IP geolocation”,
whereby a client location is determined from its IP address.
Unfortunately, IP geolocation databases are notoriously inac-
curate, and client location can often be off by thousands of
miles. Additionally, latency resulting from network distance                   Figure 7: Throughput vs. number of TCP threads. [29]
typically exceeds geographic distance, since network paths
between two endpoints can be circuitous, and other factors
                                                                          test is effectively sharing the link with itself), a transfer using
such as network congestion on a path can affect latency. Some
                                                                          multiple connections is more resistant to network disruptions
speed tests mitigate these effects with additional techniques.
                                                                          that may result in the sender re-entering TCP slow start after
For example, Ookla’s Speedtest uses IP geolocation to select
                                                                          a timeout due to lost packets.
an initial set of servers that are likely to be close, and then the
                                                                              A single TCP connection cannot typically achieve a
client selects from that list the one with the lowest RTT (other
                                                                          throughput approaching full link capacity, for two reasons:
factors may also play into selection, such as server network
                                                                          (1) a single connection takes longer to send at higher rates
capacity). Unfortunately, Internet Health Test (which uses
                                                                          because TCP slow start takes longer to reach link capacity,
NDT) and others rely strictly on IP geolocation.
                                                                          and (2) a single connection is more susceptible to temporarily
   Figure 6 shows stark differences in server selection be-               slowing down transmission rates when it experiences packet
tween two tests,: Internet Health Test (which relies on IP                loss (a common occurrence on an Internet path). Technical
geolocation and has a smaller selection of servers); and Ookla            data make clear that single connection tests are inaccurate,
Speedtest (which uses a combination of IP geolocation, GPS-               outmoded, and should not be used. Past research concluded
based location from mobile devices, and RTT-based server                  that a speed test should have at least four parallel connec-
selection to a much larger selection of servers). Notably, the            tions to accurately measure throughput. For the same reason,
Internet Health Test not only mis-locates the client (determin-           modern web browsers typically open as many as six parallel
ing that a client in Princeton, New Jersey is in Philadelphia),           connections to a single server in order to maximize use of
but it also selects a server that is in New York City, which is           available network capacity between the client and web server.
more than 50 miles from Princeton. In contrast, the Ookla test,           Previous experiments of a DSL link as far back as 2010 found
which selects an on-network Comcast server in Plainfield, NJ,             that even on low-capacity links, a single TCP connection,
which is merely 21 miles away, and also gives the user the                such as that used by NDT, could only fill an access network
option of using closer servers through the “Change Server”                to about 70% of overall capacity. Ookla Speedtest has been
option.                                                                   using multiple TCP connections since 2003. Figure 7, from a
                                                                          study by Sundaresan et al. in 2011 [29], also summarizes this
3.4    Test Design Considerations                                         result.
Number of parallel connections. A significant considera-                  Test duration. The length of a test and the amount of data
tion in the design of a speed test is the number of parallel              transferred also significantly affect test results. As previously
TCP connections that the test uses to transfer data between               described, a TCP sender does not immediately begin sending
the client and server, since the goal of a speed test is to send          traffic at full capacity but instead begins in TCP slow start un-
as much data as possible and this is usually only possible                til the sending rate reaches a pre-configured threshold value,
with multiple TCP connections. Even in steady state, a single             at which point it begins AIMD congestion avoidance. As
TCP connection will attempt to “fairly” share the available               a result, if a transfer is too short, a TCP sender will spend
network capacity with other competing cross traffic. For ex-              a significant fraction of the total transfer in TCP slow start,
ample, if the capacity of a path is 100 Mbps and there are                ensuring that the transfer rate will fall far short of available
two active flows traversing the link, then in steady state, each          capacity. For this reason, many Internet applications, includ-
TCP flow will achieve approximately 50 Mbps on average, in                ing web browsers, reuse multiple TCP connections transfer-
the long term. For a speed test, this type of sharing behavior            ring multiple objects between server and browser. As access
is suboptimal, since the estimated capacity would be half of              speeds increase, most test tools have also needed to increase
the available link capacity. Using multiple connections in par-           test duration.
allel allows a TCP sender to more quickly and more reliably               Throughput calculation. The methodology that tests use to
achieve the available link capacity. In addition to achieving a           calculate results appears to vary widely; often this methodol-
higher share of the available capacity (because the throughput            ogy is not disclosed. Tests may discard some high and/or low

                                                                      6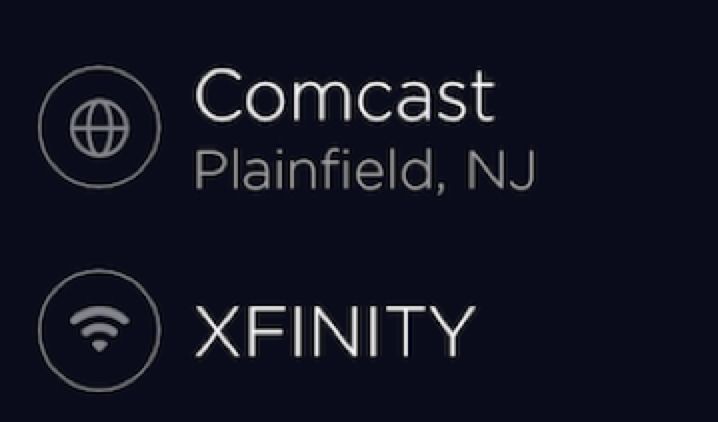
results, may use the median or the mean, may take only the             many policy, regulatory, and investment decisions are based
highest result and discard the rest, etc. This makes different         on speed measurements. As access network speeds increase
tests difficult to compare. Finally, some tests may include all        and the performance bottlenecks move elsewhere on the path,
of the many phases of a TCP transfer, even though some of              speed test design must evolve to keep pace with both faster
those phases are necessarily at rates below the capacity of a          network technology and evolving user expectations. We rec-
link:                                                                  ommend the following:
  • the slow start phase at the beginning of a transfer (which         Retire outmoded tools such as NDT. NDT, also known as
    occurs in every TCP connection);                                   the Internet Health Test [15], may appear at first glance to
  • the initial additive increase phase of the TCP transfer            be suitable for speed tests. This is not the case, though it
    when the sender is actively increasing its sending rate            continues to be used for speed measurement despite its un-
    but before it experiences the first packet loss that results       suitability and proven inaccuracy [11]. Its inadequacy for
    in multiplicative decrease;                                        measuring access link speeds has been well-documented [2].
  • any packet loss episode which results in a TCP timeout,            One significant problem is that NDT still uses a single TCP
    and subsequent re-entry into slow start                            connection, nearly two decades after this was shown to be in-
                                                                       adequate for measuring link capacity. NDT is also incapable
   Estimating the throughput of the link is not as simple as di-
                                                                       of reliably measuring access link throughput for speeds of
viding the amount of data transferred by the total time elapsed
                                                                       100 Mbps or more, as we enter an era of gigabit speeds. The
over the course of the transfer. A more accurate estimate of
                                                                       test also includes the initial TCP slow start period in the result,
the transfer rate would instead measure the transfer during
                                                                       leading to a lower value of average throughput than the link
steady state AIMD, excluding the initial slow start period.
                                                                       capacity can support in TCP steady state. It also faces all of
Many standard throughput tests, including the FCC/Sam-
                                                                       the user-related considerations that we discussed in Section 3.
Knows test, omit the initial slow start period. The Ookla
                                                                       It is time to retire the use of NDT for speed testing and look
test implicitly omits this period by discarding low-throughput
                                                                       ahead to better methods.
samples from its average measurement. The NDT test in-
cludes this period, however, which will result in a lower value        Use native, embedded, and dedicated measurement tech-
of average throughput than the link capacity can support in            niques and devices. Web-based tests (many of which rely
steady state.                                                          on Javascript) cannot transfer data at rates that exceed several
                                                                       hundred megabits per second. As network speeds increase,
Self-selection bias. Speed tests that are initiated by a user
                                                                       speed tests must be “native” applications or run on embed-
suffer from self-selection bias [14]: many users initiate such
                                                                       ded devices (e.g., home router, Roku, Eero, AppleTV) or
tests only when they are experiencing a technical problem or
                                                                       otherwise dedicated devices (e.g., Odroid, Raspberry Pi, Sam-
are reconfiguring their network. For example, when config-
                                                                       Knows “white box”, RIPE Atlas probes).
uring a home wireless network, a user may run a test over
WiFi, then re-position their WiFi AP and run the test again.           Control for factors along the end-to-end path when ana-
These measurements may help the user optimize the place-               lyzing results. Section 3 outlined many factors that can affect
ment of the wireless access point but, by design, they reflect         the results of a speed test other than the capacity of the ISP
the performance of the user’s home wireless network, not that          link—ranging from cross-traffic in the home to server location
of the ISP. Tests that are user-initiated, ranging from NDT            and provisioning. As access ISP speeds increase, these lim-
to web-based Speedtest.net, are more likely to suffer from             iting factors become increasingly important, as bottlenecks
self-selection bias. It can be difficult to use these results to       elsewhere along the end-to-end path become increasingly
draw conclusions about an ISP, geographic region, and so               prevalent.
forth.                                                                 Measure to multiple destinations. As access network
Infrequent testing. If tests are too infrequent or are only            speeds begin to approach and exceed 1 Gbps, it can be diffi-
taken at certain times of day, the resulting measurements may          cult to identify a single destination and end-to-end path that
not accurately reflect a user’s Internet capacity. An analogy          can support the capacity of the access link. Looking ahead, it
would be looking out a window once per day in the evening,             may make sense to perform active speed test measurements
seeing it was dark outside, and concluding that it must be dark        to multiple destinations simultaneously, to mitigate the possi-
24 hours a day. Additionally, if the user only conducts a test         bility that any single destination or end-to-end network path
when there is a transient problem, the resulting measurement           becomes the network bottleneck.
may not be representative of the performance that a user               Augment active testing with application quality metrics.
typically experiences. Automatic tests run multiple times              In many cases, a user’s experience is not limited by the ac-
per day at randomly selected times during peak and off-peak            cess network speed, but rather the performance of a particular
times can account for some of these factors.                           application (e.g., streaming video) under the available net-
                                                                       work conditions. As previously mentioned, even the most
4 The Future of Speed Testing                                          demanding streaming video applications require only tens of
Speed testing tools will need to evolve as end user connec-            megabits per second, yet user experience can still suffer as a
tions approach and exceed 1 Gbps, especially given that so

                                                                   7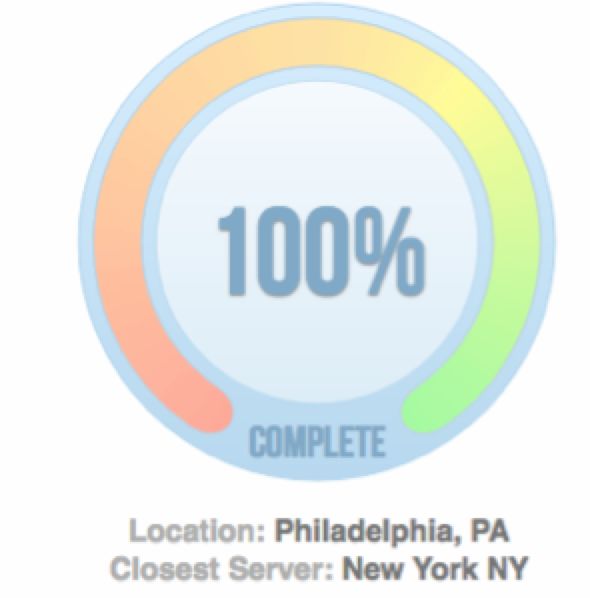
result of application performance glitches, such as changes                       [14] J. J. Heckman. Selection bias and self-selection. In Econometrics,
in resolution or rebuffering. As access network speeds in-                             pages 201–224. 1990. (Cited on page 7.)
crease, it will be important to monitor not just “speed testing”                  [15] Internet Health Test, 2019. http://internethealthtest.
                                                                                       org/. (Cited on page 7.)
but also to develop new methods that can monitor and infer
quality metrics for a variety of applications.                                    [16] Change the Wi-Fi Channel Number to Avoid Interference, 2018.
                                                                                       https://www.lifewire.com/wifi-channel-number-
Adopt standard, open methods to facilitate better com-                                 change-to-avoid-interference-818208.             (Cited on
parisons. It is currently very difficult to directly compare                           page 3.)
the results of different speed tests, because the underlying                      [17] J. Livingood. Measurement Challenges in the Gigabit Era, June 2018.
methods and platforms are so different. Tools that select the                          https://blog.apnic.net/2018/06/21/measurement-
                                                                                       challenges-in-the-gigabit-era/. (Cited on page 5.)
highest result of several sequential tests, or the average of
several, or the average of several tests after the highest and                    [18] CheckspeedMN.     https://mn.gov/deed/programs-
                                                                                       services/broadband/checkspeedmn. (Cited on page 1.)
lowest have been discarded. As the FCC has stated [10]: “A
                                                                                  [19] A.G. Schneiderman Encourages New Yorkers To Test Internet Speeds
well documented, public methodology for tests is critical to                           And Submit Results As Part Of Ongoing Investigation Of Broadband
understanding measurement results.”                                                    Providers, 2017. https://ag.ny.gov/press-release/ag-
   Beyond being well-documented and public, the commu-                                 schneiderman-encourages-new-yorkers-test-
nity should also come to agreement on a set of standards for                           internet-speeds-and-submit-results-part. (Cited
                                                                                       on page 1.)
measuring access link performance and adopt those standards
across test implementations.                                                      [20] Are You Getting The Internet Speeds You Are Paying For? https:
                                                                                       //ag.ny.gov/SpeedTest. (Cited on page 1.)
References                                                                        [21] New York State Broadband Program Office - Speed Test. https:
 [1] Apple: Resolve Wi-Fi and Bluetooth Issues Caused by Wireless                      //nysbroadband.ny.gov/speed-test. (Cited on page 1.)
     Interference, 2019. https://support.apple.com/en-us/                         [22] Nginx Rate Limiting, 2019. https://www.nginx.com/blog/
     HT201542. (Cited on page 3.)                                                      rate-limiting-nginx/. (Cited on page 5.)
 [2] S. Bauer, D. D. Clark, and W. Lehr. Understanding Broadband Speed            [23] Broadband Speeds: Research on fixed line home broadband speeds,
     Measurements. In Technology Policy Research Conference (TPRC),                    mobile broadband performance, and related research. https:
     2010. (Cited on pages 2 and 7.)                                                   //www.ofcom.org.uk/research-and-data/telecoms-
 [3] Bufferbloat. https://www.bufferbloat.net.                 (Cited on               research/broadband-research/broadband-speeds.
     page 2.)                                                                          (Cited on page 1.)
 [4] CALSPEED Program, 2019. http://cpuc.ca.gov/General.                          [24] Oracle IaaS Pricing, 2019. https://cloud.oracle.com/en_
     aspx?id=1778. (Cited on page 1.)                                                  US/iaas/pricing. (Cited on page 5.)
 [5] Avoiding Interference in the 2.4-GHz ISM Band, 2006. https:                  [25] Six Things That Block Your Wi-Fi, and How to Fix Them, 2011.
     //www.eetimes.com/document.asp?doc_id=1273359.                                    https://www.pcworld.com/article/227973/six_
     (Cited on page 3.)                                                                things_that_block_your_wifi_and_how_to_fix_
                                                                                       them.html. (Cited on page 3.)
 [6] FCC Re: Measuring Broadband America Program (Fixed), GN Docket
     No. 12264, Aug. 2013. https://ecfsapi.fcc.gov/file/                          [26] A Broadband Challenge:      Reliable broadband internet ac-
     7520939594.pdf. (Cited on page 5.)                                                cess remains elusive across Pennsylvania, and a Penn State
                                                                                       faculty member is studying the issue and its impact, 2018.
 [7] FCC: Measuring Broadband America Program. https://www.fcc.                        https://news.psu.edu/story/525994/2018/06/28/
     gov/general/measuring-broadband-america. (Cited                                   research/broadband-challenge. (Cited on page 1.)
     on pages 1 and 2.)
                                                                                  [27] The 2.4 GHz Spectrum Congestion Problem and AP Form-
 [8] Measuring Broadband America. Technical report, Federal Communi-                   Factors, 2015.     http://www.revolutionwifi.net/
     cations Commission, 2011. https://transition.fcc.gov/                             revolutionwifi/2015/4/the-dual-radio-ap-
     cgb/measuringbroadbandreport/Measuring_U.S._-                                     form-factor-is-to-blame-for-24-ghz-spectrum-
     _Main_Report_Full.pdf. (Cited on page 5.)                                         congestion. (Cited on page 3.)
 [9] FCC MBA Report 2014, 2014. https://www.fcc.gov/                              [28] SamKnows Test Methodology White Paper, Dec. 2011.
     reports-research/reports/measuring-broadband-                                     https://availability.samknows.com/broadband/
     america/measuring-broadband-america-2014. (Cited                                  uploads/Methodology_White_Paper_20111206.pdf.
     on page 5.)                                                                       (Not cited.)
[10] M-Lab Discussion List: MLab speed test is incorrect?, 2018.                  [29] S. Sundaresan, W. De Donato, N. Feamster, R. Teixeira, S. Crawford,
     https://groups.google.com/a/measurementlab.                                       and A. Pescapè. Broadband Internet Performance: A View from the
     net/forum/#!topic/discuss/vOTs3rcbp38. (Cited on                                  Gateway. In ACM SIGCOMM, pages 134–145, Aug. 2011. (Cited
     page 8.)                                                                          on page 6.)
[11] Letter to FCC on Docket No. 17-108, 2014. https:                             [30] S. Sundaresan, N. Feamster, and R. Teixeira. Home Network or Access
     //ecfsapi.fcc.gov/file/1083088362452/fcc-17-                                      Link? Locating Last-mile Downstream Throughput Bottlenecks. In
     108-reply-aug2017.pdf. (Cited on page 7.)                                         International Conference on Passive and Active Network Measurement
[12] FTP Rate Limiting, 2019. https://forum.filezilla-                                 (PAM), pages 111–123, 2016. (Cited on page 3.)
     project.org/viewtopic.php?t=25895.      (Cited on                            [31] Wehe, 2019. https://dd.meddle.mobi. (Cited on page 5.)
     page 5.)
                                                                                  [32] Xfinity Internet Minimum System Recommendations. https://
[13] J. Gettys. Bufferbloat: Dark Buffers in the Internet. In IEEE Internet            www.xfinity.com/support/articles/requirements-
     Computing, 2011. (Cited on page 2.)                                               to-run-xfinity-internet-service. (Cited on page 4.)

                                                                              8
You can also read