Intentions and Views around COVID-19 Vaccination Among K- 12 Populations
←
→
Page content transcription
If your browser does not render page correctly, please read the page content below

JUNE 2021

Intentions and Views around
COVID-19 Vaccination Among K-
12 Populations
Findings from Parents, Teachers and School Leadership:
February - April 2021

M O N I T O R I N G S C H O O L C O V I D - 1 9 P R E V E N T I O N S T R AT E G I E S
P R O J E C T: T R I A N G U L AT E D R E P O R T

INTRODUCTION

Project Background
To make informed decisions, public health, schools and elected officials need
timely, actionable and school-specific data to help successfully prevent the
spread of the COVID-19 virus in K-12 settings—and to make sure schools
can open for in-person learning and stay open safely.

The CDC Foundation, in partnership with Deloitte and technical assistance
from the Centers for Disease Control and Prevention (CDC), launched the
Monitoring School COVID-19 Prevention Strategies project to collect data on
the impact of COVID-19 on the social, emotional, academic and mental
health of the K-12 community. Through multiple data collection methods, the
aim of the project is to collect, analyze and disseminate near real-time data to:
• Help school districts and community members (e.g., superintendents,
    principals, teachers, parents, students) make actionable, informed,
    data-driven decisions to prevent the spread of the COVID-19 virus in
    K-12 settings.
•   Characterize policies, practices and interventions to support
    implementation of school COVID-19 prevention strategies.
•   Build awareness around successes and challenges related to COVID-
    19 in K-12 settings.
•   Improve understanding of social, emotional, academic and mental
    health impacts on school communities.

                                                                                    Parent helping a child get ready for school
                                                                                                                                  2
INTRODUCTION

Report Overview
Purpose
The purpose of this report is to triangulate data across several data collection methods,
from different perspectives to better understand the K-12 school communities’ intentions
and sentiments towards COVID-19 vaccinations and impacts to general school                                          Surveys
vaccinations during the 2020/2021 school year. Findings represent school community
                                                                                                                       Identify key
perspectives between February and April 2021. The goal is to inform decisions and                              differences in vaccination
improve support to help schools reopen for in-person learning and stay open safely.                           beliefs across respondent
                                                                                                              groups and demographics,
Audience                                                                                                    comparing crowdsourced data
                                                                                                                to panel data to validate
This report is intended to be used by public health professionals, school policy makers,                                 findings
and the school community to better understand differences in COVID-19 vaccination
intentions and plans among various groups within K-12 school communities.                            COVID-19 Vaccination
                                                                                                           Insights
Contents                                                                                                       +
                                                                                                         Public Health
•   Data Sources and Methodology
                                                                                              Focus         Action                          Social
•   Overview of Findings and Implications                                                     Groups                                        Media
                                                                                         Add nuance to survey                       Add further nuance and
•   Parent Findings                                                                    findings using qualitative                      identify additional
                                                                                         data from discussions                      emerging trends related
•   Teacher Findings                                                                      about vaccinations                         to vaccination, without
                                                                                                                                         observer effects
•   School Leadership Findings
•   Conclusion
                                                                                                    Triangulation approach
•   Appendix

                                                                                                                                                               3
INTRODUCTION

Report Focus and Guiding Questions

This report aims to inform three guiding questions:

      COVID-19 VACCINATION INTENTIONS
1     What are the plans and sentiments around COVID-19 vaccination from each respondent group
      (parents, teachers, and principals)?

2     DISPARITIES & ASSOCIATIONS
      For each group, do COVID-19 vaccination intentions differ across demographic or school
      characteristics? What other factors are associated with vaccination intentions?

3
      SCHOOL PLANS AND POLICIES
      What are the attitudes of principals towards mobile vaccination clinics and enforcement of other,
      non-COVID-19 vaccination requirements? How have school vaccination policies changed to
      adapt to the COVID-19 environment?

                                                                                                          4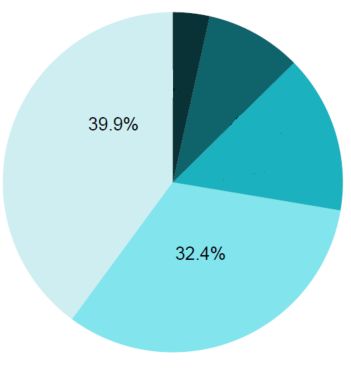
METHODOLOGY

    Data Sources
    The project includes data from multiple collection methods to identify key findings and provide additional context to these findings.
    Please refer to the appendix for additional details on data sources and weighting methods.

         Cross-sectional online surveys                               Virtual focus groups                                        Social media listening

  Web Panels [Weighted]                                        Parents of Students with Special Education Needs            Public Online Conversations
  Parents and teachers reported on a variety of topics         Parents shared their thoughts and experiences related       Public social media posts from Twitter, Facebook,
  related to COVID-19 and reopening schools safely.            to navigating school with their children with special       Instagram, YouTube, Reddit, forums, blogs, reviews,
  • n = 4,039 | N = 70,372,798 parents of K-12 students        education needs during the pandemic.                        Quora and WordPress were collected using COVID-19
     (3/2/21 – 3/10/21)                                        • n = 5 (3/27/21)                                           vaccination and K-12 schools keyword queries*.
  • n = 1,842 | N = 3,734,000 teachers of K-12 students                                                                    • n = 1.82 million publicly available posts (1/1/21 –
     (3/3/21 – 3/31/21)                                        Teachers from Rural Areas                                      4/25/21)
                                                               Teachers shared their thoughts and experiences
  Sector Surveys [Weighted]                                    related to teaching and schools during the pandemic,        Sentiment Analyses
  Principals reported on a variety of topics related to        with a focus on teaching in rural areas.                    Sentiment analyses were conducted using a Natural
  COVID-19 and reopening schools safely.                       • n = 7 (3/15/21)                                           Language Processing algorithm provided by the Sprinklr
  • n = 576 | N = 117,110 principals and vice-principals                                                                   social media listening platform. Sprinklr’s sentiment
     (4/8 – 4/15/21)                                           Superintendents                                             analysis algorithm categorizes posts as positive,
                                                               Superintendents shared their experiences reopening          negative, or neutral with approximately 80% accuracy.
  Crowdsourcing Surveys [Unweighted]                           and/or closing school districts during the pandemic.
  Teachers and school staff reported on their vaccination      • n = 5 (3/16/21)
  plans and beliefs.                                                                                                       *Queries were used to identify posts from a specific
  • n = 566 teachers (2/17/21 – 2/24/21)                       Students of Color                                           perspective (key phrases such as “I am a teacher” or “as
  • n = 600 teachers (3/19/21 – 3/27/21)                       Students shared their thoughts and experiences              a parent”) and from a specific demographic (keywords
  • n = 530 school staff (2/17/21 – 2/24/21)                   related to attending school during the pandemic.            such as Hispanic, urban, rural, etc).
  • n = 494 school staff (3/19/21 – 3/27/21)                   • n = 8 (4/5/21 - 4/6/21)

The results included in this report focus on data from the web panel and sector surveys; however, findings shown were also elaborated on with crowdsourced , where available. For
     the remainder of the report, “Survey Findings” refers to web panels or sector survey data. Crowdsourced, focus groups, or social media findings will be noted separately.

                                                                                                                                                                                      5
METHODOLOGY
Process for Identifying Key Findings
The process below was used to identify insights and triangulate across data collection methods.
NOTES AND LIMITATIONS
The research team acknowledges several important caveats
Using the weighted cross-sectional web panel survey data, a variety of to this data affecting interpretation, including:
CONDUCT statistical approaches, such as Chi-square and logistic regression
STATISTICAL analyses to estimate unadjusted odds ratio, were conducted to test for LIMITATIONS
ANALYSIS associations (significance level pMETHODOLOGY
Defining Vaccination Intentions
Respondents were asked to indicate their plans for COVID-19 vaccination, which were then grouped into three main categories for this report.
Which of the following best describes your plans for COVID-19 vaccination?
SURVEY
QUESTION
ORIGINAL I do not plan to get a I have not decided I plan to get a COVID-19 I have already received
RESPONSE COVID-19 vaccine yet vaccine when it is my a COVID-19 vaccine
OPTIONS
turn
COMBINATION OF
OPTIONS
REGROUPED “VACCINE
“UNDECIDED” “VACCINE ADOPTERS”
INTENT
CATEGORES
HESITANT”
7Summary of findings and public health implications
OVERVIEW

Summary of Findings by School Respondent Group*
At the time of the surveys (3/2/21 – 4/15/21), parents’ COVID-19 vaccination intentions varied more widely than those of teachers and principals,
and they reported more vaccine hesitancy (or were undecided).

                                                                                                                                                                                      SCHOOL
                     PA R E N T S                                                                    TEACHERS
                                                                                                                                                                                    LEADERSHIP
  • Although most reported being vaccinated,                                          •   Most teachers (82%) reported that they                                       •   Nearly all principals (89%) reported that
    20% of parents are vaccine hesitant and 19%                                           have already received a COVID-19 vaccine                                         they had already received a COVID-19
    are undecided about COVID-19 vaccination.                                             or planned to get it when it is their turn.                                      vaccine or planned to when it was their turn.
  • While most parents agreed that a COVID-19                                         •   Nearly half of teachers believed that                                        •   Over 50% of principals reported they would
    vaccine reduces the “risk of getting sick” and                                        COVID-19 vaccination does not prevent                                            be comfortable with children attending in-
    is important for “people at higher-risk”, some                                        them from potentially spreading the virus to                                     person school when many of the school
    questioned its effectiveness.                                                         others.1                                                                         district’s teachers and staff are vaccinated.
  • Almost 50% of parents reported that they                                          •   Almost 75% of teachers would feel                                            •   Some principals reported that they didn’t
    would be more comfortable with their child                                            comfortable returning to teach in-person                                         feel COVID-19 vaccination prevents them
    attending in-person school once teachers and                                          once vaccinated.                                                                 from potentially spreading the virus to
    staff are vaccinated.                                                                                                                                                  others.1
                                                                                      •   Female teachers and teachers living in the
  •   Among parents of school-age children, the                                           Southern region of the U.S. had 2-3 times                                    •   Nearly 75% of principals reported they would
      following characteristics were independently                                        greater odds of being vaccine hesitant than                                      likely permit mobile vaccination units on
      associated with being vaccine hesitant: non-                                        their peers.                                                                     school grounds, and 73% would permit the
      Hispanic Black or African American, under                                                                                                                            health departments or another community
      the age of 40, household income < $50k.                                                                                                                              organizations to regularly test staff and
                                                                                                                                                                           students.
  • Parents unwilling to have their child tested
    regularly for COVID-19 at school for in-person
    learning had 8 times greater odds of being
    vaccine hesitant than those in favor or
    testing.

 1Research  still underway at time of survey distribution to better understand how well COVID-19 vaccines keep people from spreading the virus
 *The findings on this summary slide reflect data from the cross-sectional web panels only. The following sections of this report presents triangulated findings across all data sources.
                                                                                                                                                                                                                           9
OVERVIEW
Crosscutting Themes and Opportunities Moving Forward
This report provides new insights that can be used to improve COVID-19 vaccination in K-12 settings and ultimately create safer in-person
learning environments that can protect the overall health and educational outcomes of students.
Vaccine Intentions
While most teachers and principals reported getting vaccinated (or plan to be), more work is There are opportunities to better tailor communication
needed to improve vaccine uptake for sub-populations (e.g., female teachers, teachers in the and education to parents as well as specific groups of
South). Data also indicated higher vaccination rates among teachers compared to other teachers and school staff, taking local context and
school staff. Moreover, 39% of parents were vaccine hesitant or undecided about COVID-19 socio-demographic factors into consideration.
vaccination, especially those in lower income groups and younger parents (under 40 years).
Comfort with In-Person Learning Continued efforts to get all teachers and staff
About 50% of parents and principals reported they would feel more comfortable with in-person vaccinated will be critically important heading into the
learning for students once K-12 teachers and staff are vaccinated and 75% of teachers would 2021-2022 school year.
feel comfortable returning to teach in-person once vaccinated.
Beliefs and Barriers
Teachers and schools can help promote evidence-
Across all groups, misinformation and uncertainty about the safety and effectiveness of based information and overcome perceived barriers to
COVID-19 vaccination persists, indicating a need for more education. Many still report barriers
getting vaccinated, including providing mobile
to vaccine access as well (e.g., transportation, childcare, etc.). Solutions such as mobile
vaccination units on school grounds.
vaccination units on school grounds, which was largely supported by surveyed principals, may
help overcome some of these challenges.
Changing Environment and Vaccine Rates Conduct modeling of prevention strategies among
student populations to address that some teachers
The COVID-19 policy landscape is dynamic, especially as it relates to vaccination guidance
and staff may not be vaccinated, and that some
and in turn vaccine uptake. As the state of COVID-19 vaccination transforms, prevention
students are not age-eligible for a COVID-19 vaccine
strategies should similarly evolve to reflect the changing environment.
or may not be vaccinated.
10OVERVIEW
Implications for Public Health Action
Based on vaccine related findings in this report, there are several ways that schools and their partners can act and improve vaccine
confidence and uptake.
• Schools and trusted people (e.g., vaccinated teachers) can provide evidence-based information and
messages tailored to their unique school population and local context (to help overcome misinformation and
barriers).
Communication • Provide clearer rationale and benefits of vaccination in school-based settings and for student outcomes
and Education overall, especially as guidance changes.
• Coordinate and reinforce messages coming from schools with other sources such as school districts,
Department of Education, CDC and other local, state and national organizations.
• Reemphasize that vaccines are offered at no cost (and that proof of insurance is not required) as this was a
major perceived barrier.
• Continue exploring schools and other community sites (e.g., churches, community centers) for pop-up
vaccination sites to reduce barriers around access and mistrust.
Vaccine Delivery • Promote existing resources already tailored to school settings, such as CDC vaccine toolkit.
and Resources • Continue to prioritize vaccinations for teachers and staff, and consider more tailored efforts to remove
perceived barriers for groups experiencing higher likelihood of vaccine hesitancy (female teachers, teachers
in the South)
• Conduct and promote additional research on populations experiencing higher rates of vaccine hesitancy (e.g.,
11
Further Research under 40, lower income) to understand specific motivators, myths, and misinformation influencing vaccinate
hesitancy.Parents of K-12 students Findings in this section reflect weighted web panel data and unweighted crowdsourcing and focus group data. Parent data were collected between March – April 2021 (except for social media data collected January – April 2021).
FINDINGS: PARENT COVID-19 VACCINATION INTENTIONS & BELIEFS

Many parents are still undecided about COVID-19 vaccination or
do not plan to receive a COVID-19 vaccine
 SURVEY FINDINGS

  While most parents were vaccine                                          COVID-19 Vaccination Intentions of K-12 Parents
                                                                            n = 4,039 | N = 70,372,798 (weighted)
  adopters, 39% reported that they were
  either undecided or hesitant to getting                                                       Vaccine Adopters                                Undecided           Vaccine Hesitant
  a vaccine themselves. Highly
  statistically significant (p
FINDINGS: PARENT COVID-19 VACCINATION INTENTIONS & BELIEFS
Many parents anticipated feeling more comfortable with their child
returning to school after all teachers and staff are vaccinated
SURVEY FINDINGS FOCUS GROUP INSIGHTS
Would you be more, less, or just as comfortable with your
child attending in-person school when the school’s "They had positive COVID cases in the classroom
teachers and staff are vaccinated? and then [my son] had to stay back home, and all
of us had to quarantine and go for testing, so that
n = 4,039 | N = 70,372,798 (weighted)
kind of put me off...I'm not too much for going
back to school because I'm afraid...Because of
staff and students who are infected. I would prefer
to be more virtual for another couple of months
until this COVID situation is completed.“
About the
same -Parent of student with special education needs on returning to
More
school before teachers and staff are vaccinated
38.5% comfortable
50.5%
10.9%
Less
comfortable
14FINDINGS: PARENT COVID-19 VACCINATION INTENTIONS & BELIEFS
While most parents agreed that a COVID-19 vaccine reduces the
risk of getting sick and is important for people at higher risk, some
questioned its effectiveness*
SURVEY FINDINGS
Proportion of K-12 Parents in Agreement with Various
Statements about COVID-19 Vaccination
n = 4,039 | N = 70,372,798 (weighted)
Nearly three quarters
of parents reported
uncertainty about
spreading the virus
after being
vaccinated.
About a third of parents
reported that they do not
think the vaccines have
been tested enough.
SOCIAL MEDIA LISTENING
1. #covid19 6. #vaccinated
Top Hashtags Used by Parents in Social Media Posts Related
to COVID-19 Vaccination 2. #vaccine 7. #getvaccinated
Analysis of the most frequently used hashtags in parents’ social 3. #covid 8. #vaccinessavelives
media posts related to COVID-19 vaccination shows a sense of 4. #covidvaccine 9. #thisisourshot
urgency toward, and support for, vaccination efforts.
5. #vaccineswork 10. #maskup
Note: Hashtags shown are from the vaccine query, filtered for posts containing parent-identifying keywords
*Research still underway at time of survey distribution to better understand how well COVID-19 vaccines keep people from spreading the virus
15FINDINGS: PARENT DISPARITIES & ASSOCIATIONS
Younger parents were more likely to report being vaccine hesitant
or undecided compared to older parents
SURVEY FINDINGS FOCUS GROUP INSIGHTS
COVID-19 Vaccination Intentions of K-12 Parents by Age “My mom is wanting me to [get a COVID-19
n = 4,039 | N = 70,372,798 (weighted) vaccine] because I was planning to go back to
school. My mom’s conscience is like, ‘you
have to take it’.”
Compared to vaccine
- Student on their parent’s sentiment towards COVID-19
adopters, younger K-12 vaccination and returning to in-person learning
parents were ~1.5 times
the odds of being hesitant
(OR= 1.49), or undecided SOCIAL MEDIA LISTENING
(OR=1.48) about being Age Breakdown* of Parents Expressing Resistance to
vaccinated compared to COVID-19 Vaccination on Twitter and Quora
older parents. n = 112
70% Among posts
59%
60% from parents
Vaccine Adopters Undecided Vaccine Hesitant expressing
50%
38% hesitancy to
40% COVID-19
Age (Indep.) COVID-19 Vaccination Intention (Dep.)* Odds Ratio (Conf. Interval)
30% vaccinations,
Under 40 years vs. 40 + years Vaccine Hesitant vs. Vaccine Adopters 1.49 [1.23, 1.79]**
20% the majority
Under 40 years vs. 40 + years Undecided vs. Vaccine Adopters 1.48 [1.22, 1.79]** came from
10%
3% younger
* reference group: “I have already received the COVID-19 vaccine” or “I plan to get a COVID-19 vaccine when it is my turn” 0% parents
** pFINDINGS: PARENT DISPARITIES & ASSOCIATIONS
Parents with lower household incomes were more likely to be
undecided or vaccine hesitant than those with higher incomes
SURVEY FINDINGS COVID-19 Vaccination Intentions of K-12 Parents by Income
n = 4,039 | N = 70,372,798 (weighted)
Compared to vaccine adopters, parents with lower household incomes
had over 3 times greater odds of reporting vaccine hesitancy, and
almost 4 times greater odds of feeling undecided. A higher proportion of
parents with $100K+ incomes were vaccine adopters, compared to other
income levels.
Similarly, compared to vaccine adopters, parents with household incomes
between $50-100K had about 2 times greater odds of being hesitant or
undecided about getting a COVID-19 vaccine compared to those making
$100K+.
Parent COVID-19 Vaccination Odds Ratio (Conf.
Household Income (Indep.)
Intentions (Dep.)* Interval)
Vaccine Hesitant vs. Vaccine
Under $49,999 vs. $100,000+ 3.41 [2.63, 4.41]**
Adopters
Undecided vs. Vaccine
Under $49,999 vs. $100,000+ 3.96 [3.05, 5.14]**
Adopters
Between $50,000 and $99,999 Vaccine Hesitant vs. Vaccine
2.33 [1.79, 3.03]**
vs. $100,000+ Adopters
Vaccine Adopters Undecided Vaccine Hesitant
Between $50,000 and $99,999 Undecided vs. Vaccine
1.91 [1.46, 2.50]** A positive association between income and likelihood of COVID-19
vs. $100,000+ Adopters
vaccine adoption was observed, whereby parents in the highest-
* reference group: “I have already received the COVID-19 vaccine” or “I plan to get a COVID-19 vaccine when income group were significantly more likely to be vaccine adopters
it is my turn”
** pFINDINGS: PARENT DISPARITIES & ASSOCIATIONS
Non-Hispanic Black or African American parents are more likely to be
vaccine hesitant or undecided than non-Hispanic White parents
SURVEY FINDINGS
Compared to vaccine adopters, non-Hispanic Black or African
American parents were also 80% more likely to be hesitant
Vaccination Intentions of K-12 Parents by Race Compared to vaccine (OR=1.81) to getting a COVID-19 vaccine compared to
n = 4,039 | N = 70,372,798 (weighted) adopters, non-Hispanic Hispanic or Latino persons.
Black or African American
parents had about 2 times COVID-19 Vaccination Odds Ratio (Conf.
Race (Indep.)
Intentions (Dep.)* Interval)
greater odds of being
undecided, and 80% NH Black vs. NH Vaccine Hesitant vs. Vaccine
1.82 [1.38, 2.41]**
increased odds of being White Adopters
hesitant to getting a NH Black vs. NH Undecided vs. Vaccine
COVID-19 vaccine 2.18 [1.64, 2.91]**
White Adopters
compared to White
NH Black vs. Vaccine Hesitant vs. Vaccine
respondents. 1.81 [1.31, 2.51]**
Hispanic Adopters
No significant differences NH Black vs. Undecided vs. Vaccine
1.45 [1.05, 1.99]**
between White Hispanic Adopters
respondents and other * reference group: * reference group: “I have already received the COVID-19 vaccine” or “I plan to get
racial ethnic groups were a COVID-19 vaccine when it is my turn”
Vaccine Adopters Undecided Vaccine Hesitant ** pFINDINGS: PARENT DISPARITIES & ASSOCIATIONS
Parents in rural areas reported less favorable vaccination intentions
than parents in suburban or urban areas
SURVEY FINDINGS
Vaccination Plans of K-12 Parents by Location
n = 4,039 | N = 70,372,798 (weighted)
Nearly a third of parents living in rural communities were
hesitant to receiving a COVID-19 vaccine, while lower
percentages of suburban and urban parents reported hesitancy
(18% and 17%, respectively).
No statistically significant differences between urban and
suburban communities were observed.
Compared to vaccine adopters, rural parents had about two
and a half times greater odds of being hesitant to getting
vaccinated for COVID-19, and about 80% increased odds of
being undecided compared to suburban parents.
Location (Indep.) Vaccination Intention Plan (Dep.)* Odds Ratio (Conf. Interval)
Rural vs. Suburban Vaccine Hesitant vs. Adopters 2.48 [1.94, 3.16]**
Rural vs. Suburban Undecided vs. Vaccine Adopters 1.82 [1.41, 2.35]**
Vaccine Adopters Undecided Vaccine Hesitant
* reference group: “I have already received the COVID-19 vaccine” or “I plan to get a COVID-19 vaccine when it is
my turn”
** pFINDINGS: PARENT DISPARITIES & ASSOCIATIONS
Observed racial disparities in COVID-19 vaccination intentions differ
across communities, which may have implications for targeted efforts
to reduce vaccine hesitancy
SURVEY FINDINGS SOCIAL MEDIA LISTENING
COVID-19 Vaccination Intentions of K-12 Parents by Race & Location
n = 4,039 | N = 70,372,798 (weighted)
Top Hashtags Used by Parents of Color in Social
Media Posts Related to COVID-19 Vaccination,
Based on Number of Mentions
Analysis of the most frequently used hashtags in
parents of color’s social media posts about COVID-19
vaccination indicates a split in attitudes toward the
vaccines.
1. #covid19 6. #onlywhenitssafe
2. #covid 7. #healthcare
3. #blacklivesmatter 8. #wearamask
Vaccine Adopters Undecided/ Vaccine Adopters Undecided/ Vaccine Adopters Undecided/ 4. #blackandvaccinated 9. #openonlywhensafe
Vaccine Hesitant Vaccine Hesitant Vaccine Hesitant
Within urban areas, a larger proportion of racial and ethnic minority 5. #vaccine 10.#smartdissent
groups (54% Black or African American, 37% Hispanic or Latino, 44%
Other) remain undecided or hesitant toward COVID-19 vaccination,
compared to just 24% of White parents. These racial disparities are both Hashtags shown are aggregated from the communities of color queries
(separate queries for African American, Latino, and Native American
statistically significant and larger in magnitude than those observed populations, containing unique identifying keywords for each group), filtered
among parents in rural or suburban communities. to include only posts containing vaccine and parent-identifying keywords.
20FINDINGS: PARENT DISPARITIES & ASSOCIATIONS
Parents with children attending school in-person were more hesitant
to or undecided about COVID-19 vaccination compared to parents of
children in schools utilizing 100% virtual or hybrid learning models
SURVEY FINDINGS
Compared to vaccine adopters, parents of students at schools COVID-19 Vaccination Intentions of K-12 Parents by Child Learning Model
utilizing a 100% in-person instruction model are had 78% n = 4,039 | N = 70,372,798 (weighted)
increased odds of being vaccine hesitant and 44% increased
odds of being undecided about getting vaccinated against
COVID-19 compared to parents whose children are at schools
utilizing a fully or partially virtual instruction model.
No differences between 100% remote/virtual and hybrid
instruction models were observed.
Learning Model Parent COVID-19 Vaccination Odds Ratio
(Independent) Intentions (Dependent)* (Confidence Interval)
In-person vs. Vaccine Hesitant vs. Vaccine
1.78 [1.40, 2.26]**
Remote/virtual Adopters
In-person vs. Undecided vs. Vaccine
1.44 [1.12, 1.84]**
Remote/virtual Adopters
* reference group: “I have already received the COVID-19 vaccine” or “I plan to get a COVID-19
vaccine when it is my turn”
** pFINDINGS: PARENT PROFILE ANALYSIS
There are key demographic differences in parents who reported
being vaccine hesitant or undecided about COVID-19 vaccination
SURVEY FINDINGS BUILDING TRUST
Key characteristics of parents in each vaccination intention category are listed below. Each Non-profit organization Trust for America’s
characteristic listed beneath the categories below was found to have a highly statistically significant Health released a policy brief in December of
(pFINDINGS: PARENT COVID-19 VACCINATION INTENTIONS & BELIEFS
Vaccine hesitant and undecided parents are more likely to express
doubts about their ability to get a COVID-19 vaccine
SURVEY FINDINGS
Proportion of K-12 Parents in Agreement with Various
Statements, by Vaccination Intention
n = 4,039 | N = 70,372,798 (weighted)
Vaccine Adopters Undecided
Perceived Ability to Find Vaccination Location and Transportation
Vaccine Hesitant
Among surveyed vaccine hesitant and undecided parents, over a quarter believed that
they would know where to go to get a COVID-19 vaccination (32%) and be able to find
transportation to get there (30%).
Perceived Availability and Affordability
The largest differences in perception of vaccine accessibility between parents with
different vaccination intentions is observed with respect to supply and affordability.
Compared to parents who were already vaccinated or intended to be, vaccine hesitant
and undecided parents were less likely to believe that they would be able to find
vaccine supply in their area or that they would be able to afford the shot.
Misperceptions about COVID-19 Vaccine Cost
Only 10% of vaccine hesitant parents and 13% of undecided parents believe that they
would be able to afford to get a COVID-19 vaccine. Among vaccine adopters, 76%
believed that they would be able to afford to get vaccinated. This finding demonstrates
significant gaps in information around the cost of a COVID-19 vaccine, which has been
made available at no cost to all individuals regardless of insurance coverage or
immigration status.
23FINDINGS: PARENT COVID-19 VACCINATION INTENTIONS & BELIEFS
Sources of information on vaccination include parents’ healthcare
provider, CDC and the state and county health departments
SURVEY FINDINGS SOCIAL MEDIA INSIGHTS
Sentiment Analysis of Parents’ Social Media Posts
The top vaccine sources that parents and teachers rely on the most for accurate indicates a relatively even proportion of Trust
information about COVID-19 vaccination are their healthcare providers, CDC and between CDC and Healthcare Providers around
state or county health departments. COVID-19 Vaccination Information
n = 3,649
Sources Relied Upon for Information on COVID-19
Percentage of Parents
Vaccination 100%
% OF MENTIONS
My healthcare provider 61% 90%
80%
Centers for Disease Control and Prevention (CDC) 60% 70%
60% 81% 80%
State or county health department 56% 50%
News sources (e.g., online or print newspapers, 40%
26%
radio, television, apps) 30%
Family and friends 25% 20%
13% 12%
10%
My employer 16% 7% 8%
0%
Social media (such as Facebook, Twitter, CDC Local Healthcare Providers
11%
Instagram, LinkedIn, or TikTok) Positive Negative Neutral
Religious leader(s) 7%
Sentiment data are from the vaccine trust query, filtered for posts that contain the parent-
identifying, trust, CDC and local community healthcare provider keywords
24FINDINGS: SCHOOL VACCINATION PLANS & POLICIES
A quarter of parents reported unwillingness to have their child tested
regularly at school for COVID-19 as a requirement for in-person
learning
SURVEY FINDINGS Willingness of K-12 Parents to have Child Tested for COVID-19 at School
n = 4,039 | N = 70,372,798 (weighted)
While most parents (59%)
reported that they would be
willing to have their child Yes Not Sure No
tested for COVID-19 at
school, nearly a quarter
expressed hesitancy to in-
school COVID-19 testing.
SOCIAL MEDIA INSIGHTS
1. #mnleg 6. #momlife
Top Hashtags Used in Parents’ Social Media Posts Related to COVID-
19 Testing, Based on Number of Mentions 2. #covid19 7. #covidtesting
Posts containing #mnleg shared opinions on COVID-19 testing 3. #covid 8. #school
in schools, intended for the Minnesota legislature. This followed 4. #covid_19 9. #blacklivesmatter
stories about parents deliberately avoiding testing their kids to
keep school sports going. 5. #backtoschool 10. #blm
Note: Hashtags shown are from the COVID testing query, filtered for posts containing parent-identifying keywords
25FINDINGS: SCHOOL VACCINATION PLANS & POLICIES Parents who are not open to in-school testing for COVID-19 tend to also be vaccine-hesitant SURVEY FINDINGS Compared to vaccine adopters, parents Willingness to have child tested at Parent COVID-19 Vaccination Intention Odds Ratio unwilling to have their child tested school (Indep.) (Dep.) [Conf. Interval] regularly at school for COVID-19 as part of a requirement for in-person learning No vs. Yes Vaccine hesitant vs. vaccine adopters 8.29 [6.58, 10.44]** were 8 times the odds of being vaccine hesitant (not planning to receive a No vs. Yes Undecided vs. vaccine adopters 3.25 [2.55, 4.13]** COVID-19 vaccine) compared to other * reference group: “I have already received the COVID-19 vaccine” or “I plan to get a COVID-19 vaccine when it is my turn” parents. ** p
Teachers of K-12 students
Findings in this section reflect weighted web panel data and
unweighted crowdsourcing and focus group data.

Teacher data were collected between February – April 2021 (except
for social media data collected January – April 2021).
FINDINGS: TEACHER COVID-19 VACCINATION INTENTIONS & BELIEFS

Most teachers reported they already received a COVID-19 vaccine or
were planning to get it as of March 2021
  SURVEY FINDINGS                                                                                                             C R O W D S O U R C E D D ATA

   Vaccination Intentions of K-12 Teachers, March 2021                                                                         Teachers
    n = 1,842 | N = 3,734,000 (weighted)                                                                   Vaccine             n=566 (February) | n=600 (March)
                                                                                                           Hesitant            School staff
                                                                                                                               n=530 (February) | n=494 (March)
                                         Vaccine Adopters                                       Undecided
                                                                                                                              Between February and March, there was a 10 percentage-
                                                                                                                              point increase in teachers who reported they have been
                                                                                                                              vaccinated, scheduled an appointment, or tried to book an
                                                                                                                              appointment (82% in March vs. 72% in February). There
                                                                                                                              was no change in school staff vaccinations (65% in March
                                                                                                                              vs. 69% in February).

  SOCIAL MEDIA LISTENING                                                                 Teacher COVID-19 Vaccination Spikes Driven by Public Figure Posts                                  Teacher
                                                                    10,000
                                                                                                                                                                                            vaccination
  Trends in teachers’ social media posts about                       9,000
                                                                                Teacher vaccination conversation                                                                            conversation
                                                                     8,000                                                                                                                  peaked the
  COVID-19 vaccination in early 2021 reveal                                     spiked the week of 3/7 after President
  that online discussions spiked immediately                         7,000
                                                                                Biden announced teachers would be                                                                           week of 4/5
                                                                     6,000                                                                                                                  following
  following key turning points such as                                          eligible for vaccination
                                                                     5,000                                                                                                                  revised CDC
  President Biden’s announcement about
                                                                     4,000                                                                                                                  guidance on
  eligibility for teachers, indicating strong                        3,000                                                                                                                  teacher
  interest and attention around the topic.                           2,000                                                                                                                  vaccinations*
  *An additional driver appears to have been a coordinated effort    1,000
  to push a story of a person posing as a substitute teacher to         -
  receive a vaccine on social media, notably Twitter.                        3-Jan 10-Jan 17-Jan 24-Jan 31-Jan 7-Feb 14-Feb 21-Feb 28-Feb 7-Mar 14-Mar 21-Mar 28-Mar 4-Apr 11-Apr 18-Apr 25-Apr

                                                                                                                                                                                                            28
FINDINGS: TEACHER COVID-19 VACCINATION INTENTIONS & BELIEFS
For most teachers, receipt of a COVID-19 vaccine will allow (or has
already allowed) for a comfortable return to in-person instruction
SURVEY FINDINGS SOCIAL MEDIA LISTENING
Analysis of the most frequently used hashtags in teachers’ social
Not at all
How comfortable are you comfortable media posts about COVID-19 vaccination show a sense of urgency
(or would you be) Somewhat toward vaccination in order to return to school safely.
teaching in-person after 4% uncomfortable
Top Hashtags Used by Teachers on Social Media Posts Related to
receiving a COVID-19 9% COVID-19 vaccination, Based on Number of Mentions
vaccine? 1. #vaccinateteachers 6. #vaccinateeducatorsnow
n = 1,842
N = 3,734,000 (weighted) 2. #covidvaccine 7. #stopthespread
40% 3. #vaccinateschoolstaff 8. #teachersfirst
Very comfortable 15% 4. #teachers 9. #teachersvoicesmatter
Neutral
5. #vaccinatealltheteachers 10. #openonlywhensafe
Note: Hashtags shown are from the vaccine query, filtered for posts containing teacher-identifying keywords
C R O W D S O U R C E D D ATA
32%
72% of teachers reported Somewhat
In March 2021, 76% of teachers participating
Teachers Surveyed
that they are (or would be) comfortable in crowdsourced surveys reported that they
n=566 (February)
either somewhat or very would feel more comfortable teaching or n=600 (March)
comfortable teaching in- working with students in school after receiving
person after getting a a COVID-19 vaccine, compared to only 62% School Staff Surveyed
COVID-19 vaccine. of school staff. This gap in attitudes between n=530 (February)
teachers and staff had increased compared n=494 (March)
to data collected the month prior.
29FINDINGS: TEACHER COVID-19 VACCINATION INTENTIONS & BELIEFS
Teachers’ responses to a series of questions about COVID-19
vaccinations indicated close attention to CDC information and
guidelines
SURVEY FINDINGS
Proportion of K-12 Teachers in Agreement with
Various Statements about the COVID-19 Vaccines Teachers expressed lower
n = 1,842 | N = 3,734,000 (weighted) levels of agreement around
COVID-19 vaccines’ ability to
prevent vaccinated
individuals from spreading
the virus. At the time of
survey distribution (March
2021), CDC’s official post-
vaccination guidance stated
that the agency was “still
learning how well COVID-19
vaccines keep people from
spreading the disease.”1
FOCUS “I have to say that our district [and] my school superintendent…have all been there and done the best that they can
GROUP for us. I think one of the greatest things that our superintendent arranged... probably through the local health
INSIGHTS department…was [for us] to get our COVID shots and I think they've gone out of their way to really help us.”
-Teacher in rural area on process for returning to school in-person
1 National Center for Immunization and Respiratory Diseases (NCIRD), “When You’ve Been Fully Vaccinated,” Updated April 2. 2021. https://www.cdc.gov/coronavirus/2019-ncov/vaccines/fully-vaccinated.html
30FINDINGS: TEACHER DISPARITIES & ASSOCIATIONS
Female teachers reported vaccine-hesitancy more often than
their male peers
SURVEY FINDINGS
COVID-19 Vaccination Intentions of K-12 Teachers by Gender
n = 1,842 | N = 3,734,000 (weighted)
Compared to vaccine adopters, female teachers have 2.75 greater odds
of being hesitant to getting a COVID-19 vaccine than their male peers.
Odds Ratio (Conf.
Gender (Indep.) Vaccination Intention Plan (Dep.)*
Interval)
Vaccine Hesitant vs. Vaccine
Female vs. Male 2.75 [1.53, 4.94]**
Adopters
Female vs. Male Undecided vs. Vaccine Adopters 1.64 [0.94, 2.87]**
* reference group: “I have already received the COVID-19 vaccine” or “I plan to get a COVID-19 vaccine
when it is my turn”
** pFINDINGS: TEACHER DISPARITIES & ASSOCIATIONS
Teachers living in the Southern region of the United States are
more vaccine hesitant than their peers in other regions
SURVEY FINDINGS
Vaccination Intentions of K-12 Teachers by Region
n = 1,842 | N = 3,734,000 (weighted)
Midwest
Northeast
Compared to vaccine adopters, teachers living in the Southern region of the U.S.
South had 2-3 times greater odds of being vaccine hesitant than teachers in other
West regions. No significant differences between other regions were observed.
Region (Indep.) Vaccination Intention Plan (Dep.)* Odds Ratio (Conf. Interval)
Vaccine Hesitant vs. Vaccine
South vs. West 3.01 [1.69, 5.38]**
Adopters
Vaccine Hesitant vs. Vaccine
South vs. Midwest 2.01 [1.26, 3.22]**
Adopters
Vaccine Hesitant vs. Vaccine
South vs. Northeast 2.48 [1.49, 4.13]**
Adopters
* reference group: “I have already received the COVID-19 vaccine” or “I plan to get a COVID-19 vaccine
when it is my turn”
** pK-12 School Leadership Findings in this section reflect weighted web panel data and unweighted crowdsourcing and focus group data. Principal data were collected between March – May 2021.
FINDINGS: LEADERSHIP COVID-19 VACCINATION INTENTIONS & BELIEFS

Most K-12 principals surveyed reported that they had either already
received a COVID-19 vaccine or intended to “when it was their turn”

 SURVEY FINDINGS
                                          COVID-19 Vaccination Intentions of K-12 Principals, April 2021
                                                                                                                 Vaccine
                                           n = 576 | N = 117,110 (weighted)
  89% of principals                                                                                              Hesitant
  reported themselves as                                                      Vaccine Adopters             Undecided
  vaccine adopters, while
  just 7% are vaccine
  hesitant and 4% remain
  undecided.

  FOCUS GROUP INSIGHTS

  "The teachers are in the process of getting their vaccinations. We've really worked very, very hand-in-glove with our
  health department to make sure that we had closed clinics for our staff to be able to get their vaccinations."
  -Superintendent on vaccinating their schools' staff

                                                                                                                            34
FINDINGS: LEADERSHIP COVID-19 VACCINATION INTENTIONS & BELIEFS
Most principals reported that they would be comfortable with children
attending school in-person after teachers and staff are fully
vaccinated
SURVEY FINDINGS FOCUS GROUP INSIGHTS
How comfortable will you Not at all
comfortable
be with children attending "I had to consider the vaccination access and
3%
in-person school when Somewhat
then of course the access to COVID testing, so
many of the school uncomfortable all of that came into play as we made the
district’s teachers and decision in August to go virtual, as we made
staff are vaccinated? the decision in December and January to
n = 576 | N = 117,110 (weighted) 11% remain virtual, and then, as we made the
decision in March to begin reopening...those
16% are the factors that we have considered when
47% Neutral
Very comfortable
making our decision, each time."
70% of principals reported
they would be somewhat or -Superintendent on how vaccinations played a role in
very comfortable with 23% the decision-making process for reopening schools
children attending in- Somewhat
comfortable
person school when many
of the school district’s
teachers are staff are
vaccinated.
35FINDINGS: LEADERSHIP COVID-19 VACCINATION INTENTIONS & BELIEFS
Like parents and teachers, principals also expressed concern
about the vaccines’ ability to prevent spreading the virus
SURVEY FINDINGS
Proportion of K-12 Principals in Agreement with Various Statements about
COVID-19 Vaccination
n = 576 | N = 117,110 (weighted)
Statement
My employer thinks it’s important
for me to be vaccinated Principals expressed lower levels of
agreement around the COVID-19
My family thinks it’s important for
me to be vaccinated vaccines’ ability to prevent
It is important to be vaccinated for vaccinated individuals from
people at higher risk spreading the virus. At the time of
It might cause a severe reaction
survey distribution (March 2021),
CDC’s official post-vaccination
vaccinated, I won’t spread the guidance stated that the agency
virus to others if exposed
was “still learning how well COVID-
It has been tested enough 19 vaccines keep people from
spreading the disease.”1
It is safe
It lowers my risk of getting sick
with the COVID-19 virus
1 National Center for Immunization and Respiratory Diseases (NCIRD), “When You’ve Been Fully Vaccinated,” Updated April 2. 2021. https://www.cdc.gov/coronavirus/2019-ncov/vaccines/fully-vaccinated.html
36FINDINGS: SCHOOL VACCINATION PLANS & POLICIES
Most principals reported that they were supportive of regular
COVID-19 testing at school and would be likely to support mobile
vaccination units on school grounds in the future
SURVEY FINDINGS FOCUS GROUP INSIGHTS
Principals’ Likelihood of Permitting Mobile COVID-19 Vaccination Units
73% of principals “I'm looking forward to the
reported that they would
on School Grounds
n = 576 | N = 117,110 (weighted) summer, more than I am the
be likely to permit
mobile COVID-19 school year because I'm
vaccination units on hopeful that we're going to
school grounds. see kids engaged. We're
currently getting the vaccine
among the staff, so I don't
think that that will be an
issue.”
85% of principals Principal Support for Regular COVID-19 Testing for Students and Staff
reported they would be n = 576 | N = 117,110 (weighted) -Superintendent on COVID-19
supportive of the health vaccination and how it relates to
department or another his schools' summer plans
community organization
conducting COVID-19
testing for all students
and staff on a regular
basis.
37FINDINGS: SCHOOL VACCINATION PLANS & POLICIES
According to principals, some non-COVID-19 vaccination
requirements have been relaxed or dropped completely during the
2020-2021 school year
SURVEY FINDINGS Changes to General Student Vaccination Requirements for the 2020-2021 School
Year, as Reported by K-12 Principals n = 576 | N = 117,110 (weighted)
Policy Count Percentage of Principals*
Nearly half of principals No changes compared to the previous school year 199 49.9%
reported no changes to A provisional enrollment or grace period was established, but
197 23.3%
the normal vaccination only for students attending virtually
requirements for the The existing provisional enrollment or grace period was
149 23.0%
2020-2021 school year. extended, regardless of virtual or in-person attendance
A provisional enrollment or grace period was established,
141 19.2%
regardless of virtual or in-person attendance
The existing provisional enrollment or grace period was
163 19.2%
When asked about their extended, but only for students attending virtually
school’s vaccination policy for
the 2020-2021 school year, Students were allowed to attend school either in person or
110 16.9%
virtually if vaccination requirements were not met
17% of principals reported
that some or all regular Some or all vaccination requirements were dropped for all
vaccination requirements 128 16.6%
students, regardless of virtual or in-person attendance
were dropped for all
Some or all vaccination requirements were dropped, but only for
students, regardless of 92 12.4%
students attending school virtually
learning model.
Students were allowed to attend school if vaccination
requirements were not met, but only if they attended school 57 8.3%
virtually
*Note: Point estimates do not sum to 100% due to respondents’ ability to select multiple options.
38FINDINGS: SCHOOL VACCINATION PLANS & POLICIES
As reported by principals, general vaccination requirements were
largely upheld compared to previous years
SURVEY FINDINGS
55% of principals 2020-2021 Enforcement of Vaccination Requirements, as Compared to Previous Years
reported that general n = 576 | N = 117,110 (weighted)
vaccination
requirements at their
schools remained the
same as in previous
years.
62% of principals 2020-2021 General School Vaccine Coverage, as Compared to Previous Years
reported their general n = 576 | N = 117,110 (weighted)
vaccination coverage
for students during the
2020-2021 school year
has remained the
same as it has been in
previous years.
39Conclusion
CONCLUSION

Opportunities Moving Forward
Based on the findings in this report around vaccination intentions, comfort with in-person learning, and vaccine related barriers
and beliefs, there are several opportunities that can be used to improve COVID-19 vaccinations in K-12 settings and ultimately
create safer in-person learning environments that can protect the overall health and educational outcomes of students.

        Better tailored communication and education to                               Schools and teachers can help promote evidence-
        parents as well as specific groups of teachers and                           based information and overcome perceived
        school staff, taking local context and socio-                                barriers to getting vaccinated, including providing
        demographic factors into consideration.                                      mobile vaccination units on school grounds.

                                                                                     Conduct modeling of prevention strategies among
        Continued efforts to get all teachers and staff                              student populations to address that some teachers,
        vaccinated will be critically important heading into                         staff, and students may not be vaccinated, and that
        the 2021-2022 school year.                                                   some students are not age-eligible for a COVID-19
                                                                                     vaccine.

 The COVID-19 landscape is dynamic and rapidly evolving, especially as it relates to polices and practices related to vaccines and K-12 school settings.
      Since the data presented in this report were collected, there have been additional guidance and policy changes related to COVID-19 vaccines,
 including the emergency use authorization (EUA) for the Pfizer-BioNTech COVID-19 Vaccine that expanded access to adolescents aged 12 through 15
                                                                           years.

   The CDC Foundation’s Monitoring School COVID-19 Prevention Strategies project currently has several other data collection efforts underway to
  continue to examine vaccine intentions, beliefs, and barriers as school communities plan for the summer and fall. Additional data and findings will be
                                                                  released as available.
Appendix
APPENDIX

Weighting Methodology

The sample data was weighted, meaning assigned a heavier or lighter importance, using demographic
variables, such as age, gender, region, location, race and income, in order to be representative of the
national US population.

A multipurpose Iterative Proportional Fitting (IPF) procedure was used to calibrate individual-level weights.
This procedure simultaneously adjusted for:
1. Population estimates from the 2019 National Health Interview Survey (student and parent data) and the
    2017-2018 National Teachers and Principals Survey (principal and teacher survey data).
2. Bloc-level non-response adjustment based on calibration in the quintiles of estimated propensity to
    respond to surveys.
3. Weight trimming procedures (removed 5% of extreme high/low estimates) to create generalizable
    nationally-representative population estimates.

                                                                                                                43
APPENDIX
Demographic Characteristics:
Parent Cross-sectional Data (3/2/21 – 3/10/21)
Parent data was collected via a Qualtrics web panel. Parents sample data has been weighted using these
demographic characteristics for the purpose of analysis.
Geography Location Race School Type Grade level
Midwest 858 (21%) Urban 1,278 (32%) NH White 2,496 (62%) Private school 408 (10%) Kindergarten 416 (10%)
Northeast 694 (17%) Suburban 1,955 (48%) NH Black 500 (12%) Public school 3,364 (83%) Elementary school 1,465 (36%)
South 1,551 (38%) Rural 806 (20%) Hispanic 808 (20%) Charter/magnet 229 (6%) Middle school 904 (22%)
West 936 (23%) NH Other 235 (6%) Boarding school 11 (0.3%) High school 1254 (31%)
Other 27 (0.7%)
Age Income Gender Learning Model
Under 40 yrs 2,048 (51%) Under $49,999 1,696 (42%) Male 1,974 (49%) In-person 866 (21%)
40+ years 1,991 (49%) Between $50,000 and $99,999 1,395 (35%) Female 2,038 (50%) Hybrid 1,342 (33%)
$100,000 or more 948 (23%) Transgender/ non-binary/ gender Remote/virtual 1,831 (45%)
non-conforming 27 (1%)
44APPENDIX
Demographic Characteristics:
Teacher Cross-Sectional Data (3/3/21 – 3/31/21)
Teacher data was collected via a Qualtrics web panel. Teacher sample data has been weighted using these
demographic characteristics for the purpose of analysis.
Geography Location Race School Type Grade level
Midwest 389 (21%) Urban 593 (32%) NH White 1,431 (78%) Private school 138 (7%) Kindergarten and elementary
school 888 (48%)
Northeast 314 (17%) Suburban 831 (45%) NH Black 124 (7%) Public school 1,598 (87%) Middle school 456 (25%)
South 703 (38%) Rural 418 (23%) Hispanic 209 (11%) Charter/magnet 93 (5%) High school 498 (27%)
West 436 (23%) NH Other 78 (4%) Boarding school 4 (0.2%)
Other 9 (0.5%)
Age Income Gender Learning Model
Under 40 yrs 510 (28%) Under $49,999 236 (13%) Male 422 (23%) In-person 422 (23%)
40+ years 1,332 (72%) Between $50,000 and $99,999 962 (52%) Female 1,414 (77%) Hybrid 884 (48%)
$100,000 or more 644 (35%) Transgender/ non-binary/gender Remote/virtual 536 (29%)
non-conforming 6 (0.3%)
45APPENDIX
Demographic Characteristics:
Principal Cross Sectional Data (4/8/21 – 4/15/21)
Principal data was collected through partner dissemination channels. Sample data has been weighted using
these demographic characteristics for the purpose of analysis.
Geography Location Race School Type
Midwest 81 (14%) Urban 344 (60%) NH White 408 (71%) Private school 122 (21%)
Northeast 107 (19%) Suburban 144 (25%) NH Black 66 (11%) Public school 433 (75%)
South 119 (21%) Rural 88 (15%) Hispanic 28 (5%) Charter/magnet 6 (1%)
West 269 (47%) NH Other 74 (13%) Boarding school 12 (2%)
Other 3 (0.1%)
Age Gender Learning Model
Under 40 yrs 119 (21%) Male 387 (67%) In-person 136 (24%)
40+ years 457 (79%) Female 189 (33%) Hybrid 304 (53%)
Remote/virtual 136 (24%)
46APPENDIX
Demographic Characteristics:
Teacher Crowdsourced Data (2/17/21 – 2/24/21)
Teacher data was collected through Pollfish (n = 566). These data were not weighted in the analysis.
Geography Race School Type Grade Level
Midwest 133 (23%) American Indian or Alaska native 22 (3.9%) Public School 435 (77%) Elementary school 231 (41%)
Northeast 122 (22%) Asian or Asian American 35 (6.2%) Private School 63 (11%) Middle school 138 (24%)
South 184 (33%) Black or African American 43 (7.6%) Charter/Magnet 46 (8.1%) High school 197 (35%)
West 85 (15%) Latino/a, Hispanic, or Latinx 58 (10%) Boarding School 11 (1.9%)
Unknown 42 (7.4%) Native Hawaiian or other Pacific Islander 17 (3.0%) Other 11 (1.9%)
White 455 (80%)
Some other race or origin 24 (4.2%)
Learning Model Gender Age
Hybrid 133 (23%) Male 193 (34%) 20 – 29 87 (15%)
In-person 122 (22%) Female 373 (66%) 30 – 39 201 (36%)
Remote/virtual 184 (33%) 40 – 49 119 (21%)
50 – 54 42 (7.4%)
55 – 64 77 (14%)
65 – 74 32 (5.7%)
75 – 99 8 (1.4%)
47APPENDIX
Demographic Characteristics:
Teacher Crowdsourced Data (3/19/21 – 3/27/21)
Teacher data was collected through Pollfish (n = 600). These data were not weighted in the analysis.
Geography Race School Type Grade Level
Midwest 149 (25%) Non-Hispanic White 449 (75%) Public School 466 (78%) Elementary school 243 (40%)
Northeast 136 (23%) Non-Hispanic Black 17 (2.8%) Private School 73 (12%) Middle school 176 (29%)
South 200 (33%) Hispanic 61 (10%) Charter/Magnet 36 (6.0%) High school 181 (30%)
West 85 (14%) Other* 61 (10%) Boarding School 10 (1.7%)
Unknown 30 (5.0%) Prefer not to respond 12 (2.0%) Other 15 (2.5%)
Learning Model Gender Age
Hybrid 281 (47%) Male 246 (41%) 20 – 29 91 (15%)
In-person 197 (33%) Female 354 (59%) 30 – 39 201 (34%)
Remote/virtual 122 (20%) 40 – 49 142 (24%)
50 – 54 54 (9.0%)
55 – 64 65 (11%)
65 – 74 40 (6.7%)
75 – 99 7 (1.2%)
48APPENDIX
Demographic Characteristics:
Staff Crowdsourced Data (2/17/21 – 2/24/21)
School Staff data was collected through Pollfish (n = 530). School staff are paraprofessionals, classroom aides or
assistants, custodial staff, secretarial staff, food services staff, and bus drivers. These data were not weighted in
the analysis.
Geography Race School Type Grade Level
Midwest 101 (19%) American Indian or Alaska native 44 (8.3%) Public School 360 (68%) Elementary school 202 (38%)
Northeast 100 (19%) Asian or Asian American 75 (14%) Private School 55 (10%) Middle school 126 (24%)
South 144 (27%) Black or African American 87 (16%) Charter/Magnet 45 (8.5%) High school 202 (38%)
West 106 (20%) Latino/a, Hispanic, or Latinx 92 (17%) Boarding School 33 (6.2%)
Unknown 79 (15%) Native Hawaiian or other Pacific Islander 36 (6.8%) Other 37 (7.0%)
White 295 (56%)
Some other race or origin 47 (8.9%)
Learning Model Gender Age
Hybrid 186 (35%) Male 163 (31%) 20 – 29 183 (35%)
In-person 177 (33%) Female 367 (69%) 30 – 39 135 (25%)
Remote/virtual 167 (32%) 40 – 49 90 (17%)
50 – 54 27 (5.1%)
55 – 64 56 (11%)
65 – 74 35 (6.6%)
75 – 99 4 (0.8%)
49APPENDIX
Demographic Characteristics:
Staff Crowdsourced Data (3/19/21 – 3/27/21)
School staff data was collected through Pollfish (n = 494). School staff are paraprofessionals, classroom aides or
assistants, custodial staff, secretarial staff, food services staff, and bus drivers These data were not weighted in
the analysis.
Geography Race School Type Grade Level
Midwest 88 (18%) Non-Hispanic White 215 (44%) Public School 329 (67%) Elementary school 157 (32%)
Northeast 75 (15%) Non-Hispanic Black 52 (11%) Private School 59 (12%) Middle school 132 (27%)
South 139 (28%) Hispanic 97 (20%) Charter/Magnet 48 (9.7%) High school 205 (41%)
West 110 (22%) Other* 107 (22%) Boarding School 26 (5.3%)
Unknown 82 (17%) Prefer not to respond 23 (4.7%) Other 32 (6.5%)
Learning Model Gender Age
Hybrid 171 (35%) Male 280 (57%) 20 – 29 186 (38%)
In-person 182 (37%) Female 214 (43%) 30 – 39 121 (24%)
Remote/virtual 141 (29%) 40 – 49 75 (15%)
50 – 54 27 (5.5%)
55 – 64 58 (12%)
65 – 74 21 (4.3%)
75 – 99 6 (1.2%)
50You can also read