Institutional Presentation - IIQ FY 2019 - IRSA
←
→
Page content transcription
If your browser does not render page correctly, please read the page content below
Institutional
Presentation

     IIQ FY 2019

      www.irsa.com.ar
IRSA: Leading Real Estate Company in Argentina
Leading real estate company in Argentina with opportunistic assets abroad.
Majority shareholder of IRSA Propiedades Comerciales, leading commercial real estate company in Argentina with
~415,000 sqm of GLA located in premium locations.
63.3%
81.3% SANTA MARÍA 29.91%
HOTELS & OTHER INTERNATIONAL
LANDBANK
SHOPPINGS OFFICE
VP 18.9% Indirectly 49.0%
MALLS BUILDINGS 100% 77.9%
COMMERCIAL
LANDBANK
© 2017 CRESUD. All rights reserved. Page 2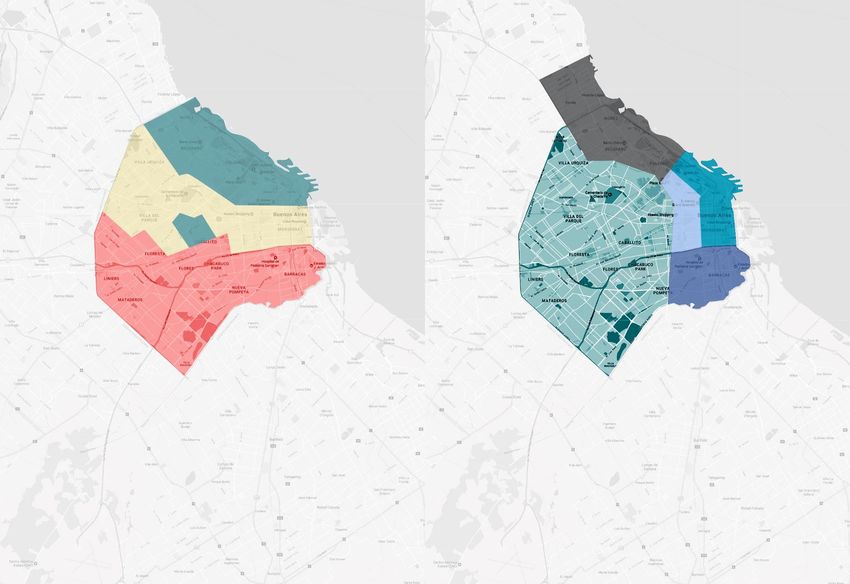
IRCP at a glance
Business description
Largest owner and operator of premium shopping malls and one of
the largest owners of office buildings in Argentina
~415,000 gross leasable area (“GLA”) in prime locations
Land reserve to develop ~372,0001 sqm of commercial property
Over 95% occupancy rates in shopping malls in last 10 years
Average lease rates of US$25.7 / sqm and 90% office occupancy
GLA breakdown (as of September 30, 2018) Simplified ownership structure
18 year
7 office buildings track record
~83,000 sqm
BYMA 22 year
20% track record
81.3% 18.8%
16 shopping malls
Total: ~332,000 sqm
~415,0001 80%
sqm
IRSA is a leading, diversified, publicly listed company with
presence in real estate and other sectors
© 2017 CRESUD. All rights reserved. Page 3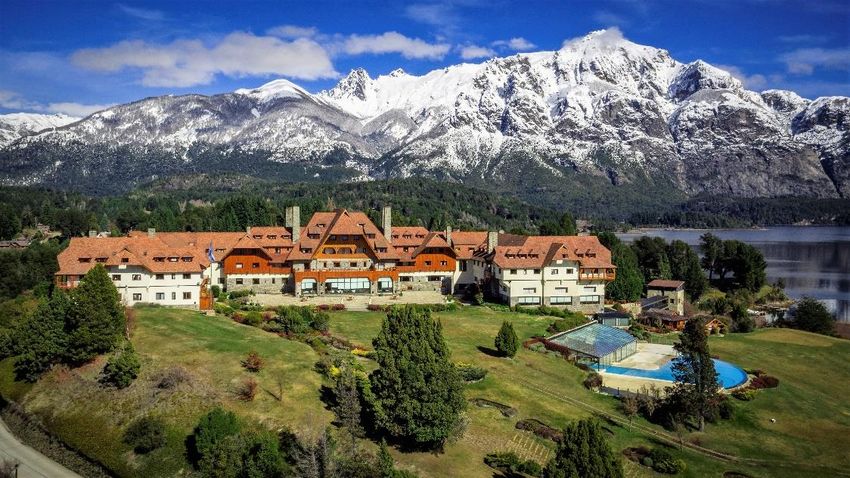
Our prime portfolio of assets is located in Argentina’s wealthiest
  neighborhoods and principal business districts

          Buenos Aires shopping malls                             Buenos Aires office buildings

                                           67% market share in
                                               terms of sales

                     City of                                                 City of
                  Buenos Aires                                            Buenos Aires

                                               Argentina shopping
                                                      malls

        Low income Area                                                                  Expanding Corporate North Area
        Mid Income Area                                                                  Business Center
        High income Area                                                                 AAA Location
        Land reserve                                                                     Back Office Center
                                                                                         Land reserve

                      Ourreserved.
© 2017 CRESUD. All rights  premium   locations act as an entry barrier for new competitors                     Page       4
Resilient revenue model
That has withstood historical inflation and currency depreciation
Shopping malls Office buildings
Revenue from leases Revenues from leases
In advance Our tenants pay a peso denominated base
rent plus an additional percentage
% Sales
linked to sales
% Sales
Brokerage fee
~5x monthly base rent
% Sales
US$ US$ US$
Base Rent
“Key money”
admission rights
~8x monthly base rent
Year 1 Year 2 Year 3 Year 1 Year 2 Year 3
Other revenues Shopping mall rent revenue breakdown1
3-year average term for office
Other lease contracts
Non Traditional Advertising
13,4%
Admission US Dollar based
rights
9,1%
Parking Stands
Rental rates for renewed
terms are negotiated at
Base rent market
Percentage 56,4%
rent
21,1%
1 As of September 30, 2018
© 2017 CRESUD. All rights reserved. Page 5
Shopping Malls & Offices’ Operating figures

  Shopping Malls – Tenants’ Sales                                                                               Offices – Leases USD/sqm/month & Occupancy
  (% Var i.a.)

                                 Nominal terms              Real terms
                                                                                                                      100%
                                                                                                                                                                            * Mainly explained
                                                            27,6%    28,6%                                                                      94%                       by new vacant floors
   21,3%                                 22,5%   22,7%                           24,1%      23,8%
              18,5%    19,6%   18,5%                                                                                                                                  90%* at Dot building.
                                                                                                                                                                            Considering Zetta
                                          2,9%                1,8%       1,2%                                                                                              building fully leased
                                                                                                                                            26,5                  27,0    to open next quarter,
                                                                                                                  25,6
                                                                                                                                                                           the avge occupancy
                       -2,8%   -2,0%             -0,1%
                                                                                                                                                                             would have been
                                                                                  -8,4%
   -14,4% -14,0%                                                                           -16,1%                                                                                 ~93%.

    IQ 17     IIQ 17   IIIQ 17 IVQ 17    IQ 18   IIQ 18     IIIQ 18 IVQ 18        IQ 19     IIQ 19
                                                                                                                  IIQ17                     IIQ18                 IIQ19

   Shopping Centers – Sqm GLA (Th.) & Occupancy (%)                                                             Offices – Stock (sqm GLA)

                98%                     99%                                     Mainly due to 12,600 sqm
                                                                                                                                                    +74.5%
                                                                                 vacancy generated by
                                                              95%                Walmart in DOT Baires                                                                            145,213
                                                                                        Shopping
                                                                                                                                                                                                   200
                                                                                                                                                                    115,213        30,000         Della
                                                                                                                                                                                                 Paolera
                                                                                                                          + 9.2%           - 1.4%
                                                                                                                                                               Zetta 32,000
       337,401                 340,111                                                                                                                        Building
                                                       332,119
                                                                                                                                                                                   115,213
                                                                                                                 77,252            84,361           83,213           83,213
                                                                                Excluding this effect, IIQ 19
                                            end of
                                                                                occupancy would have been
                                          concession
                                                                                           98.7%
            IIQ17               IIQ18                     IIQ19                                                   IIQ17            IIQ18              IIQ19          FY19E          FY20E

© 2017 CRESUD. All rights reserved.                                                                                                                                             Page         6
Our land reserve will allow us to significantly expand our
  commercial real estate portfolio

 We have a robust pipeline for shopping malls…                              …as well as for premium office properties

                1.7x
                                                               580
                                                                                        2.7x
                                               1181             118
                                                                                                                                  221

                                    ~19,000 sqm currently
                          128                     130 or
                                    under construction          128
                                        to start soon

                                                                                                    1382                          138

          332                                                   332
                                                                                                      ~67,000 sqm currently
                                                                                                       under construction
                                                                                83                                                 83

        Current        Brownfield           Greenfield      Current GLA &     Current          New developments               Current GLA &
                                                               pipeline                                                          pipeline

                   In existing land reserve                                             In existing land reserve
© 2017 CRESUD. All rights reserved.                                                                                             Page      7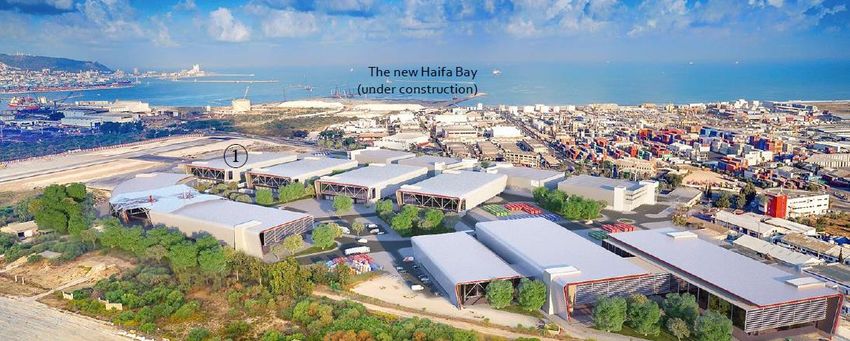
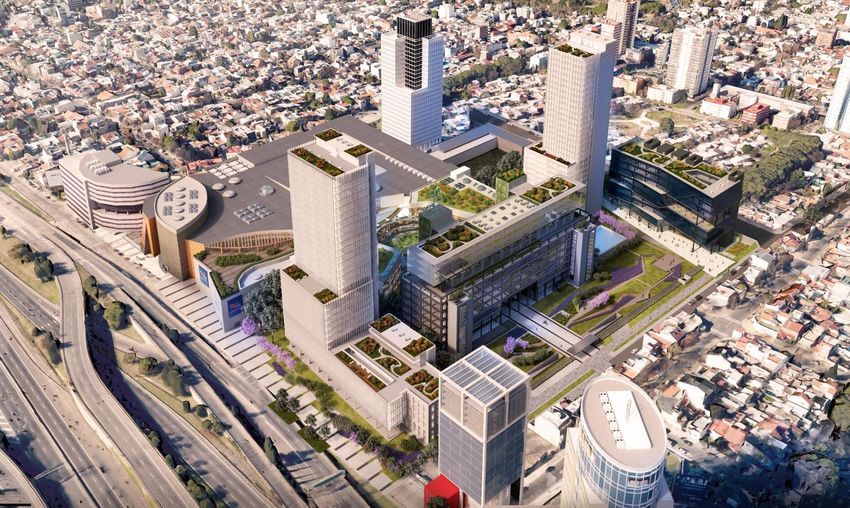
“200 Della Paolera” Office building (under development in Catalinas)

         Recent sell to IRCP            Current Ownership         Total Project
                                                            35,000 GLA sqm
  14,213 sqm
                                                    87%
                                                            FY 2020 Est. opening
   12 floors                                                USD 10-12mm
   131 parking spaces                                       Est. EBITDA
                                              13%

                                                            41% Work Progress*
                                                            *As of January 31, 2018

    Price:
    (including remaining development)

    USD 60.3 mm
    Price/sqm:
    ~USD 4,200

© 2017 CRESUD. All rights reserved.                                                   Page   8
Projects under development

   Zetta building (Polo Dot 1st office building)
   The first building of the Office Park developed in the north area of BA City

   Recent delivery of units to its tenants for conditioning

                                 20%

                                       80%
                                                              32,000 GLA sqm
                                                              Fully Leased
                                                              ARS 1,425 mm
                                                              Est. investment
                                                              ~ USD 9mm
                                                              Est. EBITDA

                                                              99% Work Progress
                                                              IIIQ 2019 Est. opening
© 2017 CRESUD. All rights reserved.                                               Page   9
Polo Dot Full Project

                                                                                              Polo Dot 3rd stage

                                     Existing Shopping Mall Future Mall Expansion

                                                                                                              Polo Dot 2nd stage
          Existing Office Building
                                                                          Zetta Building
                                                                         Polo Dot 1st stage

                     Philips Building
                     Future Recycling

© 2017 CRESUD. All rights reserved.                                                                                                Page   10
Projects under development: Alto Palermo Expansion
Alto Palermo Shopping mall – BA City
Highest sales/sqm shopping mall
3,900 US$28.5mm
sqm GLA estimated investment
FY2020
opening date
© 2017 CRESUD. All rights reserved. Page 11Recent approval, after 20 years, of a Mixed-Use Project in
Caballito plot of land
Land Plot of 23,000 sqm
Capacity to develop
Residential: ~ 76,000 sqm
Retail: ~ 11,000 sqm
© 2017 CRESUD. All rights reserved. Page 12Argentina Business Center – Hotels
Rate & Occupancy evolution
69,1% 71,5% 68,5%
201 195 205
IIQ17 IIQ18 IIQ19
Llao Llao
Bariloche – Río Negro Avg. Rate/room (USD) Occupancy
On Feb-19, IRSA acquired EBITDA (ARS MM) Book Value as of Jun ‘18
20% of the shares of
Hoteles Argentinos S.A., 305
owner of the hotel known 25.4
as Sheraton Liberatdor
Current stake: 100% + 331% 35,610
+ 563%
5.9
46
8,204
6M18 6M19 Historical Adjusted for Inflation
Intercontinental Sheraton Libertador
BV (USD MM) USD / room
BA City BA City
© 2017 CRESUD. All rights reserved. Page 13IRSA Main Landbank across Argentina and Uruguay
Santa María del Plata
~ 700,000 sqm to be developed
Premium Location in BA City
Mixed Use Project
Approvals pending
Montevideo Project (Uruguay) Puerto Retiro (BA) La Adela (Lujan - BA)
© 2017 CRESUD. All rights reserved. Page 14Argentina Business Center – Banco Hipotecario
Ownership Share Price evolution
IRSA
29.9%
+15%
Current vs.
IIQ 19
2019 main work fronts: 13.6
13,5
• Liabilities: to preserve cash and long term 11,8
-14%
deposits, adjusting rates to market IIQ 19 vs. IIQ
changes. 18
• Assets: increase of commissions, fees and
preservation of the quality of the portfolio
31/12/2016 30/6/2017 31/12/2017 30/6/2018 31/12/2018
in a context of higher delinquency rates.
Market Value to IRSA
• Balance Sheet equilibrium: preserving the
solvency and liquidity, with focus on the (USD million)
funding.
328
Results to IRSA
174
The bank has generated a loss of ARS 79 140 153
million during 6M 19 compared to a gain
of ARS 309 million during 6M 18, mainly
explained by the Implementation of IFRS 9.
IIQ17 IIQ18 IIQ19 Current as of Feb,21
© 2017 CRESUD. All rights reserved. Page 15Argentina Business Center – International
Lipstick Building Condor Hospitality Trust
Ownership
IRSA
18.9%*
FLOAT
STEPSTONE 56.8%
NOI (USD MM) 24.3%
8,38
27 Share Price Evolution
26 26
20/2/2017 20/8/2017 20/2/2018 20/8/2018 20/2/2019
FY16 FY17 FY18
Market Value to IRSA
Leases (USD MM) & Occupancy
(USD million)
22,8
95% 97% 97% 4 (*)
22,0 18,8
69 78 76,7 15,5
IIQ 18 IIQ 19 Current as of Feb
FY17 FY18 IIQ19 22, 2019
(*) 3,3mm in preferred E Series + 0,7 mm promissory note
© 2017 CRESUD. All rights reserved. Page 16Israel Business Center – Main Events 6M 2019
Sale:
Sales: 7.5% stake
NIS 416 mm.
(Through Current stake: 26.0%
swap transactions) Aug-2018: 5% stake Acquisitions:
Jan-2019: 4.5% stake
Current stake: 25.3%
Economic rights: 54.9%
3% stake 9.2% stake 0.7% stake
NIS 55 mm NIS 31 mm NIS 15 mm
6.000 Market Cap vs. Book Value Current stake: 67.5% Current stake: 59.5% (+NIS 31 mm option exercise)
(NIS million) Current stake: 43.9%
5.500
5.150,7
5.000
4.500
Shares repurchase plan:
4.000 Up to NIS 120 mm
3.500 Period: 1 year (until Dec-2019)
3.000 Remaining floating capital stock: no less than 10.1%
2.500 2.927,9 As of Dec-2018 2.1 mm shares already repurchased (NIS 9 mm)
2.000 57% BV
1.500
Equity Market cap
1.000
Dividend distribution (Feb-2019): NIS 100 mm
(NIS 60 mm in kind – IDB Series 9 Bond – and NIS 40
mm in cash)
© 2017 CRESUD. All rights reserved. Page 17Investment in IDB & DIC (Israel)
Current Corporate Structure
Indirectly*
100% 77.9% Working to reduce one more
layer of public companies
before December 2019,
according to Concentration
Law requirement
19.3% 100% 25.3%** 68.8% 43.9% 67.5% 59.5% 26.0%
Financial Telecommunicatio
Energy Tourism Insurance Real Estate Technology Supermarket
Investments ns
45.4% 51.7%
Agriculture Rental Properties
* There is a non recourse intercompany loan between Dolphin (borrower) and IDB (lender) due to the transference of DIC shares. This loan is guaranteed with DIC shares sold.
** 29.6% stake sold through local swap transactions, holding economic rights for 54.9%.
© 2017 CRESUD. All rights reserved. Page 18PBC & Gav Yam: Leading real estate companies in Israel
Main tenants
1,160,000 sqm 97%
HSBC building (Manhattan) Tivoli (Las Vengas)
in Israel occupancy
670,000 sqm 142,000 sqm
Land reserve in USA
© 2017 CRESUD. All rights reserved. Page 19Real Estate projects under development in Israel
8 Projects - 194,000 sqm
MATAM-YAM:
REHOVOT: 3 of 4 Recently finished. NEGEV: 3 of 4
buildings finished Amazon main tenant buildings finished TOHA: 95% already leased. Opening during 2H FY 2019
The New Haifa Bay – Logistic Center: Opening during 2H FY 2019
© 2017 CRESUD. All rights reserved. Page 20Deleverage at IDB & DIC
Net Debt (USD million)
Stand alone
Stand alone
1290 1312
1466
1321
923
781
749 739
698 951 954 966
740
673
dec-2012 dec-2013 dec-2014 dec-2015 dec-2016 dec-2017 dec-2018 dec-2012 dec-2013 dec-2014 dec-2015 dec-2016 dec-2017 dec-2018
© 2017 CRESUD. All rights reserved. Page 21IRSA Net Debt as of December 31, 2018*
USD million
IRSA Net Debt 294.2
Amortization Schedule
205.5
83.2
5.9 8.8
FY 2019 FY 2020 FY 2021 FY 2022
*Does notCRESUD.
© 2017 include IRCP
All&rights
IDB/DIC debt
reserved. Page 22Thanks!
You can also read