Influence of Farming System on Weed Infestation and on Productivity of Narrow-Leaved Lupin (Lupinus angustifolius L.) - MDPI
←
→
Page content transcription
If your browser does not render page correctly, please read the page content below
agriculture
Article
Influence of Farming System on Weed Infestation
and on Productivity of Narrow-Leaved Lupin
(Lupinus angustifolius L.)
Agnieszka Faligowska 1, *, Katarzyna Panasiewicz 1 , Grażyna Szymańska 1 ,
Karolina Ratajczak 1 , Hanna Sulewska 1 , Agnieszka Pszczółkowska 2 and Anna Kocira 3
 1    Department of Agronomy, Faculty of Agronomy and Bioengineering, Poznań University of Life Sciences,
      Dojazd 11, 60-632 Poznań, Poland; katarzyna.panasiewicz@up.poznan.pl (K.P.);
      grazyna.szymanska@up.poznan.pl (G.S.); karolina.ratajczak@up.poznan.pl (K.R.);
      hanna.sulewska@up.poznan.pl (H.S.)
 2    Department of Phytopathology, Entomology and Molecular Diagnostics, University of Warmia and Mazury,
      10-719 Olsztyn, Poland; agnieszka.pszczolkowska@uwm.edu.pl
 3    Institute of Agricultural Sciences, State School of Higher Education in Chełm, Pocztowa 54,
      22-100 Chełm, Poland; akocira@pwsz.chelm.pl
 *    Correspondence: agnieszka.faligowska@up.poznan.pl

 Received: 3 September 2020; Accepted: 5 October 2020; Published: 8 October 2020

 Abstract: Legumes have become important crops, due to an increasing global population and
 its demand for feed protein. Furthermore, legumes can improve the characteristics of the soil,
 improve biodiversity levels in crop rotations, and be cultivated in both organic and sustainable farming
 systems. In this study, a two-factor field experiment was conducted in Gorzyń, Poland in 2011–2015.
 The first factor was the farming system: low-external inputs (LI; without fertilization and chemical
 protection), medium-input (MI; medium fertilization level and chemical protection), and high-input
 (conventional—CONV; high fertilization level and chemical protection). Narrow-leaved lupin cultivar
 was the second factor; the indeterminate cv. Kalif and the determinate cv. Regent. We evaluated (a)
 weed infestation levels, (b) seed and protein production, and (c) the economic effects of narrow-leaved
 lupin cultivation under different farming conditions. A total of 12 weed species were identified,
 with the lowest weed density level and biomass production observed in CONV, and the greatest weed
 density level observed in LI. Seed yield was determined by the farming system; the greatest in CONV
 and significantly lower in LI (by 0.73 t h−1 ) and MI (by 0.18 t ha–1 ). Little difference was observed in
 seed yield between cultivars. The greatest production values for the Kalif and Regent cultivars (996€
 and 949€ ha–1 , respectively) were recorded in CONV, although LI proved to be the most profitable
 (with the highest gross agricultural income and lowest total cost of production). LI farming systems,
 in conjunction with chemical weed control, should be investigated in future studies.

 Keywords: lupin; yielding; weed infestation; cultivation intensification; production cost

1. Introduction
      With an ever-increasing human population, the agricultural sector is confronted with a number of
critical challenges, namely, how to produce sufficient volumes of food for this population, while at the
same time preventing the pollution of natural ecosystems [1]. According to Fess et al. [2], high-input
farming systems become less sustainable and practical as the global population increases, because of
reduced requirement of resources.
      Legume crops can be cultivated under both organic and sustainable farming systems [3].
Pulse crops, such as white lupin (Lupinus albus L.), yellow lupin (Lupinus luteus L.), and narrow-leaved

Agriculture 2020, 10, 459; doi:10.3390/agriculture10100459                  www.mdpi.com/journal/agriculture
Agriculture 2020, 10, 459                                                                                              2 of 10

lupin (Lupinus angustifolius L.) are native European plants, and could provide an excellent source of plant
protein [4,5]. Legumes are also very important in plant production systems, as they fix atmospheric
nitrogen (N2 ), thereby increasing the soil concentration of a fundamentally important plant nutrient.
In European conditions, the most widely cultivated grain legumes (e.g., lupin, faba bean, and field pea)
accumulate an average of 130–153 kg N ha−1 (from biological fixation) in their aboveground biomass [6].
Indeed, the potential range of N fixation in lupin is even wider, with values of 300 kg N ha−1 reported
in some studies [7]. Crews and Peoples [8] concluded that the supply of N from legumes (biological)
may be a more sustainable source than synthetic (chemical) sources. Moreover, while some countries
are very dependent on the latter for food production, many have the capability to substantially reduce
synthetic N dependence through the adoption of less meat-intensive diets, and through the reduction
of food waste [8]. While many national governments in Europe support the production of legume
crops, economic impetus for legume cultivation is lacking, especially in areas where cereal and oilseed
crops grow well [9]. However, legume cultivation could provide more plant protein, and also lead
to increased biodiversity levels in crop rotations [10]. Modern, high-performance crop varieties are
usually bred for high-input farming systems [2], although more environment-friendly cultivation
methods have been sought [11,12]. In studies concerning white lupin, the highest income and the
lowest cost of production for 1 t of seeds and 1 kg protein were provided by LI, but this type of farming
system poses a risk of weed infestation, and reduces seed and protein yields. That is why LI farming
system should be supplemented with chemical crop protection against weeds. As such, the low-input
technology, along with supplemented chemical weed control, may be considered for higher seed and
protein yields of lupin [13].
     The objective of this study was to assess the influence of three farming systems (LI, MI, and CONV)
on (a) weed infestation, (b) seed and protein yield, and (c) the economic effects of cultivation of two
narrow-leaved lupin cultivars.

2. Materials and Methods

2.1. Site Description
      The study was part of a long-term field experiment carried out at the Gorzyń Research Station,
Poland (52◦ 340 N, 15◦ 540 E). The soil type, according to the World Reference Base, is an Albic Luvisol
that overlies a gray–brown podzolic. Total N content in the soil was 527 mg kg−1 soil, plant available
phosphorus (P) was 13.9 mg kg−1 soil, and potassium (K) was 10.9 mg kg−1 soil. Weather conditions
during the study are expressed as the hydrothermal coefficient of water supply according to the
Sielianinov index (K) (Table 1).

      Table 1. Sielianinov index (K) during the narrow-leaved lupin growing season (2011–2015), recorded at
      the Agrometeorological Observatory in Gorzyń, Poland.

             Year (Y)       April      May         June        July      August       Sum of Rainfall (mm)
               2011         0.25       0.58        0.89        3.18        0.48                  287
               2012         0.80       0.84        2.26        2.27        1.90                  412
               2013         0.53       1.63        2.10        0.87        0.49                  278
               2014         1.99       2.50        0.97        1.18        1.74                  390
               2015         1.30       0.43        1.02        1.22        0.17                  184
         K: 1.5 = excessive moisture.

      The following formula was applied:

                                               K = (Mo × 10)/(Dt × days)

where K is the hydrothermal coefficient for an individual month during the growing season, Mo is
total monthly precipitation, and Dt is the mean daily temperature in a particular month.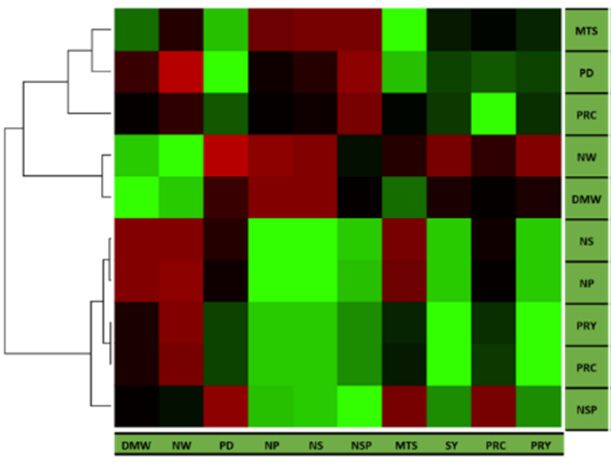
Agriculture 2020, 10, 459                                                                                      3 of 10

     During the study, there were considerable differences in the weather conditions during the
growing season (Table 1). On average, 2011 and 2015 were least favorable for growth, because of low
hydrothermal coefficients (K). However, it should be noted that the Sielianinov coefficient was at least
1.0 during the period of greatest demand for water by the plants, i.e., during florescence (June) and
pod emergence (July), which means that the narrow-leaved lupin plants had a relatively good supply
of water during their most critical development period.

2.2. Experimental Design and Agronomic Management
     The field experiment was replicated at the same location every year over a 5-year period (2011–2015).
Four replicates of the two-factors were evaluated in a split-plot design. The main plot factor was the
farming system: low-external input (LI), medium-input (MI), and high-input (conventional—CONV).
The second plot factor was narrow-leaved lupin cultivar (indeterminate cv. Kalif and determinate cv.
Regent). A detailed description of the farming systems employed in this study can be found in Table 2.
In MI and CONV systems, herbicides were used to target particular plant species: chlorothalonil was
used once in 2011, and then three times in each growing season (2012–2015); alfa-cypermethrin was
applied once per growing season.

                        Table 2. Characteristics of the farming systems evaluated in this study.

        Agronomic                                             Farming System
        Treatment                  LI                        MI                              CONV
                                                     carboxin, thiram             carboxin, thiram (350 mL per
          Seed              Bradyrhizobium
                                               (350 mL per 100 kg of seeds)              100 kg of seeds)
       conditioning             lupini
                                                   Bradyrhizobium lupini              Bradyrhizobium lupini
                                                                                linuron (1.0 L ha−1 ) + clomazone
                                                        Mechanical                         (0.2 L ha−1 )
       Weed control           mechanical             linuron (1.0 l h−1 )             (direct after sowing)
                                                   (direct after sowing)             metamitron (1.5 L ha−1 )
                                                                                       (after emergence)
      Soil fertilization
                                   –               N–15; P–21.8; K–58.1                N–30; P–30.5; K–83
          (kg ha–1 )
     Foliar application                                                                multiple micro- and
                                   –                          –
        of fertilizers                                                                     macroelements
                                                 chlorothalonil (2.0 l ha−1 )      chlorothalonil (2.0 L ha−1 )
      Disease control              –             (tatrachloroizoftalonitryl)        (tatrachloroizoftalonitryl)
                                                      for Anthracnose                     for Anthracnose
                                                                                 alfa-cypermethrin (0.1 L ha−1 )
      Insects control              –                          –                          (after emergence)
                                                                                           for Sitona spp.
        Desiccation                                                                     diquat (2.5 L ha−1 )
                                   –                          –
       before harvest                                                                  (dibromide formula)
                    Farming system: LI = low external input; MI = medium input; CONV = conventional.

     The area of each single experimental plot was 20 m2 . Lupin was cultivated in crop rotation:
legumes, winter rape, and cereals. The forecrop was winter wheat (Triticum aestivum), which was
cultivated in a conventional tillage system, where P and K fertilizers were applied in autumn
(80 kg P ha−1 , 100 kg K ha−1 ). Winter wheat N fertilization rates (NH4 NO3 ; N 34%) were as follows:
60 kg N ha−1 (early spring, before the start of crop growth); 120 kg N ha−1 (the second rate during
straw shooting phase); and 180 kg N ha−1 (the third rate during earing). Each year, the soil was
ploughed after harvest of the forecrop (winter wheat) in autumn, and was harrowed in spring before
lupin was sown. Recommended sowing rates were as follows: 100 seeds m−2 for indeterminate Kalif,
and 115 seeds m−2 for determinate Regent. Seeds were sown at a depth of 4 cm in rows spaced at
18 cm intervals in early April. In all systems, plots were drilled with a double disk drill (Great Plains,
Solid Stand 100 equipped with a fluted coulter for residue cutting, a double disk for seed placement,
Agriculture 2020, 10, 459 4 of 10
and a press wheel (3 m wide). Weight of the tractor was 2885 kg). Each year, lupin was harvested in
August with a 1.5-m-wide Wintersteiger plot combine harvester.
2.3. Data Collection
During each growing season, weed infestation was assessed on each plot two weeks before
harvest. Weeds collected from the site were dried in a laboratory at 80 ◦ C for 48 h. Weed infestation
was expressed as the number and dry mass of weeds per unit area (m2 ) and as the percentage share of
specific species in the total number of weeds in each farming system.
For narrow-leaved lupin, the following traits were assessed: plant density/m2 before harvest,
the biometric traits of 10 randomly selected plants before harvest (the number of pods/plant, number of
seeds/plant, and number of seeds/pod), and the mass of 1000 seeds (seeds collected from the harvested
seed mass; 2 × 500 seeds were counted and weighed). Seed yield/ha was calculated at the 15% moisture
level. Analyses of seed protein content were carried out in the laboratory, according to Kjeldahl
(N values were multiplied by 6.25) [14]. Seed protein content was expressed on a dry weight basis
(g kg–1 ), and was recalculated as protein yield (kg ha–1 ).
Economic analysis of each farming system was evaluated with data from the experimental
plots, i.e., machinery operations, inputs, and average yields. Direct costs for all farming systems
included seeds, cultivation, seed conditioning, mechanical weed control, and harvest. For the MI and
CONV systems, additional direct costs accrued from disease and insect control, and desiccation before
harvest (only in CONV). Overall costs included the cost of seeds, fertilizers, chemical crop protection,
machinery operations, labor, and services. All calculations were based on 2015 prices. The cost of
seeds, fertilizers, and plant protection (herbicides, fungicides, and insecticides) were estimated from
agricultural dealers and from national-level market prices [15]. Crop subsidy data were taken from
the Agency for Restructuring and Modernization of Agriculture [16]. Subsidies included single area
payment (107.59€), additional payment for legumes (241.18€), and direct payments for seeds (30.83€).
All prices and costs were recalculated in euro (€) according to the monthly average exchange rate in
September 2015 [17].
2.4. Statistical Analysis
The impact of farming system on lupin cultivar traits was examined with two-way analysis of
variance (ANOVA) using SAS PROC GLM (SAS Institute Inc. 1996). Least significant difference was
verified with Tukey’s multiple range test at p < 0.01 and p < 0.05 significance levels. Relationships
between parameters were determined with the Pearson correlation coefficient. Interpretation of
Pearson’s linear correlation coefficient was conducted according to Stanisz [18]. Correlations between
traits in each farming system were determined using SAS PROC CORR.
3. Results
Weed community composition was affected by the farming system (Table 3). A total of 12 weed
species were identified: 11 in LI, 8 in MI, and 8 in CONV. POLCO (Polygonum convolvules (L.)
A. Löve) and CHEAL (Chenopodium album L.) were the most frequently observed species across all
farming systems, at 43–49% and 27–32%, respectively. Less frequently observed species were LYCAR
(Anchusa arvensis L.), CAPBP (Capsella bursa-pastoris (L.) Medik.), CONAR (Convolvulus arvensis L.),
GALAP (Galium aparine L.), and LAMAM (Lamium amplexicanle L.), and accounted forAgriculture 2020, 10, 459 5 of 10
Table 3. Effect of farming system on botanical composition of weeds in the study plots (share, %).
Farming System
Latin Binomial Bayer Code
LI MI CONV
Agropyron repens (L.) Beauv. AGRRE 4 2 0
Anchusa arvensis L. LYCAR 1 0 1
Capsella bursa-pastoris (L.) Medik. CAPBP 1 0 0
Chenopodium album L. CHEAL 27 31 32
Convolvulus arvensis L. CONAR 0 0 1
Echinochola crus-galli (L.) Beauv. ECHCG 4 8 11
Galinsoga parviflora Cav. GASPA 2 3 0
Galium aparine L. GALAP 1 1 0
Lamium amplexicanle L. LAMAM 1 0 1
Polygonum convolvules (L.) A. Löve POLCO 49 46 43
Polygonum lapathifolium L. POLLA 5 1 6
Viola arvensis Murr. VIOAR 5 8 5
LSD Value 4.72 **
Number of species No. 11 8 8
Significance: ** p < 0.01. Farming system: LI = low external input; MI = medium input; CONV = conventional.
Table 4. Effect of farming system and cultivar type on level of weed infestation, yield, and seed
protein content.
Farming System
Specification LSD Value
LI MI CONV
Dry weight of weeds (g) 243.9 199.0 162.7 24.02 **
Number of weeds 97.7 80.8 63.5 17.83 **
Plant density (no. m2 ) 72.9 77.7 75.2 NS
Number of pods per plant 6.0 7.3 7.7 1.09 **
Number of seeds per plant 23.2 25.4 27.1 NS
Number of seeds per plant pod 3.9 3.5 3.5 0.24 **
Mass of 1000 seeds (g) 137.1 136.6 137.0 NS
Protein content in seeds (g kg–1 ) 307 304 317 NS
Cultivar
Kalif Regent
Dry weight of weeds (g) 221.5 182.2 37.82 *
Number of weeds 85.3 76.9 NS
Plant density (no. m2 ) 68.9 81.6 3.38 **
Number of pods per plant 7.6 6.4 0.71 **
Number of seeds per plant 27.7 22.8 3.08 **
Number of seeds per plant pod 3.6 3.6 NS
Mass of 1000 seeds (g) 141.5 132.2 3.58 **
Protein content in seeds (g kg–1 ) 313 306 NS
NS: non-significant; * p < 0.05 and ** p < 0.01. System: LI = low external input; MI = medium input; CONV = conventional.
Farming system intensity substantially affected the numbers of pods and seeds/plant pod (Table 4).
However, this factor did not have an impact on plant density, seeds/plant, or the 1000 seed mass.
A significantly greater number of pods/plant were observed in the MI and CONV systems, although the
number of seeds/plant pod were significantly lower than in LI. Cultivar type was found to modify
yield components; a significantly greater plant density was observed in the Regent cultivar, and a
significantly lower number of pods and seeds/plant and 1000 seed mass compared to Kalif. There was
no significant difference in seed protein content between experimental factors.
No significant interactions were observed between the experimental factors and protein and seed
yield (Table 5). The greatest protein yield was observed in CONV, and was significantly lower in LIAgriculture 2020, 10, x FOR PEER REVIEW 6 of 10
Agriculture 2020, 10, 459 6 of 10
No significant interactions were observed between the experimental factors and protein and
seed yield (Table 5). The greatest protein yield was observed in CONV, and was significantly lower
and in
MILI(by
and31.3%
MI (by 31.3%
and and
11%, 11%, respectively).
respectively). Although
Although no significant
no significant differences
differences were
were observedininseed
observed
yield between cultivars, the protein yield in Regent was substantially lower (by 54 kg ha–1ha
seed yield between cultivars, the protein yield in Regent was substantially lower (by 54 kg –1). Seed
). Seed yield
yield was strongly affected by farming system, and the greatest yield was recorded in CONV, and
was strongly affected by farming system, and the greatest yield was recorded in CONV, and was
was significantly lower in LI (by 0.73
–1 t ha ) and MI (by 0.18 t–1ha ).
–1 –1
significantly lower in LI (by 0.73 t ha ) and MI (by 0.18 t ha ).
Table 5. Narrow-leaved lupin protein yield (kg ha–1) and seed yield (t ha–1).
Table 5. Narrow-leaved lupin protein yield (kg ha–1 ) and seed yield (t ha–1 ).
Farming System (FS)
Cultivar (C) LIFarmingMISystem (FS) CONV Mean
Cultivar (C) LI MI Yield CONV
Protein Mean
Kalif 488 Protein
641 Yield 714 614
Regent
Kalif 452
488 575
641 654
714 560
614
Mean
Regent 470
452 608
575 684
654 560
LSD value FS—33.3
Mean 470 **; C—46.4
608 *; FS ×684
C—NS
LSD value FS—33.3 **; C—46.4 *; FS × C—NS
Seed Yield
Kalif 1.85 2.45Yield
Seed 2.26 2.31
Regent 1.75 2.25 2.44 2.15
Kalif 1.85 2.45 2.26 2.31
Mean
Regent 1.80
1.75 2.35
2.25 2.53
2.44 2.15
LSD value
Mean FS—0.13 **; C—NS;
1.80 2.35 FS × C—NS
2.53
NS: non-significant;
LSD *value
p < 0.05 andFS—0.13
** p < 0.01.
**;System:
C—NS;LIFS= ×low external input; MI = medium input;
C—NS
CONV = conventional.
NS: non-significant; * p < 0.05 and ** p < 0.01. System: LI = low external input; MI = medium input; CONV = conventional.
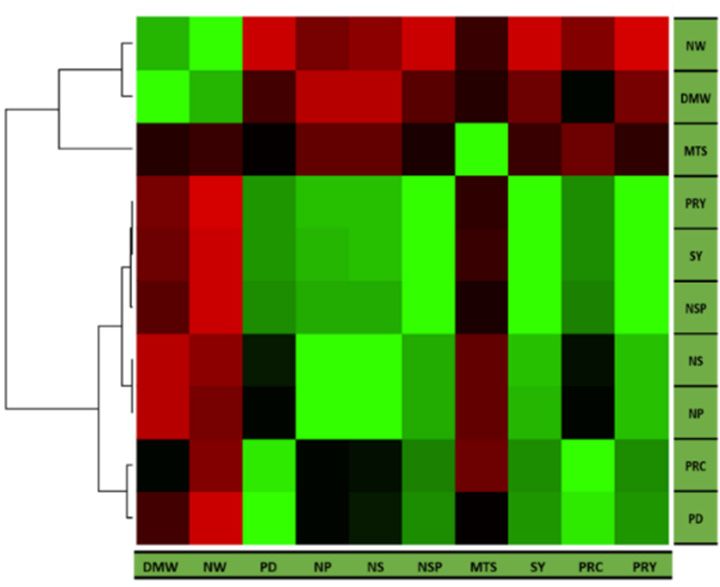
In each farming system, functional relationships were observed between the number of
In each farming system, functional relationships were observed between the number of
pods/plant and the number of seeds/plant, and seed yield and protein yield (Figure 1). However,
pods/plant and the number of seeds/plant, and seed yield and protein yield (Figure 1). However,
correlations between the number of seeds/plant pod and seed yield and the protein yield in LI were
correlations between the number of seeds/plant pod and seed yield and the protein yield in LI were
also practically functional relationships. Negative relationships were observed between the number
also of
practically
weeds and functional relationships.
seed yield Negative
and protein yield; relationships
strong in LI, poorwere observed
in MI, between
and practically the number
functional in of
weeds and seed yield and protein yield; strong in LI, poor in MI, and practically functional in CONV.
CONV.
CONV MI
Interpretation of Pearson’s linear correlation coefficient
LI
Figure 1. Correlation coefficients between analyzed parameters. System (FS): LI = low input;
MI = medium input; CONV = conventional. Parameters compared: DMW = dry mass of weeds;
NW = number of weeds; PD = plant density; NP = number of pods/plant; NS = number of seeds/plant;
NSP = number of seeds/plant pod; MTS = mass of 1000 seeds; SY = seed yield; PRC = protein content;
PRY = protein yield.Agriculture 2020, 10, 459 7 of 10
In both cultivars, the highest production values were recorded in CONV, which also had the
greatest cost of seeds and protein production, and the lowest gross agricultural income (Table 6). The LI
system proved to be the most profitable (i.e., gross agricultural income) for both Kalif and Regent
cultivation, and the total cost of production was also lowest.
Table 6. Economic analysis of the profitability of narrow-leaved lupin cultivation under different
farming systems (all values expressed in euro).
Kalif Regent
Specification Farming System
LI MI CONV LI MI CONV
Production value * ha–1 830.17 972.45 996.16 806.45 925.00 948.74
Total cost ha–1 353.87 546.40 886.16 387.98 580.50 920.28
Gross agricultural income ha–1 476.30 426.06 110.00 418.47 344.50 28.46
Cost of 1 t seed production ** 186.25 218.56 340.83 215.54 252.39 383.45
Cost of 1 kg protein production *** 0.73 0.85 1.24 0.86 1.01 1.41
System: LI = low external input; MI = medium input; CONV = conventional. * (average yield ha–1 × € 237. 14, price of
1 t seeds) + € 379.60 EU subsidies, ** Total cost/ average yield ha–1 , *** Total cost/ average protein yield ha–1 .
4. Discussion
Our study suggests that weed community assembly was affected by the farming system. A total
of 12 weed species were identified, and the lowest weed density/m2 and biomass/m2 values were
observed with the CONV system, and the greatest were observed in LI. The number of weeds/m2 was
54% greater in LI compared to CONV, and there was no difference between MI and CONV. The greater
weed infestation is due to the absence of herbicide use, and the mechanical treatment employed in
the LI system was insufficient to improve lupin competitiveness. Our results are in agreement with
Poudel et al. [19], who also found that low-input systems generally have greater aboveground weed
biomass and more weed competition in comparison to conventional systems. Others researchers
who have analyzed the influence of farming systems on the cultivation of lupin species (yellow,
narrow-leaved, and white lupin) have reported significantly greater weed infestation levels in plots
that received only mechanical treatment [20]. In the study by Borowska et al. [20], the application
of herbicides in medium-input and high-input systems significantly reduced both the level of weed
infestation and the weed dry weight of all lupin species. However, additional herbicide application
after sowing and post-emergence in the high-input system did not significantly reduce weed dry
weight. Chemical weed control should carefully consider the sensitivity of the crop to the herbicide,
followed by observation of the application technology, as well as important aspects, such as compound
mixture, ambient environmental conditions, and the use of adjuvants [21].
Weed infestation intensity in individual farming systems can be modified not only by the type of
treatment applied, but also by the number of lupin plants per area unit. In our study, significantly
lower weed dry mass was observed with Regent cultivation, compared to Kalif. We suggest that
the determinate cultivar Regent is more competitive than the indeterminate cultivar Kalif, because it
exhibited a significantly greater density of plants per area unit, due to higher recommended sowing
rates. Farming system did not influence plant density in our study, in contrast to Suliman [22],
who showed that conventional tillage and mechanical weed control significantly increased legume
plant density.
Our results show that the weed infestation can influence narrow-leaved lupin productivity.
Pearson’s linear correlation indicated a negative relationship between number of weeds and seed and
protein yields, which was strong in LI, poor in MI, and practically functional in CONV. This means
that when the number of weeds increase, protein and seed yields decrease, depending on the farming
system employed. Weeds in lupin crops have become increasingly difficult to control [23]. In our
study, the greatest narrow-leaved lupin protein and seed yields were found in CONV (compared toAgriculture 2020, 10, 459 8 of 10
LI and MI), although the yield in this system primarily depended on the number of weeds present.
Borowska et al. [20] found that seed yield in white and narrow-leaved lupin was significantly greater in
the high-input system, while yellow lupin yield was greatest in the high- and medium-input systems.
A significant increase in seed yield, along with an increasing intensity of the cultivation in the case of
traditional and self-completing cultivars of white and yellow lupin, as well as self-completing cultivars
of narrow-leaved lupin, resulted mainly from the development of a higher number of pods. Szymańska
et al. [24] also studied the influence of farming system on the development and yield of yellow lupin,
and observed that seed yield was 13.1% and 22.0% greater in the MI and CONV systems, respectively,
than in LI. Their research also highlighted differences in cultivar yield; the indeterminate cultivar
Mister produced more seeds than the determinate cultivar Perkoz (1.95 t ha–1 vs. 1.81 t ha–1 ). In our
experiment, there was no significant difference in seed yield between lupin cultivars. We observed
significantly lower pod numbers, seeds/plant, and the 1000 seed mass in Regent, compared to Kalif.
Determinate lupin cultivars have been reported to exhibit a reduced number of branches to improve
the maturation of the plants.
In our study, farming system was also found to modify the yield components. We found a
significantly greater number of pods/plant in MI and CONV (compared to LI), but substantially lower
numbers of seeds/plant pod. Borowska et al. [20] observed a non-significant difference in the number
of pods/plant between medium- and high-input systems, as well as between low- and medium-input
systems for all lupin species in their study. Szymańska [24], studying yellow lupin yield components,
found that differences in farming system intensity and cultivar type significantly influenced the number
of pods and seeds/plant. However, these factors had no influence on the number of seeds/pod or the
1000 seed weight.
Lupin is valued mainly for its high protein content. In our experiment, protein content in seeds
ranged from 304 to 317 g kg–1 . Protein yield in Regent was lower (by 54 kg ha–1 ) compared to Kalif, and
the greatest protein yield was found in CONV and was significantly lower in LI and MI. A practically
functional relationship was observed between protein yield and seed yield in each farming system.
This is because of method of calculation of protein yield. In our experiment, the cost of protein
and seed production was greatest in CONV, but gross agricultural income was also lowest in this
system. According to Czerwińska-Kayzer and Florek [25], gross agricultural income is a basic economic
category that is indicative of the profitability of agricultural production. In our study, the LI system
(greatest gross agricultural income and lowest total cost of production) proved to be the most profitable
for both cultivars. According to Szymańska et al. [24], increased expenditure in CONV farming systems
can lead to a decrease in gross agricultural income; in our experiment, the cost of production of 1 tonne
of seeds (for on-farm feed production) was lowest in the LI system. Although production was greatest
in CONV, the greater cultivation intensity (in yellow lupin) observed in Szymańska et al. [24] was not
economically justified (compared to cultivation of narrow-leaved lupin in our experiment). Moreover,
work by Panasiewicz et al. [26] showed that the increase in narrow-leaved lupin seed yield produced
by a more intensive tillage option (conventional tillage) compensated for the increase in overall costs.
Aside from economic performance, high-input farming systems may lead to increased
environmental problems, as a consequence of the fertilizers and pesticides applied during the course
of cropping operations. As legumes support biological N2 fixation, they offer a more environmentally
robust and sustainable N source for cropping systems [8]. At zero fertilization levels, weeds (due to
extremely strong competition for soil N) might force lupin plants to depend more on N fixation, thereby
making the N fixation process more efficient.
5. Conclusions
Our economic analysis indicates that the greatest income and the lowest cost of production for
both narrow-leaved lupin cultivars were provided by the LI farming system, although this type of
farming system does carry a risk of elevated weed infestation levels and reduced seed and proteinAgriculture 2020, 10, 459 9 of 10
yields. Therefore, LI farming systems, used in conjunction with chemical weed control, should be
investigated in future studies.
Author Contributions: A.F. and K.P. conceived and designed the experiments; A.F., K.P., G.S., K.R., and H.S.
performed the field experiments and analyzed the data; A.F. and K.R. performed statistical analysis; K.P. and G.S.
described the materials and methods; H.S., A.P., and A.K. prepared the references; A.F. wrote the manuscript; A.F.,
K.P., G.S., K.R., H.S., A.P., and A.K. revised the manuscript. All authors have read and agreed to the published
version of the manuscript.
Funding: This research was funded by Polish Ministry of Agriculture and Rural Development (Project number
HOR 3.3/2011–2015).
Acknowledgments: This study was funded by a grant from the Polish Ministry of Agriculture and Rural
Development, Project: Improving domestic sources of plant protein, their production, trading and use in animal feed,
project No. HOR 3.3/2011–2015.
Conflicts of Interest: The authors declare no conflict of interest.
References
1. Bhardwaj, H.L.; Hamama, A.A.; Van Santen, E. White Lupin Performance and Nutritional Value as Affected
by Planting Date and Row Spacing. Agron. J. 2004, 96, 580–583. [CrossRef]
2. Fess, T.; Kotcon, J.B.; Benedito, V.A. Crop Breeding for Low Input Agriculture: A Sustainable Response to
Feed a Growing World Population. Sustainability 2011, 3, 1742. [CrossRef]
3. Ksi˛eżak, J.; Staniak, M.; Bojarszczuk, J. The regional differentiation of legumes cropping area in Poland
between 2001 and 2007. Pol. J. Agron. 2009, 1, 25–31.
4. Sujak, A.; Kotlarz, A.; Strobel, W. Compositional and nutritional evaluation of several lupin seeds. Food Chem.
2006, 98, 711–719. [CrossRef]
5. Annicchiarico, P.; Harzic, N.; Carroni, A.M. Adaptation, diversity, and exploitation of global white lupin
(Lupinus albus L.) landrace genetic resources. Field Crop. Res. 2010, 119, 114–124. [CrossRef]
6. Peoples, M.B.; Brockwell, J.; Herridge, D.F.; Rochester, I.J.; Alves, B.J.R.; Urquiaga, S.; Boddey, R.M.;
Dakora, F.D.; Bhattarai, S.; Maskey, S.L.; et al. The contributions of nitrogen-fixing crop legumes to the
productivity of agricultural systems. Symbiosis 2009, 48, 1–17. [CrossRef]
7. Sulas, L.; Canu, S.; Ledda, L.; Carroni, A.M.; Salis, M. Yield and nitrogen fixation potential from white lupine
grown in rainfed Mediterranean environments. Sci. Agricola 2016, 73, 338–346. [CrossRef]
8. Crews, T.E.; Peoples, M. Legume versus fertilizer sources of nitrogen: Ecological tradeoffs and human needs.
Agric. Ecosyst. Environ. 2004, 102, 279–297. [CrossRef]
9. Murphy-Bokern, D.; Watson, C. Legume-supported cropping systems for Europe. In Looking Forward 2016.
Available online: http://www.legumefutures.de/images/Legume_Futures_Looking_Forward.pdf (accessed on
18 August 2020).
10. Preissel, S.; Reckling, M.; Schläfke, N.; Zander, P. Magnitude and farm-economic value of grain legume
pre-crop benefits in Europe: A review. Field Crop. Res. 2015, 175, 64–79. [CrossRef]
11. Pelzer, E.; Bazot, M.; Makowski, D.; Corre-Hellou, G.; Naudin, C.; Al Rifaï, M.; Baranger, E.; Bedoussac, L.;
Biarnès, V.; Boucheny, P.; et al. Pea–wheat intercrops in low-input conditions combine high economic
performances and low environmental impacts. Eur. J. Agron. 2012, 40, 39–53. [CrossRef]
12. Jaśkiewicz, B. The impact of production technology on yields of spring triticale under varied percentages of
cereals to total cropped area. Fragm. Agron. 2017, 34, 7–17. (In Polish)
13. Faligowska, A.; Panasiewicz, K.; Szymańska, G.; Szukala, J.; Koziara, W.; Pszczółkowska, A. Productivity of
white lupin (Lupinus albus L.) as an effect of diversified farming systems. Legum. Res. Int. J. 2017, 40, 872–877.
[CrossRef]
14. AOAC. Official Methods of Analysis; Association of Official Analytical Chemists: Washington, DC, USA, 1975.
15. Ceny Rolnicze. Available online: http://www.cenyrolnicze.pl (accessed on 20 August 2020).
16. Agency for Restructuring and Modernization of Agriculture. Available online: https://www.arimr.gov.pl/
(accessed on 20 August 2020).
17. Central Bank of the Republic of Poland. Available online: http://www.nbp.pl/homen.aspx?f=/kursy/kursyen.
htm (accessed on 20 August 2020).
18. Stanisz, A. Approachable Statistics Course; StatSoft: Krakow, Poland, 1998; p. 362. (In Polish)Agriculture 2020, 10, 459 10 of 10
19. Poudel, D.; Horwath, W.; Lanini, W.; Temple, S.; Van Bruggen, A. Comparison of soil N availability and
leaching potential, crop yields and weeds in organic, low-input and conventional farming systems in northern
California. Agric. Ecosyst. Environ. 2002, 90, 125–137. [CrossRef]
20. Borowska, M.; Prusinski, J.; Kaszkowiak, E. Production results of intensification of cultivation technologies
in three lupin (Lupinus L.) species. Plant Soil Environ. 2016, 61, 426–431. [CrossRef]
21. Dos Reis, A.R.; Vivi, R. Weed Competition in the Soybean Crop Management in Brazil. In Soybean—Applications
and Technology; IntechOpen: London, UK, 2011; pp. 185–210. Available online: https://www.intechopen.com/
books/soybean-applications-and-technology/weed-competition-in-the-soybean-crop-management-in-brazil
(accessed on 20 August 2020).
22. Suliman, A.A.M. Contribution of weed control and tillage systems on soil moisture content, growth and forage
quality of (Clitoria&Siratro) mixture under-rainfed conditions at Zalingei—Western Darfur state—Sudan.
J. Sci. Technol. 2008, 3, 80–90.
23. Anonymous. The Biology of Lupinus L. (Lupin or Lupine); Australian Government; Version 1: April 2013;
Department of Health and Ageing, Office of the Gene Technology Regulator: Canberra, Australia, 2013; p. 64.
24. Szymańska, G.; Faligowska, A.; Panasiewicz, K.; Szukała, J.; Koziara, W. The productivity of two yellow
lupine (Lupinus luteus L.) cultivars as an effect of different farming systems. Plant Soil Environ. 2017, 63,
552–557. [CrossRef]
25. Czerwińska-Kayzer, D.; Florek, J. Profitability of selected legumes. Fragm. Agronomy 2012, 29, 36–44. (In Polish)
26. Panasiewicz, K.; Faligowska, A.; Szymańska, G.; Szukała, J.; Ratajczak, K.; Sulewska, H. The Effect of Various
Tillage Systems on Productivity of Narrow-Leaved Lupin-Winter Wheat-Winter Triticale-Winter Barley
Rotation. Agronomy 2020, 10, 304. [CrossRef]
© 2020 by the authors. Licensee MDPI, Basel, Switzerland. This article is an open access
article distributed under the terms and conditions of the Creative Commons Attribution
(CC BY) license (http://creativecommons.org/licenses/by/4.0/).You can also read