Influence of cyclonic and anticyclonic eddies on plankton in the southeastern Mediterranean Sea during late summertime
←
→
Page content transcription
If your browser does not render page correctly, please read the page content below

Ocean Sci., 18, 693–715, 2022
https://doi.org/10.5194/os-18-693-2022
© Author(s) 2022. This work is distributed under
the Creative Commons Attribution 4.0 License.

Influence of cyclonic and anticyclonic eddies on plankton in the
southeastern Mediterranean Sea during late summertime
Natalia Belkin1 , Tamar Guy-Haim1 , Maxim Rubin-Blum1 , Ayah Lazar1 , Guy Sisma-Ventura1 , Rainer Kiko2 ,
Arseniy R. Morov1 , Tal Ozer1 , Isaac Gertman1 , Barak Herut1 , and Eyal Rahav1
1 Israel   Oceanographic and Limnological Research, Haifa, Israel
2 Sorbonne    Université, Laboratoire d’Océanographie de Villefranche, Villefranche-sur-Mer, France

Correspondence: Eyal Rahav (eyal.rahav@ocean.org.il) and Natalia Belkin (belkin@ocean.org.il)

Received: 26 December 2021 – Discussion started: 6 January 2022
Revised: 10 March 2022 – Accepted: 11 April 2022 – Published: 13 May 2022

Abstract. Planktonic food webs were studied contempora-            1   Introduction
neously in a mesoscale cyclonic (upwelling, ∼ 13 months
old) and an anticyclonic (downwelling, ∼ 2 months old)
eddy as well as in an uninfluenced background situation            The southeastern Mediterranean Sea (SEMS) is an ultra-
in the oligotrophic southeastern Mediterranean Sea (SEMS)          oligotrophic marine system (Berman et al., 1984) with
during late summer 2018. We show that integrated nutri-            low and patchy standing stocks of phytoplankton (Chris-
ent concentrations were higher in the cyclone compared to          taki, 2001; Efrati et al., 2013) and zooplankton (Pasternak
the anticyclone or the background stations by 2–13-fold.           et al., 2005; Siokou-Frangou et al., 2002). Phytoplankton are
Concurrently, Synechococcus and Prochlorococcus were the           bottom–up controlled by N and P (Tanaka et al., 2011; Zo-
dominant autotrophs abundance-wise in the oligotrophic an-         hary et al., 2005) and heterotrophic bacteria are limited by
ticyclone (∼ 300 × 1010 cells m−2 ). In the cyclone, func-         P (Sala et al., 2002; Thingstad et al., 2005; Zohary and Ro-
tional groups such as dinoflagellates, Prymnesiophyceae            barts, 1998), dissolved organic P (DOP, Van Wambeke et al.,
and Ochrophyta contributed substantially to the total phy-         2002; Djaoudi et al., 2018; Sisma-Ventura and Rahav 2019)
toplankton abundance (∼ 14 × 1010 cells m−2 ), which was           and/or dissolved organic C (DOC, Hazan et al., 2018; Ra-
∼ 65 % lower at the anticyclone and background stations            hav et al., 2019). The phytoplankton community is mostly
(∼ 5 × 10¹⁰ cells m−2 ). Primary production was highest in         comprised of cyanobacteria and pico-sized microbial eu-
the cyclonic eddy (191 mg C m−2 d−1 ) and 2–5-fold lower           karyotes with a high surface-area-to-volume ratio (Berman-
outside the eddy area. Heterotrophic prokaryotic cell-specific     Frank and Rahav, 2012; Ignatiades et al., 2002) that enables
activity was highest in the cyclone (∼ 10 fg C cell−1 d−1 ),       a faster nutrient uptake from the environment (Campbell
while the least productive cells were found in the anticy-         and Vaulot, 1993). The low phytoplankton standing stocks
clone (4 fg C cell−1 d−1 ). Total zooplankton biomass in the       lead to low primary production rates of 32–60 g C m−2 yr−1
upper 300 m was 10-fold higher in the cyclone compared             (López-Sandoval et al., 2011; Psarra et al., 2000). Zooplank-
with the anticyclone or background stations (1337 vs. 112–         ton biomass is usually coupled with that of the phytoplankton
133 mg C m−2 , respectively). Copepod diversity was much           and is mostly comprised of mesozooplankton that feed on
higher in the cyclone (44 species), compared to the anticy-        pico-phytoplankton (Dolan and Marrasé, 1995; Pitta et al.,
clone (6 small-size species). Our results highlight that cy-       2001) or other mesozooplankton (Christou, 1998; Pasternak
clonic and anticyclonic eddies show significantly different        et al., 2005).
community structure and food-web dynamics in oligotrophic             Alterations in plankton biomass or activity from their typ-
environments, with cyclones representing productive oases          ically low values can be found episodically in the SEMS
in the marine desert of the SEMS.                                  at distinct hydrologic discontinuities such as cyclonic (up-
                                                                   welling) and anticyclonic (downwelling) eddies (Christaki
                                                                   et al., 2011; Groom et al., 2005; Rahav et al., 2013). These

Published by Copernicus Publications on behalf of the European Geosciences Union.
694                                                            N. Belkin et al.: Cyclone and anticyclone eddies affect plankton

geostrophically balanced mesoscale structures can span tens          paign, which is one of the three operations of the MER-
to hundreds of kilometers in diameter (Groom et al., 2005;           MEX (Marine Ecosystem Response in the Mediterranean
Robinson and Golnaraghi, 1994). These high-energy eddies             EXperiment, https://mermex.mio.univ-amu.fr/, last access:
may retain plankton communities over timescales of weeks             May 2022) project. As such, it coincided with the project’s
to months (Christaki et al., 2011; Menna et al., 2012; Rahav         standard sampling protocols.
et al., 2013) and affect limiting nutrient levels at the euphotic       Seawater was sampled using Niskin bottles (8 L each)
zone (Condie and Condie, 2016). Therefore, the transport of          mounted on a rosette equipped with a temperature, conduc-
potential and kinetic energy, nutrients, and biota by eddies         tivity, depth sensor (CTD) (Seabird 9 Plus) and a fluorom-
(cyclonic or anticyclonic) may alter phytoplankton and zoo-          eter (Sea-Point). Five to six water depths were sampled at
plankton biomass and activity (Allen et al., 1996; Falkowski         each station which represented the main oceanographic fea-
et al., 1991).                                                       tures within the water column derived from real-time CTD
   In this study, we report the results of physical, chemi-          and fluorometer data: the surface (2 m), the bottom of the
cal and biological samplings of two contrasting sites in the         mixed layer depth (30–60 m), the deep chlorophyll a area
SEMS deep waters: cyclonic and anticyclonic eddies as well           (60–165 m) and the bottom of the photic layer (180 m). An
as a background, uninfluenced station. We sampled these sta-         additional offshore station uninfluenced by eddy circula-
tions at the end of summer when the most oligotrophic con-           tion (station THEMO1) was sampled in a parallel cruise at
ditions prevail in the photic layer (Kress et al., 2014; Ra-         the SEMS on the same date as our study in greater detail
hav et al., 2019). We hypothesized that the upward advec-            (11 depths within the photic layer, Reich et al., 2022). The
tion of deep and relatively cold nutrient-rich water within the      chemical and chlorophyll a profiles were not significantly
cyclonic eddy enhances primary production as well as the             different between the THEMO1 and our background sta-
biomass of pico-eukaryotes and zooplankton. By contrast,             tions (Kruskal–Wallis one-way analysis of variance on ranks,
downwelling circulation at the anticyclonic eddy yields ultra-       P > 0.05, Fig. S1 in the Supplement), thus giving credibil-
oligotrophic conditions, even more than those of the back-           ity to our measurements which comprised only five to six
ground waters of the SEMS, leading to low phytoplankton              depths in the photic layer. Mesozooplankton were sampled
biomass and production, the predominance of cyanobacteria,           using vertical WP2 hauls (∅ 57 cm, 50 µm mesh size, Hydro-
and low zooplankton biomass.                                         Bios, Germany) hoisted at 0.5 m s−1 from 300 m to the wa-
                                                                     ter surface during nighttime (19:00–06:00). The southeastern
                                                                     Mediterranean Sea is an extremely oligotrophic region, with
2     Methods                                                        very low zooplankton densities, especially in the large-size
                                                                     fraction (Koppellmann et al., 2009). It was therefore stressed
2.1    Study area and seawater collection                            that the standard 200 µm underestimates the mesozooplank-
                                                                     ton abundance and community structure in this region (Fe-
Water samples were collected during 9–11 October 2018 on             liú et al., 2020) and therefore we used the 50 µm mesh size.
board the R/V Bat-Galim in three distinct water habitats:            Filtered volume was measured using a mechanical flow me-
(1) the core of an anticyclonic eddy (32.14◦ N, 33.59◦ E),           ter (Hydro-Bios, Germany). The raw oceanographic data are
(2) the core of a cyclonic eddy (33.16◦ N, 33.86◦ E), and            publicly available at the ISRAMAR oceanographic database
(3) a station uninfluenced by eddy circulation (hereafter re-        website (http://isramar.ocean.org.il, last access: May 2022).
ferred to as “background”; 32.95◦ N, 34.46◦ E) (Fig. 1a). The
eddy’s core locations were determined a few days prior to            2.2   SeaExplorer glider mission to characterize the
the cruise and were updated until the morning of the cruise                physical characteristics of the water column (upper
by maps created with the Angular Momentum Eddy Detec-                      700 m) within and outside the core area
tion and tracking Algorithm (AMEDA) (Le Vu et al., 2018)
applied to AVISO/CMEMS sea surface height (SSH) data,                An autonomous underwater vehicle (SeaExplorer glider,
which were produced especially for this mission. This algo-          ALSEAMAR) equipped with a Seabird CTD was deployed
rithm tracks individual eddies and accounts for successive           at the southernmost sampling station (at the core of the an-
merging and splitting incidents between eddies. It also cor-         ticyclone). The glider collected the temperature and salinity
rects for cyclostrophic balance of the surface velocity field,       characteristics across the upper 700 m in a very high spa-
which allows for a better representation of intense eddies           tiotemporal coverage during ∼ 18 d. The glider performed a
(Ioannou et al., 2019). A more detailed characterization of          total of 146 dives on its route northwards, yielding 292 quasi
the physical structure of the water column inside or out-            vertical profiles (see the glider track in Fig. 1a).
side the different cores was collected during the cruise and
a few days afterward using a SeaExplorer glider equipped             2.3   Inorganic nutrients
with temperature and salinity sensors (see below). The cruise
was part of a cooperation with the Pelagic Ecosystem Re-             Nutrient concentrations were determined using a three-
sponse to dense water formation in the Levant (PERLE) cam-           channel segmented flow auto-analyzer system (AA-3 Seal

Ocean Sci., 18, 693–715, 2022                                                            https://doi.org/10.5194/os-18-693-2022
N. Belkin et al.: Cyclone and anticyclone eddies affect plankton                                                                    695

Figure 1. Altimetry map with eddies detected by the AMEDA algorithm created on the morning of the cruise (9 October 2018): sampling
stations (yellow marks) and a glider cruise track (green dots) (a), temperature–salinity (T –S) diagram of the stations sampled (b), and
the potential density anomaly derived from a glider mission (292 quasi-vertical profiles) held a few days after the cruise (13–31 October
2018) (c). Contours on the density map show the corresponding isohalines.

Analytical) as described in Sisma-Ventura and Rahav (2019).            2.4   Chlorophyll a and algal photosynthetic pigments
The detection limit (3 times the standard deviation of 10                    markers
measurements of low-nutrient seawater), was 0.08 µmol L−1
for NO2 + NO3 (NOx ), 0.008 µmol L−1 for PO3+       4   and
0.05 µmol L−1 for Si(OH)4 . Analysis reproducibility was de-           Seawater samples (500 mL) were concentrated on deck us-
termined using MOOS 3 (PO3+                                            ing a Whatman GF/F (∼ 0.7 µm pore size) at low pressure
                                4 , NOx and Si(OH)4 ), VKI
                             3+                                        (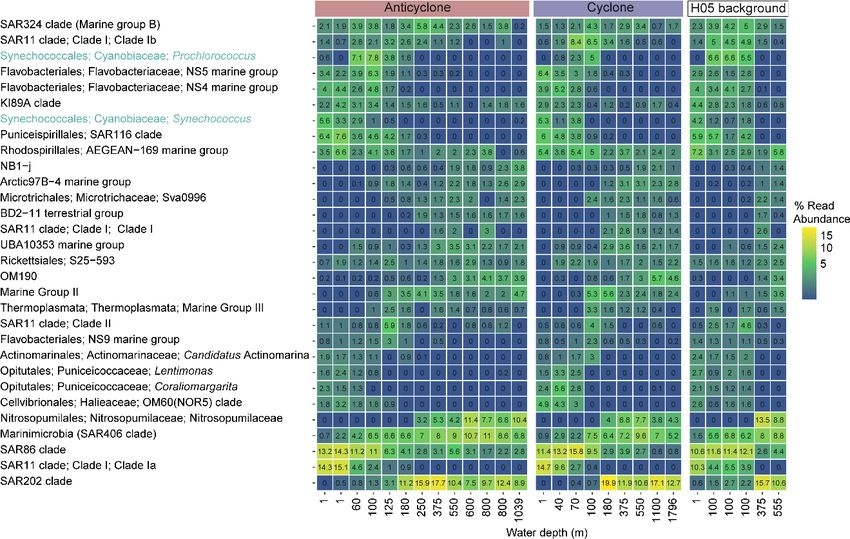
696                                                            N. Belkin et al.: Cyclone and anticyclone eddies affect plankton

8 L of seawater was concentrated on GF/Fs and kept frozen            low number of depths sampled at each station (n = 5–6), it is
at −20 ◦ C in aluminum foil until analysis. High-performance         possible that some peaks in PP (e.g., at the subsurface) may
liquid chromatography (HPLC) was used to identify and                have been overlooked, resulting in an underestimation of the
quantify the biomarker photosynthetic pigments concentra-            integrated values.
tions using a 40 min ethyl-acetate methanol gradient method
(Jeffrey et al., 1997). Pigments were extracted in 90 % ace-         2.7   Bacterial production (BP)
tone for 24 h in 4 ◦ C. The extracts were filtered through a
0.45 µm Teflon syringe filter and transferred into glass HPLC        Prokaryotic (bacteria and archaea) heterotrophic produc-
vials. The extracts (100 µL) were analyzed using an Agilent          tion (hereafter refer to as BP) was estimated using the 3 H-
1220 HPLC system equipped with a diode array and fluo-               leucine incorporation method (Perkin Elmer, specific activity
rescence detectors. Selected pigment standards (DHI Labs)            100 Ci mmol−1 ). Three replicates (1.7 mL each) from each
were used for verification of the spectra and retention times.       water depth were incubated in the dark (wrapped in alu-
                                                                     minum foil) with ∼ 10 nmol hot leucine L−1 for 4 h (Rahav
2.5   Pico-/nano-phytoplankton and heterotrophic                     et al., 2019). Control treatments in which surface water was
      prokaryotic abundance                                          immediately added with 100 µL of 100 % trichloroacetic acid
                                                                     (TCA, 4 ◦ C) along with 3 H-leucine were also carried out in
Samples (1.8 mL) were fixed with glutaraldehyde (final con-          triplicates. The incubations were terminated with TCA and
centration 0.02 % v : v, Sigma-Aldrich G7651), frozen in liq-        were later processed following the micro-centrifugation tech-
uid nitrogen, and later stored at −80 ◦ C until analysis within      nique (Smith et al., 1992) and added with 1 mL of scintilla-
1 week. The abundance of autotrophic pico- and nano-                 tion cocktail (Ultima-Gold). The samples were counted using
eukaryotes, Synechococcus and Prochlorococcus, and other             a TRI-CARB 2100 TR (Packard) liquid scintillation counter.
heterotrophic prokaryotes (bacteria and archaea) was deter-          A conversion factor of 1.5 kg C mol−1 per every mole leucine
mined using an Attune® Acoustic Focusing Flow Cytome-                incorporated was used (Simon et al., 1989).
ter (Applied Biosystems). Heterotrophic prokaryotes (here-           2.8   Zooplankton biomass
after refer to as heterotrophic bacteria, BA) were stained
with SYBR Green (Applied Biosystems). Total phytoplank-              Zooplankton samples were sieved through a 100 µm mesh
ton and microbial biomass was calculated according to Houl-          and halved into two subsamples using a plankton sample
brèque et al. (2006). Phytoplankton and microbial doubling           splitting box (Motoda, 1959). One subsample was kept at
time estimates were calculated by dividing the integrated            −20 ◦ C for biomass analysis and the second subsample was
phytoplankton biomass by integrated primary and bacterial            preserved in 99.8 % ethanol for molecular analysis (Harris
production, respectively (Kirchman, 2012).                           et al., 2000). In the lab, the collected samples were thawed
                                                                     and filtered using pre-combusted GF/C filters and weighed
2.6   Primary production (PP)                                        after drying in 60 ◦ C for 24 h to obtain dry weight (DW) and
                                                                     after 4 h in 500 ◦ C to measure ash weight and obtain carbon
Triplicate water samples (50 mL) were spiked upon sam-               content as ash-free dry weight (AFDW).
pling with 5 µCi of NaH14 CO3 (Perkin Elmer, specific activ-            The grazing impact of zooplankton on phytoplankton was
ity 56 mCi mmol−1 ) (Steemann-Nielsen, 1952). The samples            calculated as the relative portion of zooplankton carbon
were incubated for 24 h under in situ natural illumination and       biomass from the total pico-/nano-phytoplankton biomass
surface temperature in a flow-through tank on deck covered           (Feliú et al., 2020).
with a light screening mesh. The incubations were terminated
by filtering the spiked seawater through GF/F filters (What-         2.9   Zooplankton carbon and nutrient demand
man, 0.7 µm pore size) at low pressure (∼ 50 mmHg). Mea-                   estimates
surements for the added activity and dark controls were also
performed. The filters were placed overnight in 5 mL scin-           Zooplankton carbon demand (ZCD in mg C m−3 d−1 ) was
tillation vials containing 50 µL of 32 % hydrochloric acid to        calculated based on measured biomass and growth rate esti-
remove excess 14 C, after which 5 mL of scintillation cock-          mates (following the cross-Mediterranean estimates in Feliú
tail (Ultima-Gold) were added. Radioactivity was measured            et al., 2020):
using a TRI-CARB 2100 TR (Packard) liquid scintillation
                                                                     ZCD = Czoo × FR ,
counter.
    Note that the rates considered here only account for the         where Czoo is the carbon concentration of zooplankton
particulate PP and not the dissolved fraction, and therefore         (in mg C m−3 ) and FR is the food ratio, defined as the amount
the total PP may be underestimated (by an average of ∼ 20 %          of food consumed per unit of biomass per day (d−1 ), calcu-
in oligotrophic seas, Marañón et al., 2005). Yet we surmise          lated as
that if underestimation did occur, it was similar at all stations           gZ + r
sampled. Moreover, it is to be noted that due to the relatively      FR =          ,
                                                                              A

Ocean Sci., 18, 693–715, 2022                                                            https://doi.org/10.5194/os-18-693-2022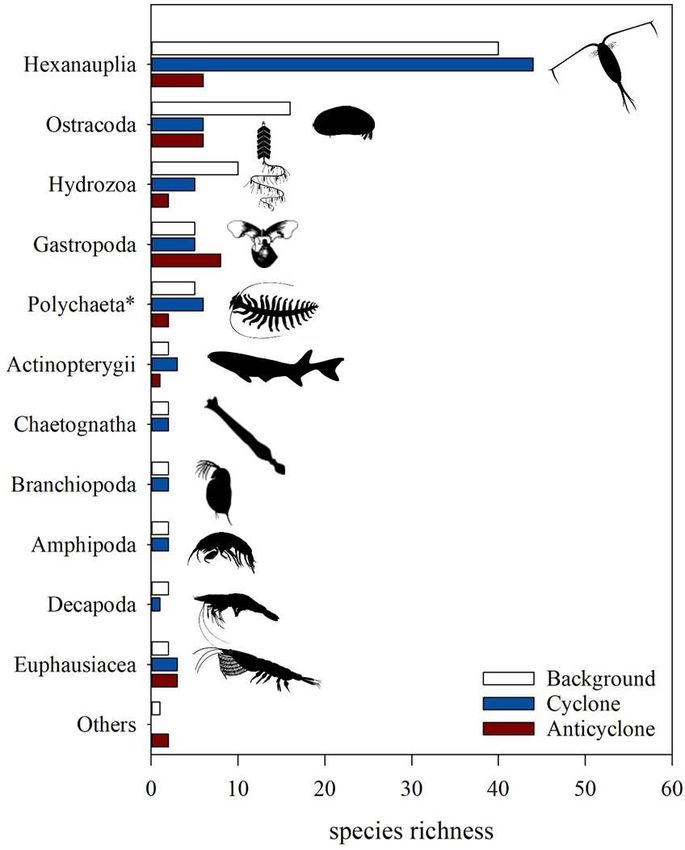
N. Belkin et al.: Cyclone and anticyclone eddies affect plankton                                                             697

where gZ is the growth rate, r is the weight specific respi-      Kit (Qiagen, USA), following the standard protocol includ-
ration and A is assimilation efficiency. r and A were set to      ing an extra heating step at 65 ◦ C for 10 min as recommended
0.16 d−1 following Alcaraz et al. (2007) and 0.7 following        by the manufacturer for samples containing algae. Ethanol-
Nival et al. (1975). gZ was calculated following Zhou et al.      preserved zooplankton samples were sieved using a 100 µm
(2010):                                                           Nitex sieve, washed with distilled water to remove ethanol
                                                                residuals, and homogenized by vigorous vortex and pipet-
                                        chl a                     ting. Genomic DNA was extracted using DNeasy Blood and
gZ (Czoo , T , chl a) = 0.033                         e0.09T
                                chl a + 205e−0.125T               Tissue Kit (Qiagen, USA) following the manufacturer’s in-
                        −0.06
                     × Wzoo   ,                                   structions.
                                                                     DNA was amplified with the following primer sets
where T is seawater temperature (average value for 0–300 m:       amended with CS1/CS2 tags: (i) the V4 region of the 16S
background 18.8 ◦ C, cyclone 17.8 ◦ C, anticyclone 20.0 ◦ C)      rRNA gene (ca. 300 bp), 515Fc/806Rc (Apprill et al., 2015;
and chl a is food availability (mg C m−3 ) estimated from the     Parada et al., 2016); (ii) the 18S rRNA gene (200–500 bp),
integrated chl a values. Wzoo is the average carbon concentra-    1391F, EukBr (Amaral-Zettler et al., 2009); and (iii) the mi-
tion per zooplankter, set to 0.01072 mg Cperindividual based      tochondrial cytochrome c oxidase I (COI) gene (ca. 300 bp),
on data collected from the background station in 2019–2020        mlCOIintF, jgHCO2198. Library preparation from the PCR
(Guy-Haim, unpublished data). Phytoplankton was regarded          products and sequencing of 2 × 250 bp Illumina MiSeq reads
as food following Calbet et al. (1996). ZCD was compared          were performed by HyLabs (Israel). The COI and 18S rRNA
to the phytoplankton stock and to primary production to esti-     gene amplicon reads were submitted to NCBI Sequence Read
mate the potential clearance of phytoplankton by zooplank-        Archive BioProject PRJNA667077.
ton.
   N and P excretion and oxygen consumption rates for an          2.11   Bioinformatic analyses of marker gene amplicons
average zooplankter with weight Wzoo were estimated using
the multiple regression model by Ikeda (1985) based on car-       Demultiplexed paired-end reads were processed in a QI-
bon weight and temperature:                                       IME2 V2020.6 environment (Bolyen et al., 2019). Reads
                                                                  were truncated based on quality plots, checked for chimeras,
ln Y = a0 + a1 ln Wzoo + a2 T ,                                   merged and grouped into amplicon sequence variants (ASVs)
                                                                  with DADA2 (Callahan et al., 2016), as implemented in QI-
where Y represents N or P excretion or oxygen uptake. a0 ,        IME2. The 16S and 18S rRNA amplicons were classified
a1 and a2 are constants specific to each metabolic process        with a scikit-learn classifier that was trained on the Silva
(respiration, ammonia and phosphate excretion). Total N and       138 database or BLAST against the Silva 138 database (0.9
P excretion were obtained by multiplying the obtained rate        minimum identity cutoff, performed best for the analyses of
with the zooplankton biomass measured at each station. Zoo-       18S gene amplicons of microbial zooplankton). COI ampli-
plankton’s contribution to nutrient regeneration (in %) was       cons were classified with BLAST (0.9 minimum identity cut-
estimated by comparison to primary production converted to        off) against the merged NCBI/BOLD database (Heller et al.,
N and P requirements. To this end, we used C : N : P ratios       2018), which was transformed into QIIME2 format. Down-
different than the “typical” Redfield 106 : 16 : 1 stoichiom-     stream statistical analyses, calculation of alpha diversity in-
etry as previously reported in the ultra-oligotrophic Levan-      dices (the richness estimator ACE, Abundance-based Cover-
tine Basin water (Pujo-Pay et al., 2011), where the particu-      age Estimator, and the biodiversity estimators Shannon and
late organic carbon (POC) to particulate nitrogen (PN) ratio      Simpson), beta diversity (non-metric multidimensional scal-
(POC : PN) is 5.4 : 1 (instead of ∼ 6.6 : 1) and POC : PP is      ing, NMDS, based on the Bray–Curtis dissimilarity) and
116 : 1 (instead of 106 : 1). Respiration was converted to res-   plotting were performed in R (R Core Team, 2018) using
piratory carbon lost assuming a respiratory quotient of 0.97      packages phyloseq (McMurdie and Holmes, 2013), ampvis2
following Ikeda et al. (2000) and used as a carbon require-       (Andersen et al., 2018) and ggplot2 (Wickham, 2011). Mito-
ment for zooplankton metabolism.                                  chondrial and chloroplast sequences were removed from the
                                                                  16S rRNA amplicon dataset, and the relative abundance of
2.10   Molecular diversity of microbial and zooplankton           microbial eukaryotes was estimated following the removal
       communities                                                of metazoan 18S rRNA sequences.

Seawater (8 L) was filtered using a peristaltic pump onto         2.12   Statistical analyses
Supor membrane filters (0.2 µm, 47 mm, PALL, USA) and
placed immediately in PowerWater DNA bead tubes (Qia-             Nutrients, pico-phytoplankton, heterotrophic bacteria, and
gen, USA), flash-frozen in liquid nitrogen and preserved at       primary and bacterial production were vertically integrated
−20 ◦ C (n = 1 per depth except in selected samples where         using the trapezoidal rule and compared between sampling
n = 2). DNA was extracted with the DNeasy PowerWater              locations (“background”, “anticyclonic eddy” and “cyclonic

https://doi.org/10.5194/os-18-693-2022                                                          Ocean Sci., 18, 693–715, 2022
698                                                         N. Belkin et al.: Cyclone and anticyclone eddies affect plankton

eddy”) using a one-way analysis of variance (ANOVA) and           potential density anomaly derived from a detailed glider mis-
a Fisher’s least significant difference (LSD) means com-          sion that occurred in the week following our cruise and shows
parison test (α = 0.05). Statistically significant differences    that the sampling stations were within the cores of the two
(p < 0.05) were labeled with different letters. DESeq2 (Love      distinct hydrologic discontinuities (Fig. 1c). The Levantine
et al., 2014) was used to evaluate the differential abundance     Intermediate Water (LIW), characterized by high salinity and
of bacterioplankton ASVs at the deep chlorophyll maximum          relatively warm temperatures, was evident at ∼ 70 m in the
(DCM). Note that the limited number of samples collected          upwelling cyclonic eddy, ∼ 130 m at the background station
in each hydrologic discontinuity per depth (n = 1–2), con-        and ∼ 170 m at the downwelling anticyclonic site (Fig. 1b).
trary to integrated calculations which pool four to six mea-      This means that at the core of the cyclone, the LIW mass was
surements from the upper 180 m, restricted our ability to run     uplifted to a relatively narrow layer (50–80 m; core at 75 m),
additional statistical comparisons between locations. We dis-     while in the core of anticyclone the LIW was much wider
cuss these caveats below and also compare our findings to         and deeper (80–240 m; core 175 m) due to the convergence
other relevant studies from the Mediterranean Sea (i.e., the      of currents (Fig. S3).
                                                                                                                     3+
BOUM and ISRALEV campaigns) and elsewhere (e.g., the                 NO−          −
                                                                         2 + NO3 (NOx ) and orthophosphate (PO4 ) concen-
eastern Indian Ocean, Waite et al., 2007) and compare our         trations were close to, or below, the detection limit of con-
nutrients and chl a profiles to a parallel cruise held at the     ventional analytical methods at all stations in the upper
same time as our study nearby (Fig. S1).                          100 m, while Si(OH)4 levels were always above the detection
                                                                  limit (Fig. 2a–c, Table S1 in the Supplement). Nevertheless,
                                                                  marked differences were observed in the integrated nutrient
3   Results                                                       values between sites in the photic layer (0–180 m), with 13-
                                                                  fold higher NOx , 2.5-fold higher PO3+  4 and 1.5-fold higher
The AMEDA algorithm shows a chain of cyclonic and an-             Si(OH)4 in the cyclonic eddy compared with the anticyclone
ticyclonic eddies at the SEMS (Fig. 1a). The stations were        (Table 1). Integrated N : P ratios at the background and an-
selected to sample the cores of the southern cyclonic and         ticyclone stations were lower than the Redfield ratio (15 : 1
anticyclonic eddies offshore the Israeli coast as well as         and 9 : 1, respectively), whereas in the cyclone the N : P ratio
background stations. The anticyclone, later identified in the     was higher (∼ 48 : 1) (Table 1). From 180 m and down to the
DYNED atlas as anticyclone no. 12683, was created from a          nutricline shoulder (∼ 400 m), all nutrient levels gradually
meander of the along-shore current in the southeastern cor-       increased. NOx , PO3+ 4 and Si(OH)4 were higher by 45 %,
ner of the basin in early August 2018, just 62 d prior to the     90 % and 100 % in the cyclonic eddy than the anticyclonic
cruise. It mixed warm water from the eastern sea margin           eddy, respectively (Fig. 2a–c, Table S1).
(Fig. S2A in the Supplement). The cyclonic eddy was cre-             Following the elevated nutrient levels, integrated chl a
ated in early February 2018, 246 d before the cruise. Later,      was highest in the cyclonic eddy and at background stations
when the DYNED atlas was extended to include 2018, it             (20.0–21.3 mg m−2 ) and lowest at the center of the ultra-
was identified as cyclonic eddy no. 11988, which was created      oligotrophic anticyclonic eddy (17.9 mg m−2 ) (Tables 1
more than a year earlier in mid-September 2017 (Fig. S2 in        and S1). The deep chlorophyll maximum (DCM) spread
the Supplement). It was split from cyclone no. 11310 located      from 90–120 m in the cyclonic eddy, while a smaller
south of Cyprus and migrated to the easternmost SEMS. Pro-        DCM shoulder was observed in the anticyclonic eddy
files of Argo floats (no. 6903221 and no. 6903222) local-         (∼ 90–120 m) and at the background (∼ 120–130 m) stations
ized within cyclone no. 11310 showed that it brought denser,      (Fig. 3a). Nonetheless, the cyclone had the highest chl a
colder and saltier water upwelled on the southern Cyprus          concentration among all stations (0.31 µg L−1 ), while the
coast (Fig. S2A). At the time it was sampled it is charac-        DCM in the anticyclonic eddy had a weaker chl a signal
terized as a cold-core cyclone, colder than its surrounding       (0.18 µg L−1 ) (Fig. 3a, Table S1). Synechococcus was mostly
waters (Fig. S2B in the Supplement).                              found in the surface water of all stations, whereas Prochloro-
   The sea surface temperature (SST) at the anticyclonic          coccus occupied the DCM depths (Fig. 3b and c). The highest
eddy and background stations was the warmest (∼ 28 ◦ C),          cell abundance of these cyanobacteria was found at the back-
while a lower temperature was recorded in the cyclonic eddy       ground station (69 × 1010 Synechococcus cells m−2 ) and in
(∼ 27 ◦ C) (Figs. 1b and S3 in the Supplement). Further, down     the anticyclone (270 × 1010 Prochlorococcus cells m−2 ),
to 550 m the highest water temperatures were recorded in          while the lowest abundances were found in the cy-
the anticyclonic eddy (a positive anomaly compared to the         clone        (∼ 27 × 1010 Synechococcus cells m−2           and
background), and the coldest temperatures were recorded                        10
                                                                  ∼ 160 × 10 Prochlorococcus cells m−2 ) (Tables 1 and S1).
in the cyclonic eddy (a negative anomaly). From ∼ 550 to          Cyanobacterial read abundance based on amplicon se-
1000 m depth the water temperature at all sampling stations       quencing supported these findings (Fig. 4). The dominant
was the same and constant (∼ 14 ◦ C) (Fig. S3). Surface salin-    bacterioplankton lineages in the photic zone included
ity ranged from 39.7 to 39.8 psu and decreased to 38.8 psu at     SAR86, Flavobacteriales, Punicespirillales, Rhodospirillales
550 m in all sampling sites (Figs. 1b and S3). The concurrent     and SAR11 (clade Ia) (Figs. 4 and S4). The abundance

Ocean Sci., 18, 693–715, 2022                                                         https://doi.org/10.5194/os-18-693-2022
N. Belkin et al.: Cyclone and anticyclone eddies affect plankton                                                                  699

Figure 2. Vertical profile of NOx (a), PO3+
                                          4 (b) and Si(OH)4 (c) in cyclonic (blue triangle) and anticyclonic (red square) eddies and an
uninfluenced background station (white circle) in the southeastern Mediterranean Sea during October 2018.

of pico- and nano-eukaryotic phytoplankton was higher                 rRNA amplicon analysis, we surmise that the presence of
at the cyclonic station (13.5 × 10¹⁰ cells m−2 ) than the             fucoxanthin was most likely attributed to prymnesiophytes.
other stations sampled (∼ 5.5 × 10¹⁰ cells m−2 ) (Tables 1            Although the most considered diagnostic marker for prym-
and S1). Pico-eukaryotes were mostly found in the surface             nesiophytes is 19-hexanoyloxyfucoxanthin, previous studies
water (top 50 m) and nano-eukaryotes were mostly found                showed that fucoxanthin can also be used as their marker
at the DCM depth (Fig. 3d and e). Correspondingly, total              in the absence of 19-hexanoyloxyfucoxanthin signals (An-
pico-phytoplankton biomass was highest in the cyclonic                sotegui et al., 2003).
eddy (597 mg C m−2 ), which is 1.6–1.7-fold higher than at               Following the higher nutrients levels and pico-
the background or anticyclonic stations (Tables 1 and S1).            phytoplankton biomass, PP was highest in the cyclone
The 18S rRNA amplicon analyses indicated that at the                  (191 mg C m−2 d−1 ) and significantly decreased by 50 %–
photic depths mainly non-diatom microbial eukaryotes                  80 % at the background (81 mg C m−2 d−1 ) and anticyclone
were dominant, such as dinoflagellates, Prymnesiophyceae              (36 mg C m−2 d−1 ) stations (Tables 1 and S1). The highest
and Ochrophyta (Figs. 5 and S5). Overall, the pico- and               PP rates were found in the surface water of all stations
nano-eukaryotic populations were more diverse in the photic           (∼ 0.8–2.0 µg C L−1 d−1 ) and decreased with depth through-
zone than in the deep waters, yet no major differences                out the photic layer (Fig. 3f). The differences in the
in alpha diversity parameters were observed between the               vertical distribution of chl a and PP were also evident in
stations (Fig. S6).                                                   the assimilation number of phytoplankton, which signifies
   Algal pigment analysis in the cyclone showed that the              autotrophically specific activity (PP per chl-a). The assimila-
photosynthetic auxiliary pigments were mostly comprised               tion number was highest in the cyclone (10 g C g chl a−1 d−1 )
of fucoxanthin (109 ng L−1 ) – a pigment marker of di-                and lower by 60 %–80 % at the anticyclone and background
atoms, chrysophytes and some prymnesiophytes – and zeax-              stations (2–4 g C g chl a−1 d−1 ) (Tables 1 and S1). Integrated
anthin (74 ng L−1 ) – a pigment marker for green algae and            doubling times of pico-/nano-phytoplankton were highest
cyanobacteria (Fig. S7). At the anticyclonic eddy, fucox-             at the anticyclone (9.7 d) and lowest in the cyclone (3.1 d)
anthin was also detected at the DCM; however, its con-                (Table 1).
centration was lower by ∼ 40 % (∼ 65 ng L−1 ), while the                 Total BA was higher by 1–2 orders of magnitude
zeaxanthin concentration was slightly lower (∼ 64 ng L−1 )            than the pico-phytoplankton abundance (Fig. 6a, Ta-
(Fig. S7). As very few diatoms were detected by the 18S               ble S1). The highest BA was measured at the anti-

https://doi.org/10.5194/os-18-693-2022                                                               Ocean Sci., 18, 693–715, 2022
700                                                          N. Belkin et al.: Cyclone and anticyclone eddies affect plankton

Table 1. Chemical and biological integrated values at the upper 180 m (except zooplankton where 0–300 m is presented) measured at the
different sampling sites. The maximal values for each variable are highlighted in bold.

                    Variable                                              Background      Cyclone    Anticyclone
                    NOx (mmol m−2 )                                               35.5      121.2             9
                    PO3+
                       4 (mmol m )
                                   −2                                               2.4       2.5             1
                    N:P                                                             15         48             9
                    Si(OH)4 (mmol m−2 )                                         150.2       200.7         133.3
                    Chl a (mg m−2 )                                              21.3          20          17.9
                    Synechococcus (× 1010 cells m−2 )                               69         27            54
                    Prochlorococcus (× 1010 cells m−2 )                            231       163            273
                    Pico-eukaryotes (× 1010 cells m−2 )                            1.7        7.2           2.3
                    Nano-eukaryotes (× 1010 cells m−2 )                            3.3        6.3             3
                    Total pico-/nano-phytoplankton biomass (mg C m−2 )            369         597           348
                    Heterotrophic bacteria (× 1010 cells m−2 )                   1459       2072          2125
                    Heterotrophic bacteria biomass (mg C m−2 )                    204         290           298
                    Zooplankton biomass (mg DW m−2 )                              360       3045            303
                    Zooplankton biomass (mg C m−2 )                               112       1337            133
                    Grazing impact on phytoplankton stock (%)                        30       224            38
                    PP (mg C m−2 d−1 )                                               81       191            36
                    Assimilation number (g C g chl a−1 d−1 )                          4        10             2
                    Phytoplankton doubling time (d)                                 4.6        3.1          9.7
                    BP (mg C m−2 d−1 )                                               82       214            85
                    Heterotrophic bacteria doubling time (d)                        2.5        1.4          3.5
                    BP/BA (fg C cell−1 d−1 )                                        5.7      10.3           4.0
                    BP/PP                                                           1.0        1.1          2.4
                    Zooplankton carbon demand (mg C m−2 d−1 )                     34.3      387.9          41.8
                    Grazing impact on PP (%)                                         42       203           116
                    Zooplankton respiration (mg C m−2 d−1 )                       14.8      166.2          18.9
                    % of PP respired by zooplankton                                  18        87            53
                    Zooplankton excretion (mg N-NH4 m−2 d−1 )                      2.2         25           2.9
                    Phytoplankton N demand (mg N m−2 d−1 )                           17        41             8
                    % contribution of zooplankton N to PP                            13        61            37
                    Zooplankton excretion (mg P-PO4 m−2 d−1 )                      0.3        3.6           0.4
                    Phytoplankton P demand (mg P m−2 d−1 )                          1.8       4.2           0.8
                    % contribution of zooplankton P to PP                            17        85            50

cyclone (2125 × 1010 cells m−2 ) followed by the cy-                 cyclone (∼ 1) and was 2-fold higher inside it (Table 1). In
clonic eddy (2072 × 1010 cells m−2 ) and background                  accordance with the high BP, the integrated doubling time of
(1459 × 1010 cells m−2 ) stations (Table 1). Contrary to             heterotrophic bacteria was highest in the anticyclone (3.5 d)
the BA or biomass, BP was significantly higher at the                and lowest in the cyclone (1.4 d) (Table 1).
cyclone (214 mg C m−2 d−1 ) compared to the anticyclone                 The slope of the log–log linear regressions for BA and BP
and background stations (82–85 mg C m−2 d−1 ) (Table 1).             obtained in the cyclonic eddy was 0.24 (R 2 = 0.60), while
A similar trend was measured in heterotrophic bacteria               in the anticyclonic eddy the slope was more than twice as
cell-specific activity (BP/BA), where the most productive            high: 0.52 (R 2 = 0.79) (P = 0.03, analysis of covariance,
cells were found in the cyclone (10 fg C cell−1 d−1 ), while         ANCOVA; Andrade and Estévez-Pérez, 2014).
the least productive cells were found in the anticyclone                In accordance with the high PP and BP, total zooplankton
(4 fg C cell−1 d−1 ) (Tables 1 and S1). Overall, BP was              biomass in the upper 300 m was an order of magnitude higher
homogeneously distributed throughout the photic layer at             in the cyclonic eddy (3045 mg DW m−2 , 1337 mg C m−2 )
all stations (∼ 0.2–0.9 µg C L−1 d−1 ), except the cyclonic          compared with the anticyclonic (303 mg DW m−2 ,
eddy where the rates were relatively high in the upper 100 m         133 mg C m−2 )      or    background        (360 mg DW m−2 ,
(∼ 0.8–2.4 µg C L−1 d−1 ) (Fig. 6b). At 180 m, BP rates              112 mg C m−2 ) stations (Tables 1 and S1). Zooplankton
were similar at all stations (∼ 0.1 µg C L−1 d−1 ) (Fig. 6b).        grazing impact on phytoplankton stock estimates shows
The resulting BP/PP ratio was overall similar outside the            that mesozooplankton consumed 30 %–38 % of the daily

Ocean Sci., 18, 693–715, 2022                                                             https://doi.org/10.5194/os-18-693-2022
N. Belkin et al.: Cyclone and anticyclone eddies affect plankton 701 Figure 3. Vertical profile of chlorophyll a (a), Synechococcus (b), Prochlorococcus (c), pico-eukaryotes (d), nano-eukaryotes (e) and primary production rate (f) in the photic layer of cyclonic (blue triangle) and anticyclonic (red square) eddies and an uninfluenced background station (white circle) at the southeastern Mediterranean Sea during October 2018. phytoplankton stock at the anticyclone and background the cyclonic eddy, 116 % in the anticyclonic eddy and only stations and 224 % in the cyclone (Table 1). Similarly 42 % at the background station (Tables 1 and S1). Zooplank- to zooplankton biomass, the estimated zooplankton car- ton respiration rates were 9–11-fold larger in the cyclone bon demand (ZCD) was highest in the cyclonic eddy (∼ 166 mg C m−2 d−1 ) than at the anticyclone and back- (∼ 388 mg C m−2 d−1 ) and decreased by an order of mag- ground stations (∼ 15–19 mg C m−2 d−1 ), corresponding to nitude at the anticyclonic eddy (∼ 42 mg C m−2 d−1 ) and 87 % vs. 18 %–53 % of the integrated PP (Tables 1 and S1). the background (∼ 34 mg C m−2 d−1 ) stations (Tables 1 The estimated contribution of zooplankton to nitrogen regen- and S1). Considering phytoplankton as the major food eration by excretion of ammonium was 9–11-fold greater in source, zooplankton potentially consumed 203 % of PP in the cyclone (25 mg N-NH4 m−2 d−1 ) than in the anticyclone https://doi.org/10.5194/os-18-693-2022 Ocean Sci., 18, 693–715, 2022
702                                                            N. Belkin et al.: Cyclone and anticyclone eddies affect plankton

Figure 4. The relative abundance of the 30 most abundant bacterial and archaeal genera collected in cyclonic and anticyclonic eddies and
an uninfluenced background station in the southeastern Mediterranean Sea during October 2018, as estimated by read abundance. Results of
replicate casts at anticyclone and uninfluenced background (H05) stations are shown in columns with identical depths.

or the background stations (∼ 2–3 mg N-NH4 m−2 d−1 ),                    Classification to species level was successful in 211 out of
corresponding to 61 % vs. 13 %–37 % of the integrated PP              221 COI ASVs and in only 55 out of 830 18S ASVs, 200 of
(based on a C : N 5.4 : 1 ratio, Pujo-Pay et al., 2011) for           which were classified to an order level. The three stations dif-
the Levantine Basin water (Tables 1 and S1). The estimated            fered in the zooplankton relative richness (i.e., the number of
contribution of zooplankton to phosphorus (as orthophos-              ASVs per taxonomical functional group) (Fig. 8). Overall, at
phate) by excretion was an order of magnitude greater in              all stations, copepods (Hexanauplia) were the most diverse
the cyclone (3.6 mg P-PO4 m−2 d−1 ) than at the anticyclone           group; nevertheless, copepod richness was 7-fold larger in
and background stations (0.3–0.4 mg P-PO4 m−2 d−1 ), corre-           the cyclone vs. the anticyclone. Ostracods and hydrozoans
sponding to 85 % vs. 17 %–50 % of the integrated PP (based            (mainly siphonophores) had a higher diversity at the back-
on a C : P 116 : 1 ratio, Pujo-Pay et al., 2011) (Tables 1            ground station than at the other stations. Chaetognaths, bran-
and S1).                                                              chiopods (cladocerans), planktonic decapods and amphipods
   Zooplankton alpha diversity estimated based on the COI             had similar richness levels at the cyclonic eddy and back-
and 18S rDNA genes read abundance as well as on cell abun-            ground stations; however, they were completely absent in
dance (i.e., microscopic identification) was highest at the cy-       the anticyclone. In contrast, a higher richness of gastropods
clone and background stations and lowest in the anticyclone           (mainly pteropods) was found in the anticyclone compared to
(Fig. 7). COI and 18S ASV richness (ACE index) were low-              the cyclone and background stations. Although the majority
est in the anticyclone (29 and 81, respectively) and 60 %             of the taxonomic groups was better represented by COI clas-
(18S) to 250 % (COI) larger at the cyclone and background             sification, one group – Polychaeta – was better represented in
stations (Fig. 7). The lowest zooplankton biodiversity (Shan-         the 18S rRNA (2 versus 12 ASVs), as 18S is more often used
non and Simpson indices) was found in the anticyclone, us-            to obtain resolved phylogenies in polychaetes (Colgan et al.,
ing both genes (Fig. 7). These findings were confirmed with           2006). Based on the 18S rRNA gene ASVs, the highest rich-
rarefaction curves (Figs. S8 and S9 in the Supplement).               ness of polychaetes was found at the cyclone (6 ASVs) and

Ocean Sci., 18, 693–715, 2022                                                               https://doi.org/10.5194/os-18-693-2022
N. Belkin et al.: Cyclone and anticyclone eddies affect plankton                                                                       703

Figure 5. The relative abundance of the 20 most abundant unicellular eukaryotic lineages (phylum level), collected in cyclonic and anticy-
clonic eddies and at an uninfluenced background station (H05) in the southeastern Mediterranean Sea during October 2018, as estimated by
read abundance. Results of replicate casts at anticyclone and control H05 stations are shown.

Figure 6. Vertical profile of heterotrophic bacterial abundance (a) and bacterial production rates (b) in the photic layer of cyclonic (blue
triangle) and anticyclonic (red square) eddies and an uninfluenced background station (white circle) in the southeastern Mediterranean Sea
during October 2018.

background (5 ASVs) stations, whereas only 2 ASVs were                  4   Discussion
found in the anticyclone.
                                                                        Seasonality is the primary driver affecting water column
                                                                        characteristics in the SEMS, where external inputs of nutri-
                                                                        ents such as from the atmosphere (Herut et al., 2002, 2005;
                                                                        Ridame et al., 2011) or large rivers (Ludwig et al., 2009)

https://doi.org/10.5194/os-18-693-2022                                                                   Ocean Sci., 18, 693–715, 2022
704 N. Belkin et al.: Cyclone and anticyclone eddies affect plankton Figure 7. Zooplankton alpha diversity indices (ACE ± SE, Shannon, Simpson) based on 18S (green) and COI (yellow) amplicon sequencing in > 100 µm samples collected from the upper 300 m of cyclonic and anticyclonic eddies and at an uninfluenced background station in the southeastern Mediterranean Sea during October 2018. are limited in space and time. Thus, the one-dimensional and anticyclones more challenging in the SEMS as they are processes of summer stratification and winter mixing deter- not circulating (and thus isolated) for the same time. We sam- mine, to a large extent, the nutrient availability in the photic pled a recent anticyclone (no. 12683, 2 months old) and a layer (< 180 m), subsequently affecting phytoplankton pop- more “mature” cyclone (no. 11988, over 1 year old), which ulation dynamics and activity (Van-Ruth et al., 2020). How- is not the usual scenario in the SEMS. The short-lived anti- ever, horizontal variability plays an important role. Turbu- cyclone and the background station do indeed have similar lent mesoscale eddies are a prominent part of the circula- characteristics. We expect long-lived anticyclones to be even tion in the SEMS (Mkhinini et al., 2014). Such features have more oligotrophic, making their influence more prominent, lifetimes of a few months to a year (Mkhinini et al., 2014), as discussed below. affecting the availability of the nutrients to phytoplankton and bacteria in the photic layer (Rahav et al., 2013; Vaillan- 4.1 Pico-phytoplankton dynamics and primary court et al., 2003) and thus to higher trophic levels (Dolan production in anticyclonic and cyclonic waters et al., 2002; Siokou-Frangou, 2004). The degree to which an eddy affects the community depends on the eddy’s size, Our results show that nutrient availability affected the age, the source of the water “trapped” within it, and the in- pico-phytoplankton dynamics in the SEMS. The low pico- teraction with wind and land (Gaube et al., 2014; Huggett, eukaryote biomass and the low N : P in the anticyclonic eddy 2014; Landry et al., 2008a; Strzelecki et al., 2007). Our re- (∼ 9 : 1) suggest N limitation for these autotrophs under ex- sults demonstrate that upwelling within the cyclone injected treme oligotrophic conditions (Table 1). By contrast, the high deeper-water nutrients into the quasi-permanent eddy, thus N : P ratio (∼ 48 : 1) and the relatively low cyanobacterial fertilizing the planktonic population. biomass in the cyclonic eddy suggest that Synechococcus The effect of hydrodynamic structures on planktonic mi- and Prochlorococcus are P-limited. These results are simi- crobial distribution has been studied previously in the SEMS. lar to a previous study from the SEMS showing that NOx However, these studies focused on long-lived anticyclonic concentrations at the Rhodes Gyre (upwelling) were 5-fold eddies such as the Cyprus/Shikmona Eddy (>6 months, higher than in the Cyprus Eddy (downwelling), while PO3+ 4 Christaki et al., 2011; Rahav et al., 2013; Thingstad et al., remained similarly low for the two locations (Rahav et al., 2005). There is a strong asymmetry in an eddy’s lifetime, 2013). These variations result in significant differences in which on average is far shorter for cyclones than anticy- the NOx : PO3+ 4 ratio of the two systems, the Rhodes Gyre clones. This asymmetry is enhanced in the SEMS where (∼ 50 : 1) and the Cyprus Eddy (∼ 10 : 1), implying simi- the cyclone lifetime distribution is very similar to the rest lar nutrient limitations as discussed above. The stoichiomet- of the Mediterranean Sea, yet the anticyclones live longer ric N : P Redfield ratio alone, however, cannot fully explain (Mkhinini et al., 2014). It makes the comparison of cyclones which nutrients limit the microbial plankton diversity. Some Ocean Sci., 18, 693–715, 2022 https://doi.org/10.5194/os-18-693-2022
N. Belkin et al.: Cyclone and anticyclone eddies affect plankton                                                                705

                                                                    may be driven by several factors such as nutrient availabil-
                                                                    ity (Kress et al., 2005), light levels (Dishon et al., 2012;
                                                                    Sathyendranath and Platt, 2007; Stambler, 2012), viral infec-
                                                                    tion (Guixa-Boixereu et al., 1999b, a) and top–down graz-
                                                                    ing by zooplankton (Griffin and Rippingale, 2001; Olli et al.,
                                                                    2007; Rakhesh et al., 2008). We surmise that the overall low
                                                                    PP was mainly driven by the N and P standing stocks in the
                                                                    photic layer, including the cyclone (Table 1). This is because
                                                                    light levels were similar at all stations and therefore unlikely
                                                                    to affect the daily PP rates between sites. Moreover, viral-
                                                                    induced mortality was shown to be less important than mor-
                                                                    tality due to grazing by protists in the SEMS as has been
                                                                    shown in unamended eastern Mediterranean surface water in
                                                                    mesocosms (Tsiola et al., 2017). By contrast, the grazing im-
                                                                    pact on phytoplankton was significantly higher in the cyclone
                                                                    compared to the other more oligotrophic sites (∼ 200 % vs.
                                                                    ∼ 40 %–100 %, respectively, Table 1). Despite the potentially
                                                                    high grazing pressure in the cyclone, higher phytoplankton
                                                                    biomass and PP were measured at this upwelling site. These
                                                                    differences between sites are likely attributed to the differ-
                                                                    ent phytoplankton growth rates, as phytoplankton’s doubling
                                                                    time at the cyclone was ∼ 3 d, while 5–10 d was estimated
                                                                    at the anticyclone and background stations. These doubling
                                                                    time estimates are in the same order as reported in other ma-
                                                                    rine environments, ranging from ∼ 1 d (reviewed in Laws
Figure 8. Zooplankton species richness based on COI ampli-
                                                                    2013) to 10 d (Dyhrman et al., 2012), and are in agreement
con sequences (classified using a BOLD/NCBI-based database)         with recent estimates from the central and western Mediter-
in > 100 µm samples collected from the upper 300 m of cyclonic      ranean Sea (Marañón et al., 2021). We note that doubling
and anticyclonic eddies and at an uninfluenced background station   time estimates have many caveats, mostly because some phy-
in the southeastern Mediterranean Sea during October 2018. Poly-    toplankton or bacteria comprise an unknown fraction of the
chaeta richness was obtained from rRNA 18S amplicon sequences.      POC pool, and it is a methodological challenge to sepa-
                                                                    rate them from all other particles in the water (Laws, 2013).
                                                                    Moreover, the grazing impact on PP calculated from meso-
phytoplankton species have nutritional requirements differ-         zooplankton biomass alone may lead to an overestimation of
ent than N : P = 16, and there are several “non-Redfield” pro-      the top–down impact on autotrophic microbial populations
cesses in the aquatic ecosystem which may alter the N : P ra-       (Feliú et al., 2020). Therefore, it is likely that we overesti-
tio, regardless of any nutrient limitation (Arrigo, 2005; Gei-      mated the grazing impacts on PP, which exceeded 100 % in
der and La Roche, 2002; Moore et al., 2013).                        the cyclone (Table 1). Some mesozooplankton species can
   The integrated chl a content at the background, the anticy-      simultaneously graze both phytoplankton and heterotrophic
clone and the cyclonic stations exhibited overall low variabil-     prey (i.e., heterotrophic dinoflagellates and ciliates, Dolan
ity (∼ 18–21 mg chl a m−2 ), yet the integrated primary pro-        et al., 2002; Sherr and Sherr, 2007). Such a “multivorous”
duction in the cyclone was ∼ 5 times higher, resulting in a         feeding strategy may explain the > 100 % mesozooplankton
higher assimilation number. This high assimilation number           grazing impact on PP in the cyclone (Gasol et al., 1997).
indicates a better efficiency of carbon incorporation per chl a     Moreover, the high estimated contribution of N and P by zoo-
unit and thus a better algal physiological state in the cyclone     plankton to the PP by excretion in the cyclone (61 %–85 %,
relative to that of other stations considered. This is likely ow-   Table 1) suggests rapid nutrient recycling that fuels the high
ing to the higher nutrient availability (i.e., N and P) in the      production at this site. By contrast, at the anticyclone and
cyclone relative to the other more oligotrophic sites sampled       background stations a lower N and P excretion by zooplank-
(Table 1). It may also suggest different community composi-         ton was estimated (Table 1), therefore supporting only a mi-
tions and cell sizes.                                               nor part of the PP.
   The overall low PP outside the cyclone (Fig. 3f, Ta-
ble 1) is in accordance with another low-nutrient low-chl a
(LNLC) system (Falkowski et al., 2003; Lomas et al., 2013)
and aligned with the threshold limit of oligotrophic oceans:
706 N. Belkin et al.: Cyclone and anticyclone eddies affect plankton
4.2 Heterotrophic bacterial abundance and production inforce this issue, as we did not measure respiration rates.
in anticyclonic and cyclonic waters of the SEMS Community respiration rate measurements, although techni-
cally challenging, are needed, especially in light of the future
Prokaryotic microorganisms are important components of climate-change predictions stating the oceans will become
the marine food web, playing a pivotal role in many biogeo- more heterotrophic (Duarte et al., 2013).
chemical cycles (e.g., Kirchman, 2012). In warm and olig- The slope of the log–log linear regressions for BA (as
otrophic environments, such as the SEMS, heterotrophic bac- biomass) and BP (a proxy of resource availability) suggest
terial metabolism is often equal to or even higher than au- that bacterioplankton were bottom–up regulated in the an-
totrophic activity (Luna et al., 2012; Pulido-Villena et al., ticyclone and top–down regulated in the cyclone (Billen
2012; Rahav et al., 2019). Our results show that while the et al., 1990; Ducklow, 1992; Pulido-Villena et al., 2012), in
abundance of heterotrophs was overall similar in the cyclone agreement with the estimated growth rates calculated above
and anticyclone, their cell-specific activity was nearly 3-fold (Sect. 4.2). These values concur with other studies from
higher in the nutrient-richer cyclone (Table 1). Given that Mediterranean offshore water where the log–log regression
average bacteria contain 14 fg C per cell (Gundersen et al., of BA vs. BP is usually ∼ 0.40 (Ducklow, 1992; Mével et al.,
2002), our estimate of bacterial cell-specific activity suggests 2008; Zohary and Robarts, 1998). Top–down and bottom–
that heterotroph doubling time in the cyclone is ∼ 2 times up factors are constantly changing in oligotrophic environ-
faster than at the less productive anticyclone and background ments where organic-matter flux is sporadic rather than con-
stations (Table 1). The differences in cell-specific activity tinuous and where PP and grazing pressure may vary greatly
and corresponding doubling time between sites are likely on a temporal scale (Pulido-Villena et al., 2012). Understand-
supported by the supplementation of limiting nutrients for ing the feedback mechanisms controlling heterotrophic bac-
heterotrophic bacteria. Previous studies showed that P and terial abundance and production in LNLC environments is of
/or dissolved organic carbon (DOC) are the limiting factors great ecological importance, especially in areas such as the
for heterotrophic microbial activity in the SEMS (Pitta et al., Mediterranean Sea where the water column is rapidly warm-
2017; Rahav et al., 2019, 2021). We hypothesize that in the ing and thus heterotrophic metabolism is likely to be more
cyclone heterotrophic bacteria are likely DOC- rather than dominant (Luna et al., 2012; Rahav et al., 2019).
P-limited since the PO3+ 4 concentrations at this location were
∼ 3-fold higher than in the other locations (Table 1). The high 4.3 Zooplankton biomass, estimated carbon and
mesozooplankton excretion in the cyclone may add DOC and nutrient demand
inorganic nutrients, which could partly fulfill the metabolic
requirements of the heterotrophic bacteria. By contrast, at the Our results show that zooplankton biomass was 1 order of
background and anticyclone stations heterotrophic prokary- magnitude higher in the more productive cyclone than in
otes were likely P-limited, as previously demonstrated in an the anticyclone and background stations. This is in line with
onboard microcosm experiments (Rahav et al., 2021; Zohary previous studies (Goldthwait and Steinberg, 2008; Landry
et al., 2005) and using indirect N : P stoichiometric mass bal- et al., 2008b; Liu et al., 2020; Riandey et al., 2005; includ-
ance calculations (Krom et al., 2005). ing the Levantine Basin Mazzocchi et al., 1997; Pancucci-
The ratio between BP and PP is commonly used as an in- Papadopoulou et al., 1992), which showed that higher pro-
dicator for the carbon flux derived from photosynthesis chan- ductivity (either as PP or chl a levels) in cyclonic eddies
neled through the microbial heterotrophic food web (Cole leads to higher zooplankton biomass. Zooplankton biomass
et al., 1988). The higher the ratio, the lower the amount of reflected the higher PP in the photic layer rather than the
carbon available for export through herbivorous food webs. standing stock of the primary producers, possibly due to the
Here, the BP rates were 2 times higher than PP in the LNLC higher estimated grazing impact on phytoplankton stock at
anticyclone (Table 1), suggesting that microbial heterotrophs the cyclone vs. the anticyclone and background stations (Ta-
outcompeted phytoplankton for most of the available nutri- ble 1). A recent study from the central and western Mediter-
ents. The equal BP and PP at the background and the cyclone ranean Sea demonstrated that the nutrient diffusive fluxes
stations demonstrate an imbalanced microbial metabolism, across the nutricline contribute only a minor fraction of the
highlighting the importance of heterotrophy in SEMS. Pre- phytoplankton N and P requirements in the deep photic layer
vious studies from the anticyclonic Cyprus Eddy (Thingstad (Marañón et al., 2021). This suggests that generally phyto-
et al., 2005) and throughout the Mediterranean Sea (Rahav plankton depend on regenerated nutrients for growth rather
et al., 2021) suggested that heterotrophic bacteria may out- than their supply from the nutricline in the SEMS.
compete phytoplankton or diazotrophs for PO3+ 4 . This is in The estimated integrated contribution of zooplankton to
contrast to most oceanic regimes, in which BP : PP < 1 in carbon turnover and nutrient remineralization was markedly
the photic layer (e.g., Lomas et al., 2013). We note that some higher in the cyclone than at the anticyclone and back-
studies suggest that a net heterotrophy in a given system is ground stations. Since the dietary needs of some zooplank-
biased due to an underestimate of PP and/or an overesti- tonic species diverge from the Redfield ratio (Arrigo, 2005;
mate of respiration rate. We currently cannot refute nor re- Geider and La Roche, 2002; Moore et al., 2013), our esti-
Ocean Sci., 18, 693–715, 2022 https://doi.org/10.5194/os-18-693-2022You can also read