INCA Guidance Document 03 Wind Load Design Considerations for EWI Systems - September 2021
←
→
Page content transcription
If your browser does not render page correctly, please read the page content below

INCA Guidance Document 03

Wind Load Design Considerations for EWI Systems

                           September 2021
INCA Technical Guidance Document 03

September 2021
                                Wind Load Design Considerations for EWI Systems

Apart from self-weight, wind loads on cladded structures are the most significant loading that a façade
is likely to have to withstand. Action by high winds can impose both positive and negative pressures on
a façade. Generally, negative suction pressures create the most onerous conditions by ‘pulling’ the
system from the wall. This guide contains sample wind load calculations and examines the effect of the
results on the design of EWI systems.

The Regulations, Standards and other references given in this document are believed to be correct at
the time of issue. These documents remain subject to regular review, amendments, and updates. Whilst
INCA will endeavor to review the status of the document, the reader is advised to check the validity and
that they reference the latest versions and Regulations.

© INCA Ltd 2021 all rights reserved

                                                                                                       2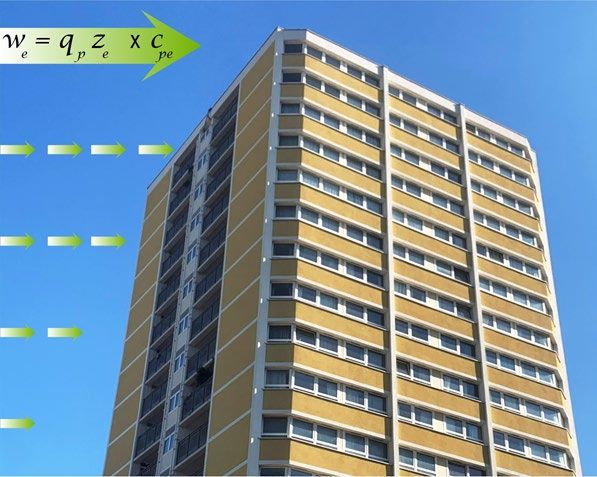
Table of Contents

                                                                    Page

Executive Summary                                                   4

Modes of Failure                                                    6

Appendix 1: Example Calculation                                     9

Building Parameters                                                 10

Site Location                                                       11

Building Geometry                                                   12

Wind Loading                                                        13

Anchor Design Resistance Assessment (Mechanical Fix)                17

Extract from Annex D of ETAG 014                                    18

Product Assessment – Assumptions and Recommendations                19

Design Methods for Anchorages                                       19

Method A (Using ETA Approved Fixings into Standard Substrate)       19

Method B (Site Testing)                                             20

Pull Through Capacities                                             21

Mechanical Fix – System Design Wind Resistance                      22

Adhesive Fix Comparison                                             22

Extract from ETAG 004                                               23

Appendix 2: Extract from Typical Fixing ETA Report                  24

Appendix 3: Example of Fixing Test Report                           26

Acknowledgements                                                    28

                                                                3
Executive Summary

The actual pressures exerted on a building by wind are dependent on many factors
including the localised wind speed, the location, and other building specific conditions
listed below. Open countryside and coastal regions are likely to be more exposed
giving rise to higher wind speeds and therefore higher forces on the structure.

Factors affecting wind loads:
   • Building location
   • Height above sea level
   • Building shape and height
   • Topography local to the building
   • Surface texture of building
   • Permeability of the building (openings)
   • Height, shape and proximity of adjacent buildings (existing or planned)

The forces created by wind on a building are very dependent upon the wind direction
and the orientation of the building to the wind. Designers should therefore be mindful
of the prevailing wind direction for a given site and how they might optimise the
building performance by orientating the building accordingly.

High winds are often associated with high buildings, whereas the reality is high wind
loads can also be experienced on low rise construction. Tall buildings interrupt air
flow at high level, which accelerates as it is forced down towards the ground. This
has the effect of increased loads at both higher altitude and ground level. Similarly,
where buildings are very close together, the venturi effect (as the wind is
compressed) results in very high localised wind speeds and associated high
pressures. This effect is known as funnelling and the potential for this effect to occur
should be carefully considered on each site.

Like most weather-related issues, it is clear that the prediction of wind forces and
their effect on a building is not straightforward nor is it an exact science. Accurate
prediction is most likely to be obtained by scale modelling of the building, surrounding
buildings and local topography, in a wind tunnel. Whilst this may yield the most
reliable results on which to base design, it is time consuming and expensive,
therefore likely to be the preserve of only the most prestigious or demanding projects.
In practice, most projects will rely on theoretical calculations in accordance with
agreed formulae and national / European standards. The relevant standard is now BS
EN 1991-1-4:2005, which replaces BS 6399 Pt 2. It is usual that the calculation is
carried out by a qualified structural engineer.

The calculation relies upon the input of site / building specific data, wind speed and
other standard coefficients to account for variables such as building permeability.
Wind behaves similarly to fluid materials in that it creates eddies and currents, which
form both positive and negative pressures on the building as it passes through, over

                                                                                           4
and around the building sides. The variability of wind action on the surfaces of the
building result in different forces across the building and hence the need to output
results in dimensioned ‘zones’, which define the magnitude of the load and the extent
of the zone. It is normal to use computer software for calculation as ‘worst case’
conditions require several iterations of the calculation in all wind directions. A typical
wind loading calculation example is included in this guide at Appendix 1.

External wall insulation (EWI) systems are typically connected using two fixing types:
mechanical (using screws, dowels, rails or specialist insulation fixing units) or
adhesive (normally with a proprietary cement-based adhesive). It is the fixing
primarily that needs to be checked against failure under wind loading, although the
inherent strength of the insulation may also need checking. When using screw or
dowel fixings, the failure against ‘pull-out’ from the substrate as well as ‘pull-over’ of
the fixing needs to be checked. As with standard engineering design principles, some
‘extra’ allowance has to be made so that systems do not fail under normally applied
loads. This is achieved by applying factors of safety into the design which ensures
that systems have sufficient ultimate strength to withstand the worst calculated wind
load with a comfortable factor of safety.

Ventilated cavities behind insulation systems can create additional problems and
consideration must be given to the combination of forces applied (suction on the front
face combined with positive pressure) if air is able to enter the cavity from behind the
insulation. This combined scenario may result in much higher load demands on the
system. The cavity may also allow further movement of the system as it is buffeted
under wind gusts. The consequence of this movement should be considered,
particularly against fatigue of the components. This is not applicable to a drained
cavity system, whereby there is only slight air movement within the cavity.

Each system is required to be checked against the wind loads for the specific zone of
the building under consideration. Although wind speeds can be assumed using
published data for specific regional areas, the building details, shape, size, height,
and positions of surrounding buildings will be unique in every case. For this reason, it
is not possible to assume the magnitude of wind loads based on location only i.e.,
buildings on the same street, in the same town, as all will be subject to uniquely
different wind loads.

The strength of cladding systems will vary dependent upon the fixing or adhesive
type, the background and the number of fixings used. Inadequate attention to correct
fixings, spacing and number can lead to systems being detached from the wall.
Standard calculations assume wind gusts on a 50-year return period. As extreme
weather events appear to becoming more common place, the need for security of
cladding solutions is ever more important.

Advice on the specific strength of a cladding system should always be sought from
the system designer. This will be crossed referenced to the project design wind load,

                                                                                             5
taking into account specific geographical locations to ensure that the designed
system is compliant.

Modes of Failure

When assessing failure points of ETICS systems there are two modes of approach.
The first being a Dynamic Wind Uplift (DWU) test and the second being a structured
engineered approach following the principles of EAD 040083-00-0404 / EAD
040914-00-0404 and BS EN 1990 / 1991.

The DWU approach tests a large sample area through repeated changes in air
pressure simulating gusts of wind pulling on the façade. After each complete set of
cycles, the pressure is increased and the cycle is repeated. This is done until a drop
in pressure is recorded or a failure is visible on the sample. The downside to this
method is that the data set cannot be extrapolated, and the result is only relevant to
the system that is tested including the fixing frequency used and based on the
substrate design used.

The structured engineered approach following the principles of EAD 040083-00-
0404 / EAD 040914-00-0404 is more common as this allows the system to be
designed to the project design wind load using data sets created through testing on
each mode of failure. This is completed using safety factors declared in EAD
040083-00-0404 / EAD 040914-00-0404.

Any positive pressure (pushing motion) applied to the system is transferred to the
substrate and therefore is not a requirement for it to be considered when designing
an ETICS system. For the purpose of designing ETICS systems, only negative
pressure (suction) is considered.

When completing a system compliance check to establish if the standard system is
suitable or if the system needs to be engineered further, the project design wind load
must be known. This is normally completed by the project structural engineer by
following the principles outlined in BS EN 1991-1 to obtain the Characteristic Load,
then a safety factor, γL, is applied in line with BS EN 1990 to obtain the Design Load,
also known as Ultimate Wind Load. When being presented with data from the
structural engineer, it should be checked to find out what standard this has been
created to and if it is the Characteristic or Design Load (i.e., unfactored or factored).
Whilst the two methods exist of demonstrating wind load resistance of the system, a
testing method and an engineered design method, as the testing method is
extremely limited and the combinations within the system are vast, the engineered
approach is the most common method used.

Within the engineered methodology there are various methods that can allow an
ETICS system to fail under suction and all should be considered as each project and
structure combination will have its own weaknesses. This section explains what the

                                                                                            6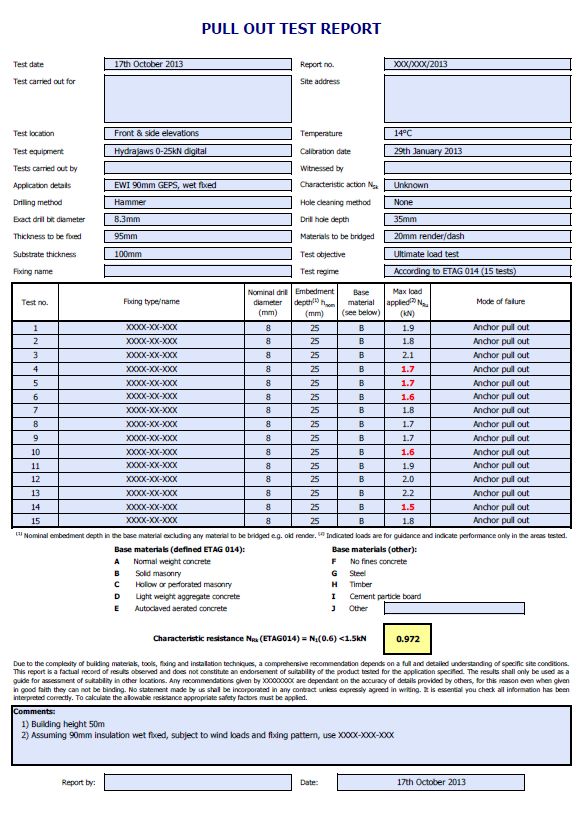
failure modes are, and the calculations that must be followed to demonstrate
compliance to the customer, and also for calculating bespoke fixing patterns should
they be required.

Different Types of Modes of Failure

Fixing Pull Out (mechanical fixed systems only)

This is where the mechanical anchors used to secure the system to the substrate
fail. For the most common masonry substrates, fixings are classified according to
EAD 330196-00-0604 with results declared against each substrate (to a maximum
declared value of 1.5kN). Where the substrate is not listed within the EAD, on site
testing can be completed in accordance with EOTA TR051 or where lab-based
testing is possible this can be done in line with the Construction Fixings Association.
Some systems, such as cavity-based systems, may use more than one type of fixing
so each fixing type must be accounted for, i.e., fixings for top hat creating the cavity
and supporting the insulation fixings. Should ancillary items such as top hats not be
supplied by the system designer, it is the responsibility of the project design team to
ensure that they are designed correctly, capable of supporting the project load and
able to resist the project design loads.

Once the performance of each fixing is known, the number required per m² to
achieve the Project Design Load can be determined.

Insulation Adhesive Bond Strength (Adhesive fixed systems only)

This is where adhesive is used as the primary attachment for the insulation, in place
of mechanical anchors. Failure is deemed to occur when the adhesive fractures and
loses its bond strength performance and allows the insulation to detach from the
substrate. Adhesive Bond strength is determined from on-site testing in accordance
with EAD 040083-00-0404 / EAD 040914-00-0404.

Once the result is known, the percentage of adhesive can be adjusted in line with
EAD 040083-00-0404 / EAD 040914-00-0404.

Render Bond Strength

This is where the bonded reinforcing coat detaches away from the insulation.
ETICS systems by nature are bonded layered systems and as such, the bond
strength between the reinforced base coat and the insulation is a known mode of
failure. EPS based systems are less susceptible to this mode of failure, Phenolic
systems can be prone to the tissue delaminating from the insulation board causing
this mode of failure. MW insulation is more problematic as being fibrous by nature
the reinforcing render doesn’t bond as well as it does to closed cell type insulation.
In many cases, this is the primary mode of failure for MW systems and can have a

                                                                                           7
low performance limiting the system design before it requires amending. Where the
result is lower than the Project Design Load, then all mechanical anchors for wind
load compliance must be installed through the reinforcing mesh. This may require
additional anchors being used as temporary securement of the insulation.

Fixing Pull Through

Pull through is where the insulation anchor remains in the wall but the insulation has
been pulled over the fixing head. When considering pull through, it is important to
ensure that the fixing washer size and plate stiffness is the same or higher than that
tested by the system designer. When moving away from the standard fixing pattern,
it is important to consider the rupture method of the insulation to ensure the load
displacement of the fixings do not overlap, or interfere with insulation board edges.

When assessing test data for pull through it is important to consider both wet and dry
insulation test data sets, as with some insulation types, the performance deteriorates
when wet.

                                                                                         8
APPENDIX 1: EXAMPLE CALCULATION
9Appendix 1: Example Calculation
The figures used in the following calculation are for illustrative purposes only.
Building Parameters
i) Building height (50.0m) with 2.0m high parapet.
50.0m
15.2m
ii) Assumed example building is assumed to be square on plan.
26.7m
38.5m
iii) The building is assumed to be constructed from rendered Clay Brick with
a density exceeding 1.8 kg/dm3 and have less than 15% vertical
perforations. The render over the bricks is 18mm thick.
iv) Building is to be clad with a 60mm thick phenolic foam ETICS system.
v) Site Location:
Postcode: L21 1AU
OS Grid Ref: SJ328972
Site Level AOD: 12m
Upward Distance to Sea: 0m
Distance to Edge of Town: 0m
10Site Location
i) Site Post code : L21 1AU
ii) Terrain Category : EN 1991-1-4 (4.3.2) Table 4.1
iii) Orography Calculator
11iv) Terrain
Building Geometry
i) Reference Height: ( H r ) = 50m
ii) Parapet Height: ( H P ) = 2.0m
iii) Size Effect Factor: (b+h)
b = 1.2m
H = 0.6m
Size effect dimension:
b + h = 1.2 + 0.6 = 1.8m
The dimensions of the individual cladding panel should be used to determine the size
effect. BS 6399 called this the diagonal dimension and used to be set to a minimum
of 5m.
12Wind Loading
i) Determination of basic wind velocity:
vb =cdir × cseason × vb ,0 EN 1991-1-4 (4.2)
where:
vb basic wind velocity
cdir directional factor
cseason seasonal factor
vb ,0
fundamental value of the basic wind velocity
Fundamental value of the basic wind velocity: (see European Wind Map)
vb = 23.5 m s (for Sefton – UK)
For simplification the directional factor
cdir and the seasonal factor cseason are taken to
be equal to 1 (conservative)
∴ vb = cdir × cseason × vb ,0 = 23.5 m s
ii) Basic Velocity Pressure
1
qb = × ρ air × vb 2 EN 1991-1-4 (eq. 4.10)
2
where: ρ air = 1.25 kg m3
1
∴ qb = ×1.25 × 23.52 =345.15 N m 2
2
iii) Peak Pressure
1
q p ( z ) = 1 + 7lv ( z ) × × ρ × vm ( z )
2
EN 1991-1-4 (eq. 4.8)
2
Calculation of vm ( z )
vm ( z ) mean wind velocity
vm ( z ) = cr ( z ) × co ( z ) × vb
13where: co ( z ) is the orography factor
cr ( z ) is the roughness factor
z
c0 ( z=
) kT × ln for zmin ≤ z ≤ zmax
zo
cr ( z ) = cr ( zmin ) for z ≤ zmin
where: z0 is the roughness length
kT is the terrain factor, depending on the roughness length z0
calculated using:
0.07
z
kT 0.19 × 0
= EN 1991-1-4 (4.3.2)
z
0,II
where: z0,II = 0.05 (terrain category II) EN 1991-1-4 (Table 4.1)
zmin is the minimum height
zmax is to be taken as 200m
Calculation of lv ( z )
lv ( z ) turbulence intensity EN 1991-1-4 (eq. 4.7)
kI
lv = for zmin ≤ z ≤ zmax
co ( z ) × ln ( z zo )
lv = lv ( zmin ) for z < zmin
where: kI is the turbulence factor. Recommended value for kI is 1.0
z = 50m
so: zmin < z < zmax
7 kI 1
q p ( z ) = 1 + × × ρ × vb × ( kT × ln ( z zo ) )
2
c0( )
z × ln ( o )
z z 2
squared gust factor basic pressure wind profile
14Wind pressure on surfaces:
A positive wind load stands for pressure whereas a negative wind load indicates
suction on the surface.
External pressure coefficients:
The wind pressure acting on the external surfaces,
we should be obtained from the
following expression:
=we q p ( ze ) × c pe EN 1991-1-4 (eq. 5.1)
where: ze is the reference height for the external pressure (50m)
c pe is the pressure coefficient for the external pressure
15Walls
2
So: −1.2 kN m is critical suction
see fixing check
Parapet
2
So: −1.9 kN m is critical suction
see fixing check
16Wind Loading Summary
2
• Dynamic Pressure: 1.076 kN m
2
• Maximum Suction Zone A: 1.2 kN m
2
• Critical Suction on Parapet: 1.9 kN m
Anchor Design Resistance Assessment (Mechanical Fix)
The Construction Fixings Association (CFA) provides detailed guidance when it is
necessary to carry out site specific pull-out tests. The CFA guidance notes are
available from www.the-cfa.co.uk. Their recommendations are in accordance with BS
8539:2012 Code of practice for the selection and installation of post-installed anchors
in concrete and masonry.
Testing is not normally required for anchors used in concrete as BS 8539:2012
recommends that only anchors with European Technical Approval (ETA) should be
used and full performance will be stated in the ETA. Tests may be required if for
some reason no anchors with ETA are available, or if the condition of the concrete
gives reason to believe that performance quoted in the ETA is unlikely to be
achieved. Site specific testing is normally only required for anchors used in masonry,
or other materials as detailed below.
If the anchor type selected is covered by a valid ETA for the category of masonry of
the job and that masonry conforms to the qualifications of the ETA then it is allowable
to utilise the tabulated values of the Characteristic Resistance Nrk0 - see appendix 2
for an extract from a typical fixing ETA report.
If the anchor selected is covered by a valid ETA for the category of masonry of the
job but that masonry does not conform to the qualifications of the ETA in terms of
strength and dimensions, then site specific pull-out tests should be carried out to
assess the design resistance of the anchor.
Where there is no anchor on the market which carries a relevant ETA, the tests called
for in BS8539:2012 Annex B.2.3 should be carried out provided the proposed
anchors are of a type approved by the manufacturer for use in the category of
material involved.
The most typical approach is to adopt the recommendations of Annex D of European
Technical Approval Guideline (ETAG) 014. These tests shall take account of the
most unfavourable conditions of practical execution. At least 15 tests should be
undertaken. More tests may be necessary if the substrate is variable in condition or
completely different substrates exist in the building i.e., concrete and brickwork areas.
Other test regimes are available under BS 8539:2012 and can be used as an
alternative. Proof load testing of fixings is highlighted in BS 8539:2012 but is not
normally required for ETICS applications and is not deemed practical to undertake.
17Extract from Annex D of ETAG 014
D.2. Assembly
The plastic anchor to be tested shall be installed (e.g., preparation of drill hole, drilling
tool to be used, drill bit) and, as far as spacing and edge distances are concerned, be
distributed in the same way as foreseen for the fixing of the external thermal
insulation composite system.
Depending on the drilling tool, hard metal hammer-drill bits or hard metal percussion
drill bits, respectively, according to ISO 5468 [17] shall be used the cutting diameter
of which is at the upper tolerance limit.
D.3. Execution of test
The test rig used for the pull-out tests shall allow a continuous slow increase of load
controlled by a calibrated load cell. The load shall act perpendicularly to the surface
of the base material and be transmitted to the plastic anchor via a hinge. The type of
test rig bridge needs to be considered in accordance with BS 8539:2012 The load
shall be continuously increased so that the ultimate load is achieved after about 1
minute. Recording of load is carried out as the ultimate load (NRu) is achieved for
each anchor.
On site pull-out testing and determination of design loads
Examples of test rigs
The fixing test results should be provided on a test report – see appendix 3 for
example of fixing test report.
18Product Assessment – Assumptions and Recommendations
This section sets out the assumptions and recommendations for assessment of the
product ‘fitness for use’ according to the ETAG 014 relating to design, installation and
execution, packaging, transport and storage, use, maintenance, and repair.
Design Methods for Anchorages
The overall assumption shall be made that the design and dimensioning of
anchorages is based on technical considerations and in particular the following:
• The characteristic resistance of single plastic anchors in the different base
materials is evaluated according to 6.4.3. Taking a simple approach, the
characteristic resistance of single plastic anchors may be used for the different
loading directions (shear load and combined tension and shear loads)
• In accordance with UK national regulations (UK Construction and Fixing
Association), the partial safety factors for the resistance of the plastic anchor may
be taken as: γ m = 2 (see above)
• The minimum edge distance (cmin = 100mm) and spacing (smin = 100mm) should
not fall below these values
• The preparation of verifiable calculation notes and drawings for determining the
relevant concrete or masonry in the region of the anchorage, the loads to be
transmitted and their transmission to the supports of the structure
• Investigations and evaluations according to ETAG 004 [3] are necessary for the
verification of the loading imposed by the ETICS on to the plastic anchor.
Method A (Using ETA Approved Fixings into Standard Substrate)
Assuming that the fixings can be designed using this method, the characteristic
resistance of the fixing can be obtained as follows (the NRko can be taken as 1.5 kN
directly from the ETA):
N=
RD 0 1.5
= 2 0.75kN
19Method B (Site Testing)
Using the formula given in ETAG 014 Annex D, the characteristic resistance of the
anchors can be determined as follows:
D.5. Evaluation of test results
The characteristic resistance NRK1 is obtained from the measured values on N1 as
follows:
NRK1 = 0,6 N1 ≤1,5 kN
N1 = the mean value of the five smallest measured values at the ultimate load
Extract from Test Report
On site pull-out tests conducted on the fixings type XYZ.
Fixings Drill Bit Penetration Location Material Load Mode of
Type dia (mm) (mm) (kN) failure
1 XYZ 8 20 Random K 1.9 Ultimate
2 XYZ 8 20 Random K 1.8 Ultimate
3 XYZ 8 20 Random K 2.1 Ultimate
4 XYZ 8 20 Random K 1.7 Ultimate
5 XYZ 8 20 Random K 1.7 Ultimate
6 XYZ 8 20 Random K 1.6 Ultimate
7 XYZ 8 20 Random K 1.8 Ultimate
8 XYZ 8 20 Random K 1.7 Ultimate
9 XYZ 8 20 Random K 1.7 Ultimate
10 XYZ 8 20 Random K 1.6 Ultimate
11 XYZ 8 20 Random K 1.9 Ultimate
12 XYZ 8 20 Random K 2.0 Ultimate
13 XYZ 8 20 Random K 2.2 Ultimate
14 XYZ 8 20 Random K 1.5 Ultimate
15 XYZ 8 20 Random K 1.8 Ultimate
Material: K = Brickwork
i) Calculate mean N1 of the lowest 5 results: highlighted in red
N1 = 1.62 kN
ii) Calculate characteristic resistance
NRk1 = 1.62 x 0.6 = 0.972 kN per fixing
iii) Calculate design resistance
N Rd 1 0.972
NRd1 = kN = = 2 0.486kN per fixing
20Pull-Through Capacities
The characteristic pull through resistance of the fixings and the specific insulation
material should also be examined as this may be the limiting factor, not the actual
pull-out resistance of the anchor in the substrate.
The characteristic pull through capacities are assessed as part of the ETAG 004 or
BBA approval of ETICS systems. As such, tabulated values of the characteristic pull
through values are available. It should be noted that the pull through capacities
achieved are highly dependent on the type / thickness of the insulation and the
diameter of the fixing head.
Some fixings are designed to be recessed into the insulation. If these fixings are used
then it should be noted that the insulation thickness is effectively reduced.
Accordingly, the fixing supplier provides recommendations on the minimum thickness
of insulation that should be used. These fixings cannot be used with certain types of
insulation e.g., dual density mineral fibre.
A typical value of the characteristic pull-through for a 60mm diameter plate fixing with
60mm expanded polystyrene would be circa 530N per anchor (i.e., 0.53 kN);
however, with a 140-diameter extension washer the characteristic pull through
capacity is typically 1000N.
This characteristic capacity should be factored down by a partial material safety
factor. γ m = 2.5
Hence the design pull-over value for the fixings with 140mm diameter washers would
be / = kN. 1.0 2.5 = 0.400kN
In this example, this would be the critical design mode of failure and, as such, the
limiting design wind pressure would have to be based on this value.
21Mechanical Fix – System Design Wind Resistance
Based on 5 fixings per 1.2m x 0.6m board, the wind resistance per board would be:
= kN 5 × 0.40 = 2kN /board.
The wind resistance / m2 will therefore be:
2.0
= 2.77 kN m 2
1.2 × 0.6
On this basis the design would be safe for the main zone A, B and C areas of the
building as wind suction in these areas will not exceed a design wind suction of:
1.8kN m 2
1.2 × 1.5 =
However, 5 fixings per board would not be sufficient for the parapet areas. The
parapet areas would require 6 fixings per board i.e.
6 × 0.4 =
2.4kN
3.33 kN m 2 > 1.5 × 1.9 =
2.85 kN m 2
Adhesive Fix Comparison
To verify the characteristic bond strength for a particular building, five adhesion tests
should be undertaken. These tests involve applying adhesive to the wall and
allowing it to cure for 1 day per mm of render thickness. The samples are then tested
with a pull off meter having bonded a 50mm diameter dolly to the wall. The dolly is
normally over cored so that loading is only applied to the surface directly below the
dolly and no sharing from surrounding substrate. If the surface strength exceeds
0.08N/mm2 then the adhesion between the adhesive and insulation becomes the
weakest link. None of the test results must be lower than 0.08 N/mm2 – see clause
7.2.1.1 ETAG 004.
The wind suction that can be resisted by a 40% adhesive fixed system with a bond
strength of 0.08 N/mm2 = 80 kN/m2 is demonstrated by the following calculation:
Design bond strength = characteristic bond strength = 80/9 = 8.8 kN/m2
Bond area per m2 = 0.4 m2
Hence design bond strength = 0.4 x 8.8 = 3.55 kN/m2
However, the un-factored wind load capacity would be 3.55 / 1.5 = 2.37 kN/m2
This would therefore be adequate to resist the design load of 1.84 kN/m2 in zones A,
B and C but would not be sufficient for the parapet areas.
For the parapet areas, one of the following would be required:
• Proof that the bond strength exceeded 0.08
• Increase in the adhesive percentage
22Extract from ETAG 004
7.2.1.1 Substrate suitable for bonded ETICS
Where the ETICS rely on being bonded, the suitability of the substrate needs to be
established as follows:
• New concrete or masonry surfaces may be suitable provided they are not
contaminated e.g., by mould, mould oil (concrete) or other pollutants
• Other new substrates will need to be subject to on-site testing
• Old substrates may need surface preparation; for example, removal of paint
finishes or existing renders where their load transfer to the wall cannot be
confirmed
• Whenever there is doubt about the quality of an existing substrate, on-site
testing shall be undertaken
• Where testing is undertaken no result shall be less than 0.08 N/mm2 for a
bonded system to be used.
23APPENDIX 2: EXTRACT FROM A TYPICAL ETA FIXING REPORT
24Appendix 2: Extract from a Typical ETA Fixing Report
25APPENDIX 3: EXAMPLE OF A FIXING TEST REPORT
26Appendix 3: Example of a Fixing Test Report
27Acknowledgements
Wind loads can be calculated using the latest version of Metsec Framing’s industry leading
panel design software. Metspec14 is Eurocode compatible and provides an invaluable tool to
quickly calculate accurate and efficient wind loads in accordance with BS EN 1991-1-4. INCA
would like to thank Metsec for the use of their software when calculating wind loads as
indicated in Appendix 1. Metspec14 can be downloaded from Metsec’s website at
www.metsec.com.
All project design wind loads must be completed by a suitably qualified or competent person.
28This guide is issued by INCA to give general guidance on best practice. INCA and the
organisations responsible for its content do not accept any liability arising in any way from
relying on this guide. If you require advice on a specific issue, you should seek your own
independent professional advice.
Requests to use any part of this guide should be made in writing to:
Insulated Render and Cladding Association (INCA)
66 Bondgate, Castle Donington, Leicestershire
DE74 2NR
Email: info@inca-ltd.org.uk
www.inca-ltd.org.uk
Version 2 (dated 16/09/2021)
29You can also read