Identification of Formaldehyde Bananas Using Learning Vector Quantization - Semantic Scholar
←
→
Page content transcription
If your browser does not render page correctly, please read the page content below
Indonesian Journal of Information Systems (IJIS) 160
Vol. 3, No. 2, February 2021

Identification of Formaldehyde Bananas Using Learning
Vector Quantization

 R Musa1, M Akbar2
 1,2
 Study Program of Informatics, Faculty of Information Technology,
 University of Mercu Buana Yogyakarta

 E-mail: kaangmamat@gmail.com1, mutaqin@mercubuana-yogya.ac.id2
 Submitted:14 January 2021, revised: 25 February 2021, accepted: 26 February 2021

 Abstrak. Pisang yang matang dengan proses kimiawi atau tidak matang secara alami biasanya,
 hal ini bisa dikenali dengan adanya bercak-bercak berwarna kehitaman pada permukaan
 kulitnya. Tetapi pengenalan secara visual memiliki kekurangan yaitu sulit dalam mengenali
 kemiripan antara pisang formalin dan pisang alami sehingga berdampak pada kurang akurat nya
 terhadap identifikasi tersebut. Pada penelitian ini, dibangun suatu sistem yang dapat menentukan
 buah pisang formalin maupun buah pisang alami melalui identifikasi citra digital menggunakan
 supervised classification. Citra yang akan diidentifikasi sebelumnya melewati proses
 transformasi warna RGB (Red Green Blue) ke Grayscale, dan proses ekstraksi fitur tekstur
 menggunakan fitur-fitur yang dapat dikenali secara statistis melalui histogram, berupa rerata,
 standar deviasi, skewness, kurtosis, energi, entropi dan smoothness. Hasil ekstraksi fitur tekstur
 diklasifikasi dengan LVQ (Learning Vector Quantization) untuk menentukan buah pisang
 formalin atau alami. Pengujian dilakukan dengan 122 data sampel citra buah pisang, 100 citra
 sebagai data latih yang terdiri dari 50 citra untuk pisang alami dan 50 citra untuk pisang
 formalin, 22 citra sebagai data uji. Hasil pengujian menunjukkan metode LVQ memiliki
 persentase terbaik pada learning rate 0.1, penurunan learning rate 0.75 dan maksimal iterasi
 1000 dengan iterasi terkecil yaitu 7, memperoleh hasil accuracy 90.90%, precision 84.61% dan
 recall 100%.
 Kata kunci: Learning Vector Quantization; Jaringan Saraf Tiruan; pisang.
 Abstract. Bananas ripened via chemical processes, or even unnaturally, can usually be
 recognized by the blackish spots on the peel surface. However, visual recognition has a
 drawback that makes it difficult to recognize the similarities between formaldehyde bananas and
 the natural ones, therefore it has an inaccurate impact on the identification. In this research, a
 system was built to determine formaldehyde and natural bananas by identifying digital images
 using supervised classification. The identified images previously went through the color
 transformation process from RGB (Red Green Blue) to grayscale, and the texture feature
 extraction process used the features that could be recognized statistically through a histogram,
 such as mean, standard deviation, skewness, kurtosis, energy, entropy, and smoothness. The
 results of texture feature extraction were classified by LVQ (Learning Vector Quantization) to
 determine the formaldehyde or natural bananas. The test was carried out with 122 sample data
 for banana images: 100 images as the training data, consisting of 50 images for the natural
 bananas, and 50 images for the formaldehyde bananas, and the other 22 images as the testing
 data. The test results showed that the LVQ method had the best percentage at the learning rate
 of 0.1, the decrease in learning rate of 0.75, and the maximum iteration of 1000 with the smallest
 iteration of 7, obtaining 90.90% accuracy, 84.61% precision, and 100% recall.
 Keywords: Learning Vector Quantization; Artificial Neural Network; bananas.

 Musa, Akbar (Identification of Formaldehyde Bananas using Learning Vector Quantization)
Indonesian Journal of Information Systems (IJIS) 161
 Vol. 3, No. 2, February 2021

1. Introduction
Banana is the most popular fruit in Indonesia and often used as the main ingredient in processing food.
Banana production has increased by an average of 7.5% per year from 2004-2009 in North Sumatra,
however in 2010 the banana production decreased by 9.7% from the previous year. This is due to the
disturbance of organism that causes the banana production to decrease, such as fusarium wilt disease
[1]. According to the Central Bureau of Statistics (2005) the regions that are central to banana plants in
North Sumatra are Langkat, North Tapanuli, Simalungun, Dairi, Asahan, Serdang Bedagai, and Deli
Serdang Regencies with respective production percentage of 27.90%; 14.91%; 12.28%; 6.08%; 5.81%;
5.73 and 5.69% of the total banana production in North Sumatra [2].
 Even though the banana plant production is increasing, there are still many people who take
advantage of this opportunity by ripening banana with ingredients. Banana that is ripe with chemical
processe has other effects, one of them is disrupting fertility. This is caused by the entry of carbide into
the body and ultimately affects our reproductive system. Banana that is ripe by chemical process usually
characterized by the presence of blackish spots on the skin surface. Even though the banana looks
yellowish and ripe, this chemical banana does not have the distinctive aroma of ripe banana. It indicates
that the ripening process of the fruit which is widely known to be good for digestive health is unnatural
and may not be good for health. Natural process ripe banana contains vitamin B, C, protein and
carbohydrates. Banana that is ripened to be more ripe has imperfect nutrients, in fact, in many cases the
banana does not have any nutrients so it will not get any health benefits [3].
 In choosing fruit by using the human senses, of course it has become ordinary and commonplace,
but it does not rule out the possibility of errors in the fruit selection. For this reason, an intelligent
system in fruit selection will be very useful and beneficial for customers. Many studies conducted by
experts in the field of artificial intelligent only focus on the level of maturity of the fruit produced and
only a few have conducted a study on chemical fruits, this happens that there is awareness in humans
generally occurs in people in Indonesia because the level of health awareness is still lacking. Several
previous studies to evaluate and classify the ripeness of banana using image processing [4].
Identification of fruit plants based on features of shape, color and leaf texture based on image processing
and Learning Vector Quantization (LVQ), the study conducted by Sutarno, Rouzan Fiqri Abdullah and
Rossi Passarella obtained test results with a success rate of 82% in recognizing fruit plants based on
their leaves [5].
 There are various algorithms for pattern recognition that can be applied to identify formaldehyde
bananas using their peels. However, most of the recognition methods use the nearest neighbor-based
method [6]. The neighbor-based method has the advantage of being simple and easy to implement.
However, there is a drawback, namely it is slow if large amounts of data are used [7]. Alternative
method that can be used to recognize patterns on banana peels is artificial neural networks. The
performance comparison between the neighbor-based method and the artificial neural network shows
that the neural network is able to identify formaldehyde banana better than the nearest neighbor [8].
Backpropagation Network and Learning Vector Quantization (LVQ) are the most commonly used
neural network algorithms to solve pattern recognition problems. Backpropagation has the advantage
of finding optimal results and on the other hand, LVQ classifies based on sample vectors from semi-
optimal training data [9]. In terms of performance, LVQ and Backpropagation have similar
performances [10].
 Based on the existing problems, this paper will identify formaldehyde banana using LVQ with the
features used derived from the characteristics found in banana peels.

2. Literature Review

2.1. Grayscale Image
Grayscale image is an image whose pixel value represents the degree of gray on the white intensity.
Each pixel value in grayscale image corresponds to its brightness. The pixel value of grayscale image
will be represented by byte or word with 8-bit value, the intensity of the brightness varies from 0 to

 Musa, Akbar (Identification of Formaldehyde Bananas using Learning Vector Quantization)
Indonesian Journal of Information Systems (IJIS) 162
 Vol. 3, No. 2, February 2021

255, “0” is represented as black and “255” is represented as white [11]. Following is the image
conversion formula where R is the red channel, G is the green channel and B is the blue channel [12].
 = (( ∗ 0.2989) + ( ∗ 0.5870) + ( ∗ 0.1140)) (1)

2.2. Features Extraction
A simple method for obtaining texture is to base on the histogram. An image with a subtle texture has
a narrow area of change in intensity. In contrast, grainy image has high contrast, characterized by a
wide range of intensities. Some of the formulas used in this study are as follows [13].
 −1

 = ∑ . ( ) (2)
 =0

 −1
 (3)
 = √∑( − )2 ( )
 =1

 −1

 = ∑( − )3 ( ) (4)
 =1

 −1

 = ∑( − )4 ( ) − 3 (5)
 =1

 −1

 = ∑[ ( )]2 (6)
 =0

 −1

 = − ∑( ) log 2 ( ( )) (7)
 =0

 1
 =1−
 1 + 2 (8)
Description:

 = grayscale in the image f
 ( ) = probability of occurrence i
L = highest grayscale value
 = standard deviation

2.3. Euclidean Distance
Euclidean Distance is a method used to measure the distance between 2 (two) different points. This
method will be used to calculate the distance of the input feature vector and the weight feature vector
obtained from the extraction of texture features [14]. The following formula is used [15].

 Musa, Akbar (Identification of Formaldehyde Bananas using Learning Vector Quantization)
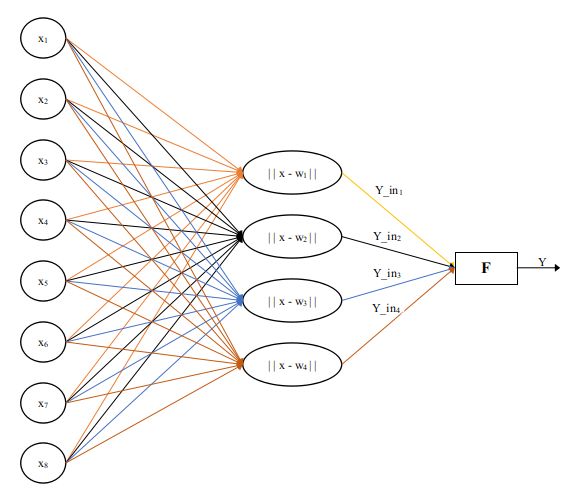
Indonesian Journal of Information Systems (IJIS) 163
 Vol. 3, No. 2, February 2021

 ( , ) = √∑( − )2
 (9)
 =1

Description:
 , = two points in Euclidean n-space
 , = Euclidean vectors, starting from the origin of the space (initial point)
 = n-space

2.4. Learning Vector Quantization
Learning vector quantization (LVQ) is a pattern classification method where each output unit represents
a particular category or class. The learning process in LVQ is carried out through several epochs (time
span) until the maximum epoch limit has been passed. A competitive layer will automatically learn to
classify input vectors. The classes obtained as a result of this competitive layer depend only on the
distance between the input vectors [16]. The learning vector quantization architecture can be seen in the
following figure:

 Figure 1. Learning Vector Quantization Architecture

 The algorithm is as follows [17]:
 1. Determine the maximum epoch (number of training processes to be repeated), eps (minimum
 expected error) and alpha value.
 2. The results of the first feature extraction from each pattern are used as initial data
 (initialization). This initialization data will be filled in as the initial weight value (w).
 3. Epoch = 0.
 4. As long as (Epoch = Eps), then do the following:
 a. Epoch = Epoch + 1
 b. For each feature extracted data, do the following:
 1) Set X = feature extraction result
 2) Set T = target of each class
 3) Calculate the current feature extraction distance with each weight.
 4) If the class number on the weight that has the smallest distance is the same as the
 target value (T), then calculate:
 ( ) = ( ) + ( − ( )) (10)
 5) If not, then calculate:

 Musa, Akbar (Identification of Formaldehyde Bananas using Learning Vector Quantization)
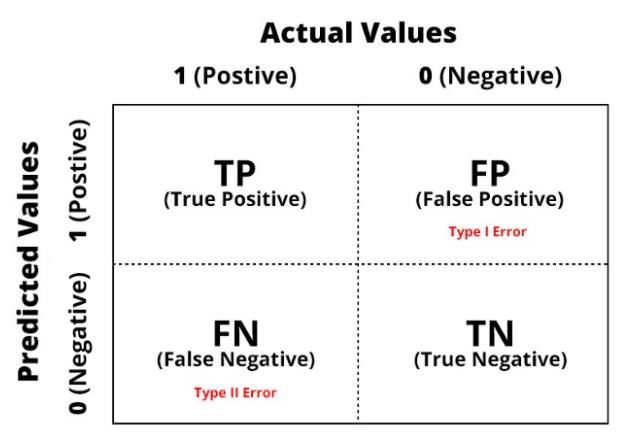
Indonesian Journal of Information Systems (IJIS) 164
 Vol. 3, No. 2, February 2021

 ( ) = ( ) − ( − ( )) (11)
 c. Subtract Alpha value:
 = − (0.1 ∗ ) (12)
 5. Save the training results weight (w).

2.5. Confusion Matrix
Confusion matrix is also often called error matrix. Basically, confusion matrix provides information on
the comparison of classification results carried out by the system (model) with the actual classification
results. The confusion matrix is in the form of matrix table that describes the performance of the
classification model on a series of test data whose true value is known [18]. Look at the following
figure:

 Figure 2. Confusion Matriks [18]

 Confusion matrix is a matrix for measuring the performance of classification that has 4 variables,
namely TP (True Positive), which means when the system predicts positive and the result is correct, TN
(True Negative) when the system predicts negative and the result is correct, FP (False Positive) when
the system predicts positive and the result is false, FN (False Negative) means when the system predicts
negative and the result is wrong [19]. There are several calculations that can be used as tests on the
system including [11].
 ( + )
 =
 ( + + + ) (13)

 ( )
 =
 ( + ) (14)

 =
 ( + ) (15)

3. Methodology

3.1. Image
The dataset used is image data from bananas taken from their own garden, location of Pohuwato,
Gorontalo. The banana used as the object of this study, namely Kepok banana, used as the study material
because it is easy to obtain and often used as food ingredient by small traders. Banana image is taken
using webcam camera with one photo for each side of the formaldehyde and natural bananas with light
conditions during the day. The image that has been taken is then cut so that it is focused on the banana
body and has resolution of 650 x 500. Here are the sample data in Figure 3:

 Musa, Akbar (Identification of Formaldehyde Bananas using Learning Vector Quantization)
Indonesian Journal of Information Systems (IJIS) 165
 Vol. 3, No. 2, February 2021

 (a) (b)
 Figure 3. Sample Data (a) Natural Banana, (b) Formaldehyde Banana

3.2. Grayscale Image
At this stage, the RGB (Red Green Blue) image color transformation process is carried out to grayscale.
This transformation is carried out so that the process is focused on one layer and calculation will be
faster. The calculation process uses formula (1).

3.3. Texture Features
At this stage, the feature extraction process is carried out from grayscale image with texture. Extraction
of texture features is carried out to take the image features, this features are very influential in the
classification of data to determine formaldehyde bananas. The features used can be seen in subsection
2.2 and the results of the feature extraction are in the form of vectors, or often called as feature vectors.

3.4. Parameter
In this process, parameter is determined that can determine the level of accuracy of a system that has
been built. The parameter used in this study is as the following Table 1.
 Table 1. Training Parameter
 Parameter Nilai
 Number of Training Data 100
 Number of Test Data 22
 Number of Targets 2 (1 = Alami, 2 = Formalin)
 Alfa / Learning Rate 0.1, 0.01, 0.001, 0.0001
 Dec alpha / Decrease Learning Rate 0.05, 0.1, 0.25, 0.5, 0.75
 Min alpha / Minimum Learning Rate 0.00001
 Max epoch / Maximum Epoch 1000
 Epoch 0

3.5. LVQ Training
Extraction of texture features from the previous process resulted in 7 (seven) texture data (mean,
standard deviation, energy, entropy, skewness, kurtosis and smoothness) in the form of vectors as
described in subsection 3.3. The vector is then used as input data in the training process using Learning
Vector Quantization. The stages for training are listed in the following flowchart:

 Musa, Akbar (Identification of Formaldehyde Bananas using Learning Vector Quantization)
Indonesian Journal of Information Systems (IJIS) 166
 Vol. 3, No. 2, February 2021

 Figure 4. Learning Vector Quantization Training
 The training process starts from initializing the input data. Two inputs will be initialized into the 1st
and 2nd training weights, namely the formaldehyde banana feature data and the natural banana feature
data, while the rest will be used as learning input. The next step is to determine the epoch value, learning
rate (alpha), and the decrease in learning rate value (Dec alpha). After the epoch value is determined,
at the 1st epoch the shortest distance is calculated with the 1st and 2nd training weights. After the shortest
distance on the 1st and 2nd weights are obtained, then the smallest distance is selected for the
multiplication process with the learning rate value. The results of the calculation will be used as the
new weights; the process is carried out until the value of the last learning input is obtained at the 1st
epoch. Before entering the next epoch, the learning rate (alpha) value will be updated by multiplying
Dec alpha with the old learning rate. After the new learning rate value is obtained, the same calculation
process as the 1st epoch will be carried out until it reaches the specified number of epochs. The final
training weight will be obtained after reaching the specified number of epochs for use in the next
process.

 Figure 5. LVQ Architecture that Uses

 Musa, Akbar (Identification of Formaldehyde Bananas using Learning Vector Quantization)
Indonesian Journal of Information Systems (IJIS) 167
 Vol. 3, No. 2, February 2021

3.6. LVQ Testing
After the training stage with LVQ has been completed, the next process is to test the test data to match
the introduction results obtained from training with testing. The final weight of the training process will
be used to calculate the distance in the test data. Here in Figure 6 is the flowchart:

 Figure 6. Learning Vector Quantization Testing

 Testing is a process to see whether the classification process is correct or not. The classification
results can be seen in a confusion matrix in which there is the amount of data entering the correct and
the wrong classes. Then the calculation can be done to determine accuracy, precision and recall for each
data class.

3.7. Software
The software used in this study is built using MATLAB version 2016a with several libraries that have
been provided such as rgb2gray to change colors from RGB to Grayscale, xlsread to read the results of
the extraction that has been done, plotconfusion to calculate the Confusion Matrix and several other
libraries.

4. Result and Discussion
In this study, 122 digital image data of bananas are used which are divided into two classes, namely
natural bananas and formaldehyde bananas, then divided into 100 images as training data consisting of
50 for natural bananas, 50 for formaldehyde bananas and 22 images for testing data. All image data
goes through RGB (Red Green Blue) color transformation process to Grayscale. Here is an example:

 (a) (b)
 Figure 7. Sample Data Grayscale (a) Natural Banana, (b) Formaldehyde Banana

4.1 Feature Extraction
The next stage after converting it to Grayscale or grayscale level, then the image can be processed to
obtain the mean, standard deviation, energy, entropy, skewness, kurtosis, and smoothness values. This
texture feature is later used for the input value in the LVQ classification. The following is an example
of the results of feature extraction:

 Musa, Akbar (Identification of Formaldehyde Bananas using Learning Vector Quantization)
Indonesian Journal of Information Systems (IJIS) 168
 Vol. 3, No. 2, February 2021

 Table 2. Feature Extraction
 Training Standard
 No Average Skewness Kurtosis Energy Entropy Smoothness
 Data Deviation
 1 AL01.jpg 155,0965 38,19906 -0,23145 -2,9991 0,009206 4,810881 0,021948
 2 AL02.jpg 148,5776 43,29244 -0,63556 -2,99832 0,008138 4,933428 0,028016
 3 AL03.jpg 146,2624 28,92958 -0,0496 -2,99966 0,009959 4,682458 0,012707
 . ... ... ... ... ... ... ... ...
 100 FR50.jpg 143,8043 57,36483 -0,58149 -2,99521 0,005624 5,252808 0,048169

 The following table shows the results of the LVQ (Learning Vector Quantization) classification on
the training data with each of the parameters mentioned in the subsection above.
 Table 3. Training Data Recognition
 Decrease Learning Learning Rate Recognition (%)
 Epoch
 Rate (Dec alpha) (Alpha)
 0.1 180 87
 0.01 135 87
 0.05 0.001 90 88
 0.0001 45 87
 0.1 88 87
 0.01 66 87
 0.1 0.001 44 88
 0.0001 22 87
 0.1 33 89
 0.01 25 88
 0.25 0.001 17 87
 0.0001 9 87
 0.1 14 90
 0.01 10 88
 0.5 0.001 7 87
 0.0001 4 87
 0.1 7 94
 0.01 5 88
 0.75 0.001 4 87
 0.0001 2 87

 Based on the results of the performance in Table 3, the results of the accuracy of identification of
the best formaldehyde bananas using parameter with Learning Rate (Alpha) = 0.1 and decrease in
Learning Rate (Dec Alpha) = 0.75 with the smallest iteration of 7, with the highest percentage result of
94%. The next step is to test with test data, this test is carried out to determine the closest distance
between the test data and the final weight of each class. The following is the calculation of accuracy,
precision and recall on the test data with each parameter.
 Table 4. Accuracy, Precision and Recall Result On Test Data
 Dec Alpha Alpha Accuracy Precision Recall
 0.1 81.81% 73.33% 100%
 0.01 81.81% 73.33% 100%
 0.05 0.001 86.36% 78.57% 100%
 0.0001 86.36% 78.57% 100%
 0.1 81.81% 73.33% 100%
 0.01 81.81% 73.33% 100%
 0.1 0.001 86.36% 78.57% 100%
 0.0001 86.36% 78.57% 100%
 0.1 86.36% 78.57% 100%
 0.01 86.36% 78.57% 100%
 0.25 0.001 86.36% 78.57% 100%
 0.0001 86.36% 78.57% 100%

 Musa, Akbar (Identification of Formaldehyde Bananas using Learning Vector Quantization)
Indonesian Journal of Information Systems (IJIS) 169
 Vol. 3, No. 2, February 2021

 0.1 86.36% 78.57% 100%
 0.01 86.36% 78.57% 100%
 0.5 0.001 86.36% 78.57% 100%
 0.0001 86.36% 78.57% 100%
 0.1 90.90% 84.61% 100%
 0.01 86.36% 78.57% 100%
 0.75 0.001 86.36% 78.57% 100%
 0.0001 86.36% 78.57% 100%

 Accuracy Precision Recall

 0,1 0,01 0,001 0,0001 0,1 0,01 0,001 0,0001 0,1 0,01 0,001 0,0001

 95 90 110
 90 85 100
 80
 85 90
 75
 80 80
 70
 75 65 70
 70 60 60
 0,05 0,1 0,25 0,5 0,75 0,05 0,1 0,25 0,5 0,75 0,05 0,1 0,25 0,5 0,75
 Learning Rate Learning Rate Learning Rate

 Figure 8. Confusion Matrix Result
 From the test results shown above, the best accuracy is obtained at learning rate (Alpha) of 0.1,
decrease in learning rate (Dec Alpha) of 0.75 with the smallest iteration of 7 obtaining the result of
90.90% accuracy, 84.61% precision and 100% recall.

5. Conclusion
In this article, the identification of formalin bananas using LVQ has been presented. Based on the data
of study and discussion results that has been described, there are several important things that can be
concluded from this study. From 122 banana images, 100 images are training data and 22 images are
test data. Testing with the LVQ (Learning Vector Quantization) algorithm to identify formaldehyde
bananas is able to produce 94% accuracy on training data and 90.90% accuracy, 84.61% precision,
100% recall on test data. The best parameters of training rate and decreasing of training rate are 0.1 and
0.75, respectively.

References

[1] F. S. P. NG, "A brief history of bananas," Agriculture Utar Science Journal, vol. I, no. 1, pp. 1-
 9, 2015.
[2] B. Blandina, L. A. M. Siregar and H. Setiado, "Identifikasi Fenotipe Pisang Barangan (Musa
 Acuminata Linn) di Kabupaten Deli Sedang Sumatra Utara," Jurnal Agroekoteknologi FP USU,
 vol. 7, no. 1, pp. 94-105, 2019.
[3] R. DokterSehat, "Artikel Kesehatan," 15 November 2018. [Online]. Available:
 https://doktersehat.com.
[4] I. A. Sabilla, C. S. Wahyuni, C. Fatichah and D. Herumurti, "Determining Banana Types and
 Ripeness from Image using Machine Learning Methods," IEEE, pp. 409-410, 2019.
[5] S. F. R. Abdullah and R. Passarella, "Identifikasi Tanaman Buah Bedasarkan Fitur Bentuk,
 Warna, dan Tekstur Daun Bebasis Pengolahan Citra dan Learning Vector Quantization (LVQ),"

 Musa, Akbar (Identification of Formaldehyde Bananas using Learning Vector Quantization)
Indonesian Journal of Information Systems (IJIS) 170
Vol. 3, No. 2, February 2021

 Prosiding Annual Research Seminar 2017, Computer Science and ICT, vol. 3, no. 1, pp. 65-69,
 2017.
[6] J. Waldchen and P. Mader, "Plant Species Identification Using Computer Vision Techniques: A
 Systematic Literature Review," Arch Computat Methods Eng, pp. 1-37, 2017.
[7] N. Bhatia and V. , "Survey of Nearest Neighbor Techniques," (IJCSIS) International Journal of
 Computer Science and Information Security, vol. 8, no. 2, pp. 302-305, 2010.
[8] J. Du, D. Huang, X. Wang and X. Gu, "Shape Recognition Based on Radial Basis Probabilistic
 Neural Network and Application to Plant Species Identification," in Advanced in Neural Network
 , pp. 281-285, 2005.
[9] X. Zhang, F. An, L. Chen, I. Ishi and J. H. Mattausch, "A Modular and Reconfigurable Pipeline
 Architecture for Learning Vector Quantization," IEEE TRANSACTIONS ON CIRCUITS AND
 SYSTEMS-I; REGULAR PAPERS, pp. 3312 - 3325, 2018.
[10] T. S. Lim, W. Y. Loh and Y. S. Shih, "A Comparison of Prediction Accuracy, Complexity, and
 Training Time of Thirty-Three Old and New Classification Algorithms," Machine Learning, vol.
 40, no. 3, pp. 203-228, 2000.
[11] F. S. Faisal, T. F. M. Butarbutar and P. Sirait, "Implementasi CNN dan SVM untuk Identifikasi
 Penyakit Tomat via Daun," Jurnal SIFO Mikroskil, p. 18, 2019.
[12] MathWorks, "Support: Documentation," 21 juli 2020. [Online]. Available:
 http://mathworks.com.
[13] A. Kadir and A. Susanto, "Teori dan Aplikasi Pengolahan Citra," in Teori dan Aplikasi
 Pengolahan Citra, Yogyakarta, CV.ANDI OFFSET (Penerbit Andi), 2013, pp. 534-535.
[14] R. Rizaldi, A. Kurniawati and C. V. Angkoso, "Implementasi Metode Euclidena Distance Untuk
 Rekomendasi Ukuran Pakaian Pada Aplikasi Ruang Ganti Pakaian," Jurnal Teknologi Informasi
 dan Ilmu Komputer (JTIIK), pp. 132-133, 2018.
[15] A. Robbinson, "How to Calculate Euclidean Distance," SCIENCING, 31 May 2013. [Online].
 Available: http://www.sciencing.com. [Accessed 17 12 2020].
[16] C. Husna, "Klasifikasi Penyakit Kanker Usus Besar (Colorectal) Menggunakan Algoritma
 Learnign Vector Quantization," Skripsi, pp. 13-15, 2018.
[17] A. P. Engelbrecht, Computational Intelligence, South Africa: WILEY, 2007.
[18] K. S. Nugroho, "Medium: Confusion Matrix untuk Evaluasi Model pada Supervised Learning,"
 13 November 2019. [Online]. Available: http://www.medium.com.
[19] S. Narkhede, "Understanding Confusion Matrix," 23 Juli 2018. [Online]. Available:
 http://towardsdatascience.com.

 Musa, Akbar (Identification of Formaldehyde Bananas using Learning Vector Quantization)
You can also read


