Hydrometeorological data from Marmot Creek Research Basin, Canadian Rockies
←
→
Page content transcription
If your browser does not render page correctly, please read the page content below
Earth Syst. Sci. Data, 11, 455–471, 2019
https://doi.org/10.5194/essd-11-455-2019
© Author(s) 2019. This work is distributed under
the Creative Commons Attribution 4.0 License.

        Hydrometeorological data from Marmot Creek Research
                     Basin, Canadian Rockies
                   Xing Fang, John W. Pomeroy, Chris M. DeBeer, Phillip Harder, and Evan Siemens
                 Centre for Hydrology and Global Institute for Water Security, University of Saskatchewan,
                                             Saskatoon, S7N 1K2, Canada
                                    Correspondence: Xing Fang (xing.fang@usask.ca)

                                Received: 26 September 2018 – Discussion started: 12 October 2018
                           Revised: 1 March 2019 – Accepted: 18 March 2019 – Published: 10 April 2019

       Abstract. Meteorological, snow survey, streamflow, and groundwater data are presented from Marmot Creek
       Research Basin, Alberta, Canada. The basin is a 9.4 km2 , alpine–montane forest headwater catchment of the
       Saskatchewan River basin that provides vital water supplies to the Prairie Provinces of Canada. It was heav-
       ily instrumented, experimented upon, and operated by several federal government agencies between 1962 and
       1986, during which time its main and sub-basin streams were gauged, automated meteorological stations at mul-
       tiple elevations were installed, groundwater observation wells were dug and automated, and frequent manual
       measurements of snow accumulation and ablation and other weather and water variables were made. Over this
       period, mature evergreen forests were harvested in two sub-basins, leaving large clear cuts in one basin and
       a “honeycomb” of small forest clearings in another basin. Whilst meteorological measurements and sub-basin
       streamflow discharge weirs in the basin were removed in the late 1980s, the federal government maintained the
       outlet streamflow discharge measurements and a nearby high-elevation meteorological station, and the Alberta
       provincial government maintained observation wells and a nearby fire weather station. Marmot Creek Research
       Basin was intensively re-instrumented with 12 automated meteorological stations, four sub-basin hydrometric
       sites, and seven snow survey transects starting in 2004 by the University of Saskatchewan Centre for Hydrology.
       The observations provide detailed information on meteorology, precipitation, soil moisture, snowpack, stream-
       flow, and groundwater during the historical period from 1962 to 1987 and the modern period from 2005 to the
       present time. These data are ideal for monitoring climate change, developing hydrological process understand-
       ing, evaluating process algorithms and hydrological, cryospheric, or atmospheric models, and examining the
       response of basin hydrological cycling to changes in climate, extreme weather, and land cover through hydro-
       logical modelling and statistical analyses. The data presented are publicly available from Federated Research
       Data Repository (https://doi.org/10.20383/101.09, Fang et al., 2018).

1   Introduction                                                  the Saskatchewan River headwaters (Neill, 1980; Rothwell et
                                                                  al., 2016). The Eastern Slopes (Alberta) Watershed Research
The eastern slopes of the Canadian Rocky Mountains form           Program (AWRP) was created in 1960 to investigate rela-
the headwaters of the Saskatchewan River basin (SRB),             tionships between forest, soil, climate, and water and to ex-
whose water supplies are vital to domestic, agricultural, and     amine the impacts of commercial timber harvesting practices
industrial users in the Canadian Prairie Provinces. These         on basin water yield and water quality (Jeffrey, 1965; Kirby
mountain headwaters occupy about 12.6 % of total drainage         and Ogilvy, 1969). This program was a collaborative effort
area but generate 87 % of total water yield in the SRB (Red-      between several provincial and federal government agencies
mond, 1964). Recognising the importance of these headwa-          to establish experimental watersheds in the headwaters, one
ters, the Eastern Rocky Mountain Forest Conservation Act          of which was the establishment of what was then called the
was passed in 1947, which aimed to conserve and protect

Published by Copernicus Publications.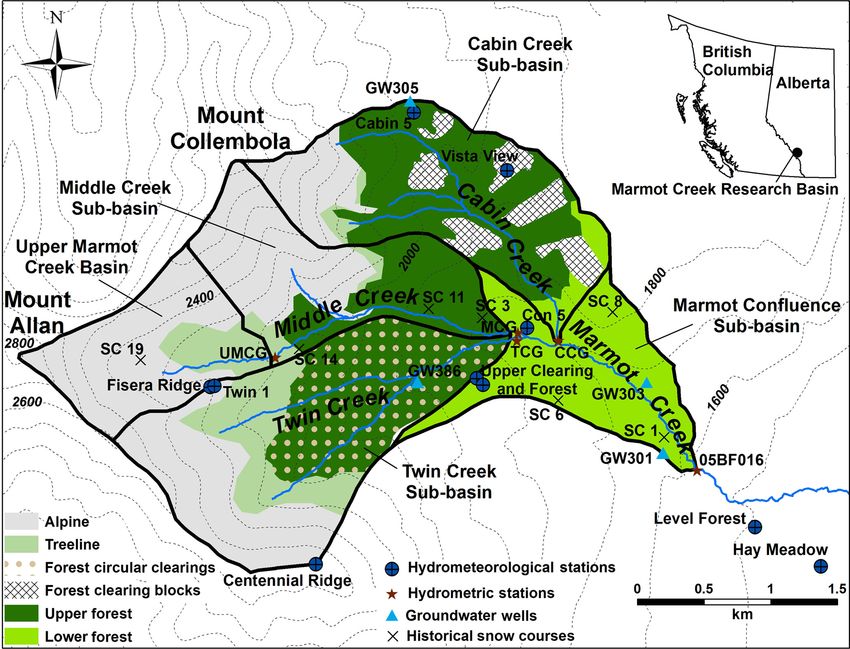
456                                            X. Fang et al.: Hydrometeorological data from Marmot Creek Research Basin

“Marmot Creek Experimental Watershed” during 1961–1962             ment with respect to local wind and topography (MacDon-
(Rothwell et al., 2016). This later became the University          ald et al., 2010), alpine snowmelt runoff generation (DeBeer
of Saskatchewan-operated “Marmot Creek Research Basin”             and Pomeroy, 2017), hillslope hydrology of the forest or-
(MCRB) by which it is referred to in this paper.                   ganic layer (Keith et al., 2010), and precipitation phase parti-
   During the historical period of 1962–1986, a paired-basin       tioning (Harder and Pomeroy, 2013). MCRB has also been
experiment devised by the Canadian Forestry Service (CFS)          the site of instrument or methodology development, from
explored the effects of forest cutting on snow accumulation        an early airborne lidar snow depth measurement (Hopkin-
and water yield in MCRB. Two types of forest clearing ex-          son et al., 2012) to acoustic measurements of snow (Kinar
periment were conducted in the sub-alpine spruce–fir for-          and Pomeroy, 2009) as well as early telescope-based snow
est part of the basin (Fig. 1): six large “commercial” for-        surveys (Kinar and Pomeroy, 2015). Utilising the Cold Re-
est cut blocks were harvested in the Cabin Creek sub-basin         gions Hydrological Modelling platform (CRHM) these ad-
during 1971–1972 and a “honeycomb” of numerous small               vances have been synthesised into a physically based hydro-
circular clearings, each 12 to 18 m in diameter, were har-         logical model of MCRB (Fang et al., 2013), which was used
vested in the Twin Creek sub-basin during 1977–1979, with          to assess the impact of forest disturbances on basin hydrol-
Middle Creek left intact as a control sub-basin (Rothwell          ogy (Pomeroy et al., 2012), analyse antecedent conditions
et al., 2016). Snow accumulation increased by 21 % in the          on flood generation (Fang and Pomeroy, 2016), and diag-
large forest cutting blocks (Swanson et al., 1986) and 28 %        nose rain-on-snow runoff generation for an alpine environ-
in the small forest clearings compared to under adjacent in-       ment during the 2013 flood in MCRB (Pomeroy et al., 2016).
tact forest canopies (Swanson and Golding, 1982). Over-               This paper includes datasets of meteorological, snow sur-
all, there was no statistically significant change in stream-      vey, streamflow, and groundwater observations measured in
flow that could be associated with the forestry manipulations      MCRB. Meteorological datasets include historical observa-
(Harder et al., 2015). Several other studies were carried out in   tions by the CFS and ECCC and recent measurements by
parallel to the forest clearing experiments. Investigations on     the University of Saskatchewan Centre for Hydrology. Con-
soil water storage and soil temperature in relation to snow ac-    tinuous records of streamflow measurements by ECCC and
cumulation and melt, forest, and slope orientation were con-       the University of Saskatchewan as well as groundwater lev-
ducted at several sites in MCRB and provided some early            els monitored by AEP are also included. The snow sur-
understanding of infiltration and runoff in the basin (Har-        vey data presented were conducted in clearings, under for-
lan, 1969; Hillman and Golding, 1981). Extensive field cam-        est canopies, and on hillslopes at various elevations and are
paigns throughout MCRB produced detailed descriptions of           useful for model evaluation and snow process studies. Some
soils (Beke, 1969) and surficial geology (Stevenson, 1967).        of the studies utilising these datasets document the basin re-
Additional studies were undertaken to assess the basin’s           silience to changes in climate, extreme weather, and land
meteorology (Munn and Storr, 1967; Storr, 1967, 1973).             cover (Harder et al., 2015), a sensitivity analysis of climate
Most hydrometeorological observations in MCRB ceased af-           warming on snow processes (Pomeroy et al., 2015), and as-
ter 1986 due to the opening of the adjacent Nakiska Ski            sessments of variability of climate and its impact on the hy-
Resort in the 1986–1987 ski season and subsequent hosting          drological processes (Siemens, 2016).
of 1988 Winter Olympic Games; only streamflow measure-
ments at the main outlet by Environment and Climate Change
Canada (ECCC), and groundwater measurements by Alberta             2   Site description
Environment and Parks (AEP), were continued, though a
high-elevation weather station was established on Centennial       Marmot Creek Research Basin (MCRB) (50.95◦ N,
Ridge by ECCC, and Alberta Agriculture and Forestry main-          115.15◦ W) is in the headwaters of the Bow River basin in
tained a nearby valley-bottom weather station (Rothwell et         the Front Ranges of the Canadian Rocky Mountains (Fig. 1)
al., 2016).                                                        and its streamflow discharges into the Kananaskis River.
   After the Olympics, research activities in MCRB were            The basin area (9.4 km2 ) is defined by the Water Survey of
minimal until 2004 when the research basin was reactivated         Canada stream gauge that was installed in 1962 (Bruce and
by the University of Saskatchewan with the help of the Uni-        Clark, 1965). MCRB is composed of three upper sub-basins:
versity of Calgary and ECCC. Wide-ranging research has             Cabin Creek (2.35 km2 ), Middle Creek (2.94 km2 ), and
been conducted since then to improve the understanding of          Twin Creek (2.79 km2 ), which converge into the confluence
the impact of forest canopy and forest clearings on snow           sub-basin above the main stream gauge (1.32 km2 ). Upper
accumulation and snowmelt energetics (Ellis and Pomeroy,           Marmot Creek is an upper sub-basin of Middle Creek
2007; Essery et al., 2008; Pomeroy et al., 2009; Ellis et          (1.178 km2 ), is primarily alpine, and is also gauged. Based
al., 2013; Musselman and Pomeroy, 2017), slope and as-             on a resampled 2007 lidar 8 m digital elevation model
pect controls on snow accumulation and melt (DeBeer and            (DEM) (Hopkinson et al., 2012), hypsometric curves were
Pomeroy, 2009; Ellis et al., 2011; Marsh et al., 2012), blow-      derived for MCRB and its three sub-basins (Fig. 2). Eleva-
ing snow and sublimation in the alpine treeline environ-           tion ranges from 1590 m a.s.l. (above sea level) at the main

Earth Syst. Sci. Data, 11, 455–471, 2019                                            www.earth-syst-sci-data.net/11/455/2019/

X. Fang et al.: Hydrometeorological data from Marmot Creek Research Basin 457
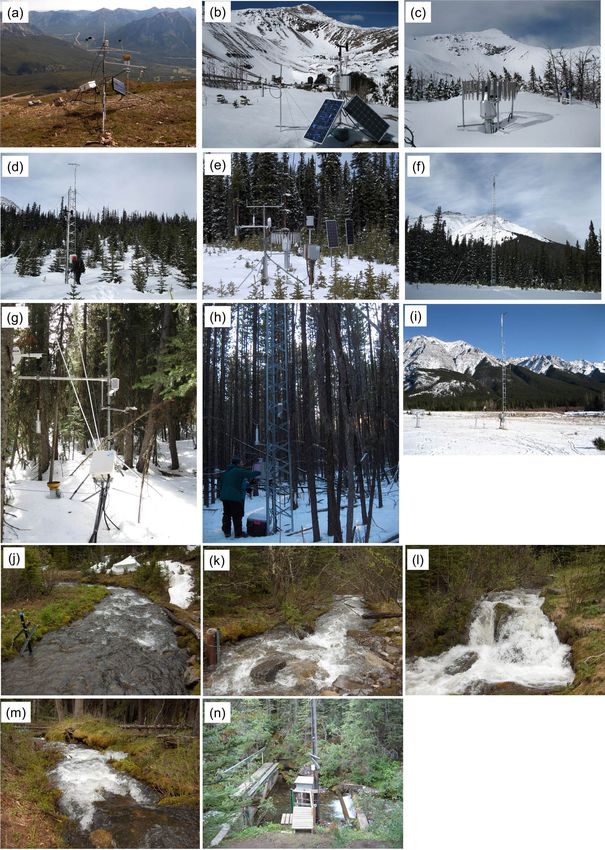
Figure 1. Location and contour map of the Marmot Creek Research Basin (MCRB), showing hydrometeorological stations, hydrometric
stations, groundwater wells and snow courses, and ecozones of the MCRB: alpine, treeline, upper forest, forest clearing blocks, forest circular
clearings, and lower forest. Note that the size and areas of circular clearings in Twin Creek are not to scale.
subalpine fir (Abies lasiocarpa) in upper-mid elevations of
the basin (1710 to 2277 m). The lower-elevation (1590 to
2015 m) forests are mainly Engelmann spruce and lodge-
pole pine (Pinus contorta var. Latifolia) with trembling aspen
(Populus tremuloides) present near the basin outlet (Kirby
and Ogilvy, 1969). Alpine larch (Larix lyallii) and short
shrubs are present around the treeline at approximately 2016
to 2379 m. Exposed rock surfaces, grasses, and talus are
present in the highest alpine part of the basin (1956 to
2829 m). Physiographic descriptions of these ecozones are
shown in Table 1 and they are mapped in Fig. 1. These eco-
zones were determined from the forest cover map by the Al-
berta Forest Service (1963) with recent updates from site vis-
its. Forest management experiments conducted in the 1970s
and 1980s left six large clear-cut blocks (1838 to 2062 m)
in the Cabin Creek sub-basin and numerous small circular
Figure 2. Hypsometric curves for the Marmot Creek Research forest clearings (1762 to 2209 m) in the Twin Creek sub-
Basin and three sub-basins showing the relationship between the basin (Golding and Swanson, 1986). These old forest clear-
elevation and percent area below the indicated elevation. cut blocks and clearings have regrown as sparse juvenile for-
est to varying degrees. The basin surface land cover GIS data
are included in the datasets.
The surficial soils are primarily poorly developed moun-
Marmot Creek gauging station to 2829 m at the summit tain soils consisting of glaciofluvial, surficial till, and post-
of Mount Allan. The 8 m resampled lidar DEM, sub-basin glacial colluvium deposits (Beke, 1969). Relatively imper-
stream network, and sub-basin boundary GIS data are also meable bedrock is found at the higher elevations, whilst the
included in the datasets. rest of the basin is covered by a deep layer of coarse and per-
Most of MCRB is covered by needleleaf vegetation, which meable soil allowing for rapid rainfall infiltration to subsur-
is dominated by Engelmann spruce (Picea engelmannii) and
www.earth-syst-sci-data.net/11/455/2019/ Earth Syst. Sci. Data, 11, 455–471, 2019
458                                             X. Fang et al.: Hydrometeorological data from Marmot Creek Research Basin

Table 1. Area and mean elevation, aspect, and slope for ecozones at the Marmot Creek Research Basin. Note that the aspect is in degrees
clockwise from north.

                     Ecozone                                  Area    Area fraction   Elevation    Aspect    Slope
                                                             (km2 )   (% of basin)    (m a.s.l.)      (◦ )    (◦ )
                     Alpine                                  3.23             34.5      2413          110     30
                     Treeline                                0.93             10.0      2217           91     22
                     Upper forest                            2.75             29.3      1983          108     20
                     Forest clearing blocks                  0.40              4.3      1927          140     11
                     Forest circular clearing north-facing   0.26              2.7      1966           34     17
                     Forest circular clearing south-facing   0.24              2.6      2014          113     21
                     Lower forest                            1.42             15.2      1756          113     14

face layers overlying relatively impermeable shale (Jeffrey,          failure. In the QC data, values of −9999 denote the measure-
1965).                                                                ments removed from the raw data. In addition, daily QC soil
   Continental air masses control the weather in the region,          moisture is provided for 11 water years from the Level Forest
which has long and cold winters and cool and wet springs              station and 8 water years (WY2006 to WY2013) from Upper
with a late spring–early summer precipitation maximum.                Forest. From 19 October 2012, soil moisture is monitored at
Westerly warm and dry Chinook (foehn) winds lead to brief             a 15 min interval at Upper Forest and this higher-temporal-
periods when the air temperature exceeds 0 ◦ C during the             resolution data are included.
winter months – these events can result in snowpack abla-
tion at lower elevations. Annual precipitation ranges from
                                                                      3.2    Recent modelling data
600 mm at lower elevations to more than 1100 mm at the
higher elevations, of which approximately 70 % to 75 % oc-            Hourly modelling data were obtained by averaging the
curs as snowfall with the percentage increasing with ele-             15 min QC observations of air temperature (◦ C), relative hu-
vation (Storr, 1967). Mean monthly air temperature ranges             midity (%), wind speed (m s−1 ), incoming solar radiation
from 14 ◦ C observed at 1850 m in July to −10 ◦ C observed            (W m−2 ), and soil temperature at either 5 or 10 cm below
at 2450 m in January. Mean air temperatures have increased            ground surface (◦ C) and by summing the 15 min QC ob-
by 2.3 ◦ C from 1967 to 2013, but there are no trends in pre-         servation of precipitation (mm). Missing observations of air
cipitation or streamflow (Harder et al., 2015).                       temperature, relative humidity, wind speed, incoming solar
                                                                      radiation, and soil temperature were filled using either tem-
                                                                      poral averaging interpolation or linear regression to nearby
3     Meteorological data
                                                                      stations. When intervals of missing data were less than 3 h,
3.1    Recent quality-controlled data                                 temporal averaging was employed where the observations of
                                                                      the variable 3 h before and 3 h after the missing interval from
Quality-controlled (QC) 15 min interval hydrometeorologi-             the same station were used to calculate the average. When
cal data were processed from raw data measured at the re-             the missing data interval was longer than 3 h, linear regres-
cent stations in MCRB: Hay Meadow, Level Forest, Upper                sions were developed amongst stations using the raw data,
Clearing, Upper Clearing Tower, Upper Forest, Vista View,             the regressions were ranked based on r 2 value, and the re-
Fisera Ridge, and Centennial Ridge. Photos of these sta-              gression relationship with the highest r 2 value was selected
tions are shown in Fig. 3, and Table 2 shows a list of the            to fill in the missing data. For missing precipitation, obser-
variables in the QC data along with instrumentation, record           vations from a nearby station were used along with seasonal
length, and location for the stations. Most current stations          precipitation adjustments for elevation to fill in the missing
started measurements in 2005 and cover 11 water years (WY)            precipitation. The hourly modelling data are provided for 11
from 1 October 2005 to 30 September 2016 (WY2006 to                   water years from 1 October 2005 to 30 September 2016. As
WY2016) with two exceptions: Upper Clearing Tower and                 described in the previous section, both Fisera Ridge and Up-
Fisera Ridge; the former started data collection on 21 Octo-          per Clearing Tower stations were established after WY2006,
ber 2007 and the latter started data collection on 13 October         and the hourly modelling data before station establishment
2006. The QC data were generated by applying a quality as-            were estimated. For the Fisera Ridge station, air temperature,
surance procedure to remove erroneous data in the 15 min              relative humidity, wind speed, incoming solar radiation, and
raw data. Table 3 lists the QC thresholds used to remove              soil temperature from 1 October 2005 to 13 October 2006
(1) measurements outside of defined maximum and mini-                 were estimated based on linear interpolation to nearby sta-
mum ranges, (2) measurements that exceed a rate of change             tions, and precipitation from 1 October 2005 to 16 Septem-
(ROC) limit, and (3) constant measurements due to sensor              ber 2008 was estimated from Upper Clearing precipitation

Earth Syst. Sci. Data, 11, 455–471, 2019                                                 www.earth-syst-sci-data.net/11/455/2019/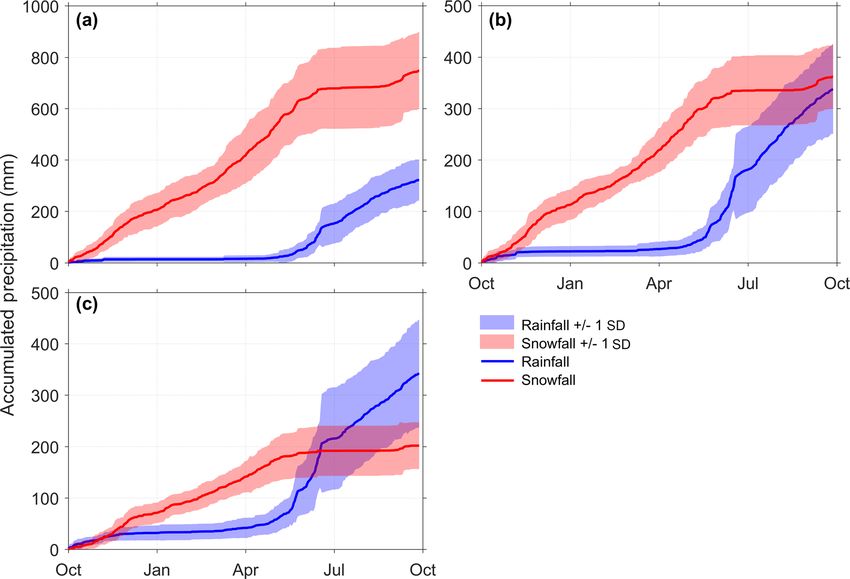
X. Fang et al.: Hydrometeorological data from Marmot Creek Research Basin                                                         459

Figure 3. Photos of Marmot Creek Research Basin hydrometeorological and hydrometric stations: (a) Centennial Ridge in July 2010
(2470 m), (b) Fisera Ridge tripod station in April 2015 (2325 m), (c) Fisera Ridge Geonor gauge in March 2011 (2325 m), (d) Vista View
in February 2011 (1956 m), (e) Upper Clearing tripod station in May 2010 (1845 m), (f) Upper Clearing Tower station in February 2011
(1845 m), (g) Upper Forest in April 2013 (1848 m), (h) Level Forest in January 2010 (1492 m), (i) Hay Meadow in February 2012 (1436 m),
(j) Upper Marmot Creek stream gauge in July 2010 (2200 m), (k) Cabin Creek stream gauge in June 2010 (1710 m), (l) Middle Creek stream
gauge in June 2010 (1754 m), (m) Twin Creek stream gauge in June 2010 (1754 m), and (n) Marmot Creek stream gauge in June 2010
(1592 m).

www.earth-syst-sci-data.net/11/455/2019/                                                Earth Syst. Sci. Data, 11, 455–471, 2019
460 X. Fang et al.: Hydrometeorological data from Marmot Creek Research Basin
Table 2. Hydrometeorological variables, instrumentation, and height from the recent stations at the Marmot Creek Research Basin. AGS and
BGS denote the distance above ground surface and below ground surface, respectively; n/a denotes not applicable.
Station Hay Meadow Level Forest Upper Upper Clearing Upper Forest Vista View Fisera Ridge Centennial
Clearing Tower Ridge
Coordinates 50.9441◦ N; 50.9466◦ N; 50.9565◦ N; 50.9565◦ N; 50.9569◦ N; 50.9712◦ N; 50.9560◦ N; 50.9571◦ N;
115.1389◦ W, 115.1464◦ W, 115.1754◦ W, 115.1754◦ W, 115.1762◦ W, 115.1722◦ W, 115.2041◦ W, 115.1930◦ W,
1436 m 1492 m 1845 m 1845 m 1848 m 1956 m 2325 m 2470 m
Record 1 Oct 2005– 10 Mar 2005– 7 Jun 2005– 21 Oct 2007– 7 Jun 2005– 1 Sep 2005– 13 Oct 2006– 24 Jul 2005–
30 Sep 2016 30 Sep 2016 30 Sep 2016 30 Sep 2016 30 Sep 2016 30 Sep 2016 30 Sep 2016 30 Sep 2016
Air temperature Vaisala Vaisala Vaisala Vaisala Vaisala Vaisala Vaisala Vaisala
(◦ C) and HMP45C212 HMP45C212 HC2-S3 HMP45C212 HMP45C212 HMP45C212 HMP45C212 HMP45C212
relative humidity
(%) AGS (m) 1.86 2.27 2.15 17 2.33 2.74 2.3 1.93
Wind speed RM Young Met One 50.5 RM Young RM Young RM Young RM Young Wind speed and RM Young
(m s−1 ) and 05305-10 05305-10 05305-10 05305-10 05105-10 direction A – 05105-10
wind sonic wind wind wind wind RM Young wind
monitor monitor monitor monitor monitor 05305-10 monitor
anemometer wind monitor
wind direction (◦ ) wind speed B –
three-cup anemometer
AGS (m) 7 2.45 2.85 18 2.77 4.11 A – 2.55 2.41
Snow depth (m) SR50 SR50 SR50 n/a SR50 SR50 SR50 SR50
AGS (m) 1.65 1.04 1.76 1.63 1.59 1.19 1.03
Soil temperature K-type K-type K-type n/a K-type K-type CS 107B CS 107B
(◦ C) thermocouple thermocouple thermocouple thermocouple thermocouple thermistor thermistor
BGS (cm) A–5 A–5 A – 10 A – 10 A–5 A–5 A–5
B – 10 B – 25 B – 20 B – 20 B – 10 B – 15 B – 15
C – 20 C – 40 C – 20
Soil heat HFT3 HFT3 HFP01 n/a n/a HFP01 HFT3 n/a
heat flux heat flux heat flux heat flux heat flux
Flux (W m−2 ) plate plate plate plate plate
BGS (cm) 10 10 10 2 10
Soil moisture CS616 soil CS616 soil n/a n/a CS616 soil n/a n/a n/a
(m3 m−3 ) moisture probe moisture probe moisture probe
BGS (cm) 15 25 25
Incoming solar Kipp and Kipp and Kipp and Kipp and Kipp and Apogee Kipp and Li-cor LI200s
radiation (W m−2 ) Zonen Zonen Zonen Zonen CM21 Zonen CS300-L Zonen shortwave
AGS (m) CM3 CM3 CM3 pyranometer, CM3 pyranometer, CM3 radiometer
pyranometers pyranometers pyranometers 20 pyranometers 1.97 pyranometers
Outgoing solar
radiation (W m−2 )
AGS (m) 1.95 1.31 2.33 n/a 1.95 n/a 1.45 1.37
Incoming longwave Kipp and Zonen Kipp and Zonen Kipp and Zonen Kipp and Zonen Kipp and Zonen n/a Kipp and Zonen
radiation (W m−2 ) CG1
AGS (m) CG3 CG3 CG3 pyrgeometer, CG3 CG3 n/a
pyranometers pyranometers pyranometers 20 pyranometers 1.97 pyranometers
Outgoing longwave
radiation (W m−2 )
AGS (m) 1.95 1.31 2.33 n/a 1.95 n/a 1.45 n/a
Rainfall (mm) Texas n/a Hydrological n/a Texas n/a Hydrological Texas
TE525M Services TB4 TE525M Services TB4 TE525M
rain tipping-bucket rain tipping-bucket rain
gauge rain gauge gauge rain gauge gauge
AGS (m) 2.56 2.36 0.7 4.2 1.56
All precipitation Geonor T200B n/a Geonor T200B n/a n/a n/a Geonor T200B n/a
(mm) gauge with gauge with gauge with
alter shield alter shield alter shield
AGS (m) 1.8 1.85 4.1
Barometric BP61025V n/a CS106 n/a n/a n/a n/a BP61025V
pressure pressure barometric pressure
(mb) sensor pressure sensor
sensor
AGS (m) 1.25 1.25 0.7
Earth Syst. Sci. Data, 11, 455–471, 2019 www.earth-syst-sci-data.net/11/455/2019/X. Fang et al.: Hydrometeorological data from Marmot Creek Research Basin 461
Table 3. Quality-controlled threshold values for 15 min hydrometeorological variables for current stations in MCRB; ROC and n/a denote
rate of change and not applicable, respectively.
Variable Unit Maximum Minimum ROC limit Time steps to flag
constant value
Air temperature ◦C 40 −60 10 16
Relative humidity % 100 0 30 % 16
Wind speed m s−1 30 0 n/a 16
Snow depth m 5 0 n/a n/a
Soil temperature ◦C 50 −40 10 96
Soil heat flux W m−2 1000 −500 100 16
Soil moisture fraction 1 0 0.2 16
Solar radiation W m−2 1368 0 1450 48
Longwave radiation W m−2 600 100 300 16
Precipitation mm 30 0 n/a n/a
Barometric pressure mb 1090 650 30 16
Figure 4. Annual mean daily air temperature for 11 water years Figure 5. Annual mean daily relative humidity for 11 water years
from 1 October 2005 to 30 September 2016 at MCRB stations: from 1 October 2005 to 30 September 2016 at MCRB stations:
(a) Centennial Ridge, (b) Fisera Ridge, (c) Vista View, (d) Upper (a) Centennial Ridge, (b) Fisera Ridge, (c) Vista View, (d) Upper
Clearing, (e) Upper Forest, (f) Level Forest, and (g) Hay Meadow. Clearing, (e) Upper Forest, (f) Level Forest, and (g) Hay Meadow.
The line represents the annual mean and the shaded area represents The line represents the annual mean and the shaded area represents
the standard deviation of the 11-year daily air temperature. the standard deviation of the 11-year daily relative humidity.
3.2.1 Air temperature and relative humidity
Air temperature and relative humidity were measured using
with seasonal precipitation adjustments for elevation. For the Vaisala hygrothermometers with naturally ventilated Gill ra-
Upper Clearing Tower station, the hourly incoming solar ra- diation shields at all seven stations. Table 4 shows that aver-
diation measured at 20 m above ground is provided, and from age air temperature at MCRB for the 11 water years ranges
1 October 2005 to 21 October 2007 it was estimated from from −1.6 ◦ C at the Centennial Ridge station to −0.4 ◦ C at
incoming solar radiation measured at the lower-level Upper the Fisera Ridge station. Both stations are located on alpine
Clearing tripod station based on a linear regression because ridgetops, above treeline. Higher temperatures are found at
of the location of both stations in the same forest clearing. lower elevations, where the 11-year average air temperature
Figures 4–8 show the annual mean daily air temperature, rel- is 1.4 and 3.1 ◦ C for the Upper Clearing station in a mon-
ative humidity, wind speed, incoming solar radiation, and ac- tane forest and the Hay Meadow station on the valley floor,
cumulated rainfall and snowfall with their inter-annual vari- respectively. WY2016 was the warmest, with the average wa-
ability for MCRB stations for the 11 water years. ter year air temperature being −0.3, 1.0, 2.7, and 4.4 ◦ C for
www.earth-syst-sci-data.net/11/455/2019/ Earth Syst. Sci. Data, 11, 455–471, 2019462 X. Fang et al.: Hydrometeorological data from Marmot Creek Research Basin
Figure 8. Annual mean daily accumulated rainfall and snowfall
for 11 water years from 1 October 2005 to 30 September 2016 at
Figure 6. Annual mean daily wind speed for 11 water years from MCRB stations: (a) Fisera Ridge, (b) Upper Clearing, and (c) Hay
1 October 2005 to 30 September 2016 at MCRB stations: (a) Cen- Meadow. The line represents the annual mean and the shaded area
tennial Ridge, (b) Fisera Ridge, (c) Vista View, (d) Upper Clearing, represents the standard deviation of the 11-year daily accumulated
(e) Upper Forest, (f) Level Forest, and (g) Hay Meadow. The line rainfall and snowfall. Rainfall and snowfall are calculated from
represents the annual mean and the shaded area represents the stan- wind-corrected storage-gauge observations with precipitation phase
dard deviation of the 11-year daily wind speed. calculated as per Harder and Pomeroy (2013).
tively humidity from Fisera Ridge station is shown in Fig. 9a
and b.
3.2.2 Wind speed
Wind speeds were measured at all seven stations using
propeller-type RM Young anemometers. The 11-water-year
average wind speeds on wind-exposed alpine ridges are 5.8
and 2.5 m s−1 at Centennial Ridge measured (2.41 m a.g.s.,
above ground surface) and Fisera Ridge (2.55 m a.g.s.) sta-
tions, respectively. Hay Meadow, located on an open grass-
land valley floor (7 m a.g.s.) has an 11-water-year average
wind speed of 2.0 m s−1 . Vista View station (4.11 m a.g.s.)
is located in a large forest cut block with a short sparse forest
cover of young trees and has an 11-water-year average wind
Figure 7. Annual mean daily incoming solar radiation for 11 water speed of 1.1 m s−1 . For the wind-sheltered stations (Upper
years from 1 October 2005 to 30 September 2016 at MCRB stations: Clearing measured at 2.85 m a.g.s, Upper Forest measured
(a) Centennial Ridge, (b) Fisera Ridge, (c) Upper Clearing Tower,
at 2.77 m a.g.s, and Level Forest measured at 2.45 m a.g.s),
and (d) Hay Meadow. The line represents the annual mean and the
the 11-water-year average wind speeds range from 0.1 to
shaded area represents the standard deviation of the 11-year daily
incoming solar radiation. 0.6 m s−1 . The maximum hourly wind speed recorded dur-
ing 11 water years is 37.9 m s−1 from the Centennial Ridge
station. An example of hourly wind speed from the Fisera
Ridge station is shown in Fig. 9c.
the Centennial Ridge, Fisera Ridge, Upper Clearing, and Hay
Meadow stations, respectively. WY2008 was the coolest for 3.2.3 Incoming solar radiation
the Centennial Ridge and Fisera Ridge stations, with average
air temperatures of −2.7 and −1.7 ◦ C, respectively; whereas Incoming solar radiation was measured at all seven stations
WY2011 was the coolest for the Upper Clearing and Hay using Kipp and Zonen pyranometers and is included in the
Meadow stations, with average air temperatures of 0.4 and hourly modelling dataset except for the Vista View station
1.9 ◦ C for the Upper Clearing and Hay Meadow stations, re- due to short length of measurement. For the Upper Clearing
spectively. An example of hourly air temperature and rela- site, hourly incoming solar radiation measured at the top of
Earth Syst. Sci. Data, 11, 455–471, 2019 www.earth-syst-sci-data.net/11/455/2019/X. Fang et al.: Hydrometeorological data from Marmot Creek Research Basin 463
Table 4. Mean water year air temperature and total water year precipitation from the current stations at the Marmot Creek Research Basin.
Values inside parentheses are total water year snowfall.
Water year Mean air temperature (◦ C) Total precipitation (mm)
Centennial Fisera Vista Upper Upper Hay Level Fisera Upper Hay
Ridge Ridge View Clearing Forest Meadow Forest Ridge Clearing Meadow
2006 −1.2 0.1 2.9 2.3 1.7 4.0 4.0 902 (551) 646 (306) 492 (155)
2007 −1.7 −0.5 2.2 1.5 0.8 3.3 3.4 1215 (815) 797 (421) 631 (196)
2008 −2.7 −1.7 0.8 0.6 0.0 2.3 2.4 1218 (926) 804 (421) 693 (231)
2009 −1.4 −0.7 1.4 1.0 0.4 2.8 2.8 944 (638) 610 (332) 450 (210)
2010 −2.1 −1.0 0.6 0.6 0.0 2.6 2.4 1140 (904) 670 (410) 476 (205)
2011 −2.4 −1.2 0.4 0.4 −0.2 1.9 1.8 1128 (865) 671 (396) 522 (271)
2012 −1.4 −0.2 1.5 1.6 1.0 3.6 3.6 1247 (922) 794 (419) 586 (201)
2013 −1.5 −0.2 1.3 1.4 1.1 3.1 3.0 1329 (794) 868 (320) 762 (207)
2014 −2.1 −0.8 0.7 0.5 0.2 2.2 2.1 877 (658) 650 (419) 510 (267)
2015 −0.4 0.9 2.3 2.5 2.2 4.2 4.2 857 (543) 593 (272) 440 (163)
2016 −0.3 1.0 2.4 2.7 2.4 4.4 4.5 939 (614) 591 (268) 426 (118)
11-water-
year mean −1.6 −0.4 1.5 1.4 0.9 3.1 3.1 1070 (748) 699 (362) 545 (202)
the 20 m tower station is provided in addition to that from Table 4 shows that the average annual precipitation for the
the main tripod station near the ground (1.95 m). For the sub- 11 water years is 627 mm (229 mm snow), 839 mm (443 mm
canopy measurements at the Upper Forest (i.e. mature spruce snow), and 1190 mm (802 mm snow) for Hay Meadow, Up-
forest) and Level Forest (i.e. mature lodgepole forest) sta- per Clearing, and Fisera Ridge, respectively. The highest an-
tions, the 11-water-year mean values range from 15.9 W m−2 nual precipitation during the 11 water years from the Fisera
(Upper Forest) to 23.7 W m−2 (Level Forest). For the stations Ridge station was 1329 mm in WY2013 when approximately
not affected by forest canopy, the 11-water-year mean value 250 mm of rainfall and snowfall fell during the June 2013
ranges from 140.1 W m−2 (Upper Clearing 20 m tower) to flood (Pomeroy et al., 2016), which also produced the highest
150.3 W m−2 (Fisera Ridge). An example of hourly incom- annual rainfall (535 mm) recorded during the 11 water years.
ing solar radiation from the Fisera Ridge station is shown in An example of hourly cumulative precipitation, divided into
Fig. 9d. rainfall and snowfall from the Fisera Ridge station, is shown
in Fig. 9f.
3.2.4 Soil temperature
Soil temperature was measured using thermistors at all seven 3.3 Historical modelling data
stations at either 5 or 10 cm below ground surface. The
11-water-year mean value ranges from −0.7 ◦ C (Centennial Historical meteorological data are available from the
Ridge) to 6.5 ◦ C (Hay Meadow). The maximum hourly soil three sites shown in Fig. 1. Observations from Conflu-
temperature during 11 water years was 36.6 ◦ C at the Hay ence 5 (Con 5, 50.960◦ N, 115.171◦ W, 1770 m), Cabin 5
Meadow station and the minimum hourly soil temperature (50.975◦ N, 115.182◦ W, 2051 m), and Twin 1 (50.957◦ N,
during 11 water years was −16.5 ◦ C at the Centennial Ridge 115.204◦ W, 2285 m) are provided. These sites were estab-
station. An example of hourly soil temperature from the Fis- lished in the early 1960s by the CFS and ECCC. Based on
era Ridge station is shown in Fig. 9e. the availability of data, continuous records of hourly air tem-
perature (◦ C), relative humidity (%), wind speed (m s−1 ),
and daily precipitation (mm) are included for 18 water years
3.2.5 Precipitation
from 1 October 1969 to 30 September 1987. Air temperature
Precipitation was measured with Alter-shielded Geonor and relative humidity were measured by thermographs or hy-
T200B weighing precipitation gauges at the Hay Meadow, grothermographs (Munn and Storr, 1967); wind speed was
Upper Clearing, and Fisera Ridge stations, and it was cor- measured by an MSC-type 45B anemometer, and for precip-
rected for wind-induced undercatch for the wind-exposed itation, Leupold-Stevens Q12M weighing gauges and MSC
Fisera Ridge and Hay Meadow stations (Smith, 2007). Pre- (Meteorological Service of Canada) tipping-bucket gauges
cipitation is divided into rainfall and snowfall based on the were used to take measurements for snowfall and rainfall,
psychrometric energy balance precipitation phase determi- respectively (Storr, 1973). Data quality assurance was under-
nation method developed by Harder and Pomeroy (2013). taken to generate the continuous data from the original obser-
www.earth-syst-sci-data.net/11/455/2019/ Earth Syst. Sci. Data, 11, 455–471, 2019464 X. Fang et al.: Hydrometeorological data from Marmot Creek Research Basin
vations, which includes removing inconsistent measurements ments at outlets of Cabin, Middle, and Twin Creeks ceased in
and outliers, filling missing data with linear regressions to June 2013 as all three gauging stations (and 2013 data hold-
nearby stations. Details regarding the quality assurance are ing data loggers) were destroyed in June 2013. The sites are
provided by Siemens (2016). The original measured data are now difficult to access as the road was destroyed, the chan-
also provided for these sites. nels are unstable, and access trails are covered with fallen
trees. Flow depth was continuously measured at 15 min inter-
vals with automated pressure transducers, and velocity was
4 Snow survey data
manually measured with a handheld SonTek FlowTracker
4.1 Recent snow survey data
acoustic Doppler velocimeter every few weeks from spring
to autumn. Discharge at 15 min intervals is calculated based
Snow survey data collected from transects near the recent on rating curves from continuous flow depth and frequently
meteorological stations Hay Meadow, Level Forest, Upper manually measured velocity throughout the spring, summer,
Clearing, Upper Forest, Vista View, and Fisera Ridge are and autumn. Hourly average streamflow (m3 s−1 ) is esti-
provided for nine WYs from 2007 to 2016, except for the mated from the 15 min discharge and is provided for Cabin,
Hay Meadow in WY 2007 when no measurements were Middle, and Twin Creeks from 2007 to 2012, Upper Marmot
taken. The snow survey data include snow depth, density, Creek from 2007 to 2016, and Marmot Creek from 26 June
and snow water equivalent (SWE). In addition, the snow sur- 2013 to 2016.
vey data contain field notes on land cover information of
each snow survey transect. The snow surveys usually oc- 5.2 Historical streamflow data
cur monthly during the winter accumulation period and fort-
nightly to weekly during the spring melt period. Snow depth Daily average streamflow (m3 s−1 ) was estimated for Cabin
was measured by a 1 m ruler for shallow snowpack or a 3 m Creek, Middle Creek, Twin Creek, and Upper Marmot Creek
measuring probe for deep snowpacks, and snow density was for the historical period from 1963 to 1986. Streamflow mea-
measured using an ESC30 snow tube for shallow snowpacks surements were made by ECCC’s Water Survey of Canada at
or a Mount Rose snow sampler for deeper snowpacks. At the outlets of the respective sub-basins: Cabin Creek gauge
each transect, snow depth was observed at 5 m intervals, and (CCG, 05BF019), Middle Creek gauge (MCG, 05BF017),
one snow density was collected for every five depth measure- Twin Creek gauge (TCG, 05BF018), and Upper Marmot
ments. Creek gauge (UMCG, 05BF020) shown in Fig. 1. Year-round
streamflow discharge was estimated using stage records from
flow through V-notch weirs on Middle and Twin Creeks and
4.2 Historical snow survey data an H-flume on Cabin and Upper Marmot Creeks (Canadian
Snow survey data collected by CFS from seven snow courses Forestry Service, 1976; Harder et al., 2015). The Upper Mar-
(SCs): 1, 3, 6, 8, 11, 14, and 19 are provided for the water mot gauge is located higher up the Middle Creek sub-basin
years from 1963 to 1986. The location of these snow courses and captures the streamflow generated from a predominantly
is shown in Fig. 1, and a brief description for each snow alpine area. The record for Upper Marmot Creek is sporadic
course is listed in Table 5. Regular measurements were car- due to the ephemeral nature of Middle Creek at this location
ried out monthly from February to June, and each course con- and site access challenges.
sisted of 10 staked points where snow depth and snow wa- For the Marmot Creek outlet, streamflow was measured
ter equivalent were measured. In some years, measurements by ECCC at the Marmot Creek basin outlet V-notch gaug-
were conducted more than once per month, which provided ing station (05BF016). The streamflow data span from 1962
more details of seasonal snow accumulation. Both monthly to 19 June 2013 and are continuous until 1986 and seasonal
snow survey data from 1963 to 1986 and detailed survey data thereafter. However, the gauging station was severely dam-
from measurements more than once per month during 1963 aged in the June 2013 flood (Pomeroy et al., 2016), after
to 1980 are included for the historical period. An example of which no measurements have been made by ECCC. The Uni-
mean transect SWE from historical and recent snow surveys versity of Saskatchewan restored discharge measurements at
for alpine and montane forest sites is shown in Fig. 10. this site on 26 June 2013 as described in the previous sec-
tion. The daily average streamflow data for all sub-basins
and Marmot Creek can be searched and then accessed from
5 Streamflow data the ECCC Water Survey of Canada “historical hydrometric
data search” website at https://wateroffice.ec.gc.ca/search/
5.1 Recent streamflow data historical_e.html (last access: 1 October 2018). The Water
Recently streamflow observations were made by the Univer- Survey of Canada is preparing to restore this gauge in the
sity of Saskatchewan starting in spring 2007 at the sub-basin near future.
outlets of Cabin, Middle, Twin, and Upper Marmot Creeks
and at the basin outlet after the June 2013 flood. Measure-
Earth Syst. Sci. Data, 11, 455–471, 2019 www.earth-syst-sci-data.net/11/455/2019/X. Fang et al.: Hydrometeorological data from Marmot Creek Research Basin 465 Figure 9. Example of hourly-averaged forcing data from the Fisera Ridge station showing (a) air temperature, (b) relative humidity, (c) wind speed, (d) soil temperature, and (e) rainfall and snowfall for water years starting 1 October. All data are developed from observations except rainfall and snowfall, which are calculated from wind-corrected storage-gauge observations with precipitation phase calculated as per Harder and Pomeroy (2013). Figure 10. Example of mean transect snow accumulation (SWE) from (a) alpine and (b) montane forest snow survey transects. The historical SWE for alpine and montane forest is from SC 19 and SC 3 transects, respectively. The recent SWE for alpine and montane forest is from Fisera Ridge above treeline transects and Upper Clearing forest section transects, respectively. www.earth-syst-sci-data.net/11/455/2019/ Earth Syst. Sci. Data, 11, 455–471, 2019
466                                             X. Fang et al.: Hydrometeorological data from Marmot Creek Research Basin

Table 5. Historical snow courses (SCs) at the Marmot Creek Research Basin from description by Fisera (1977).

                Snow course    Description
                1              East-sloping lodgepole pine about 9 m tall with natural openings
                3              Gently south-sloping mature spruce, lodgepole pine, and alpine
                6              Gently northeast-sloping mature spruce, lodgepole pine, and alpine fir
                8              South sloping lodgepole pine about 6 m tall
                11             Southeast-sloping mature spruce, lodgepole pine, and alpine fir
                14             Northeast-sloping mature spruce, lodgepole pine, and alpine fir with small natural openings
                19             Variable terrains (i.e. north and south slope, flat, and gullies) above treeline

Table 6. Active groundwater wells (GWs) at the Marmot Creek Research Basin.

    GW well   Station name                        Established          Elevation (m)    Depth (m)    Aquifer            Lithology
    301       Marmot Creek Basin S5250_0301       11 October 1964             1601.4         12.2    Rocky Mountain     Sandstone
    303       Marmot Creek Basin N5475_0303       9 July 1965                 1669.1        36.58    Rocky Mountain     Sandstone
    305       Marmot Creek Basin N6770_0305       14 July 1965                 2063         11.58    Fernie             Shale
    386       Marmot Creek Basin N2507E_0386      18 November 1988             1894          12.8    Surficial          Gravel and clay

6    Groundwater data                                                  compromised as the Geonor precipitation gauge was over-
                                                                       topped on 21 June and could not be immediately accessed
Three groundwater wells (GWs), 301, 303, and 305, es-                  for maintenance due to damaged trails and roads. During the
tablished in the 1960s and one GW, 386, established in                 snowfall of 21–22 June, the depth of fresh snowpack on the
1988 are continuously monitored by AEP. The location of                ground was used to estimate precipitation based on the as-
these groundwater wells is shown in Fig. 1, and brief in-              sumption of a fresh snow density of 100 kg m−3 (Pomeroy et
formation regarding these wells is provided in Table 6.                al. 2016). Approximately 237 mm of rainfall was measured at
Daily data for these groundwater wells can be searched                 the Fisera Ridge station during 19–25 June, and an 8 cm deep
and accessed from AEP’s “Groundwater Observation Well                  snowpack developed at Fisera Ridge on 21 June and melted
Network (GOWN)” website at http://environment.alberta.ca/              after 22 June (Fig. 11c). Rainfall and snowfall rates during
apps/GOWN/. Access to the hourly groundwater well data                 the event remained less than 12 mm h−1 and were higher than
can be requested from the Groundwater Information Centre               6 mm h−1 only on 19 and 20 June, with cumulative daily to-
at gwinfo@gov.ab.ca.                                                   tals increasing from 41 mm on 19 June to 113 mm on 20 June,
                                                                       and then dropping to 77 and 18 mm on 21 and 22 June, re-
                                                                       spectively. The streamflow discharge observed at the outlet
7    Example data
                                                                       of Upper Marmot Creek remained below 0.6 mm h−1 at the
                                                                       start of the flood event on 19 June and increased steadily on
Data from the June 2013 flood are shown as an example of
                                                                       20 June, reaching a peak of 2.84 mm h−1 at 01:00 on 21 June
weather and streamflow observed in MCRB (Fig. 11). The
                                                                       and then falling to below 1 mm h−1 after 21 June for the re-
flood event started on 18 June and ended on 24 June. Air
                                                                       mainder of the flood event (Fig. 11d). Total discharge gener-
temperature observed at the Fisera Ridge station was as high
                                                                       ated at the outlet of Upper Marmot Creek was estimated to
as 8 ◦ C during rainfall on 19 June and dropped to 0.4 ◦ C dur-
                                                                       be 106 mm during 19–25 June, much of which was the result
ing snowfall on 21 June; the atmosphere became saturated
                                                                       of rain on snow in the alpine and treeline elevations.
on 18 June and stayed saturated through 21 June (Fig. 11a).
Variable wind speeds were observed at the Fisera Ridge sta-
tion, changing from relatively calm conditions on 18 June to           8   Compilation of Marmot Creek memories, real-time
4 m s−1 on 20 June, then dropping to an average of 2 m s−1                 data, and publications
before peaking at 5.5 m s−1 on 21 June (Fig. 11b). Overcast
skies persisted during much of the flood event and incoming            The Centre for Hydrology held a 50th Anniversary Work-
solar radiation observed at the Fisera Ridge station dropped           shop for MCRB in February 2013 where many of the orig-
from a peak of 533 W m−2 on 18 June to below 266 W m−2                 inal and recent researchers gave presentations on a half-
throughout the event and then rose to a peak of 1038 W m−2             century of scientific research in the basin. The centre has
on 22 June (Fig. 11b). Similar depths of precipitation fell            also compiled 120 MCRB publications and provides real-
at all elevations (1436 to 2325 m) in MCRB, with about                 time observations from many of the current meteorologi-
257 mm during 19–25 June; however, this measurement was                cal stations. The workshop presentations, publications, and

Earth Syst. Sci. Data, 11, 455–471, 2019                                                 www.earth-syst-sci-data.net/11/455/2019/
X. Fang et al.: Hydrometeorological data from Marmot Creek Research Basin 467
Figure 11. Example of hourly-averaged observations during 13–25 June 2013 from the Fisera Ridge station at the Marmot Creek Research
Basin showing (a) air temperature and relative humidity, (b) wind speed and incoming solar radiation, (c) rainfall and snow depth, and
(d) stream discharge from Upper Marmot Creek.
data can be accessed here: http://www.usask.ca/hydrology/ missing data, data measurement periods and units, and no
MarmotBasin.php. In addition, a number of recent theses measurement due to wildlife interruption. Additional GIS
contain detailed contemporary site information for Marmot shapefiles are provided to show locations of historical and
Creek Research Basin and provide results for the recent re- recent hydrometeorological and hydrometric stations as well
search conducted in the basin. These theses can help famil- as historical and recent snow survey transects.
iarise researchers with the basin and better understand its hy-
drology. Table 7 lists the theses that can be searched and ac- 10 Summary
cessed from the University of Saskatchewan’s “eCommons”
website at https://ecommons.usask.ca/. Data presented in this paper provide support to ongoing re-
search in MCRB, a mountain basin located in the Front
9 Data availability Range of the Canadian Rockies. The data include 11 water
years of hourly gap-filled air temperature, relative humidity,
All data presented in this paper are publicly avail- wind speed, precipitation, incoming solar radiation, and soil
able at the Federated Research Data Repository temperature from 1 October 2005 to 30 September 2016 as
(https://doi.org/10.20383/101.09, Fang et al., 2018). well as 18 water years of hourly air temperature, relatively
Headers in most data files are self-explanatory, and all data humidity, and wind speed as well as daily precipitation from
are measured in central standard time (CST) that is 6 h 1 October 1969 to 30 September 1987. These meteorological
behind Greenwich mean time (GMT − 6). Meteorological datasets are useful for driving hydrological models and car-
data are time series in comma-delimited .txt files organised rying out diagnostic change detection analysis in the basin. In
by station. Snow survey data are stored in the .xlsx files. addition, 15 min quality-controlled data including other hy-
Historical snow survey data are summarised in a single time drometeorological variables such as snow depth, soil temper-
series file. Recent snow survey data are organised by site ature, and soil moisture are presented from 1 October 2005 to
for a water year. Recent streamflow data are time series 30 September 2016; these data have gaps but are useful for
and are stored in .csv files and are organised by the gauge diagnosing model performance in snow accumulation, soil
station. Additional readme files are provided for notes on moisture, and temperature. Snow survey data are included
www.earth-syst-sci-data.net/11/455/2019/ Earth Syst. Sci. Data, 11, 455–471, 2019468 X. Fang et al.: Hydrometeorological data from Marmot Creek Research Basin Table 7. Marmot Creek Research Basin theses in chronological order for the recent period. Thesis title Author Year Compositional change of meltwater infiltrating frozen ground Lilbæk, Gro 2009 Energy fluxes at the air-snow interface Helgason, Warren 2009 Unloading of intercepted snow in conifer forests MacDonald, James 2010 Hydrological response unit-based blowing snow modelling over mountainous terrain MacDonald, Matthew 2010 Radiation and snowmelt dynamics in mountain forests Ellis, Chad 2011 Simulating areal snowcover depletion and snowmelt runoff in alpine terrain DeBeer, Chris 2012 Implications of mountain shading on calculating energy for snowmelt using unstructured triangular meshes Marsh, Christopher 2012 Precipitation phase partitioning with a psychrometric energy balance: model development and application Harder, Phillip 2013 Acoustic measurement of snow Kinar, Nicholas 2013 Effects of climate variability on hydrological processes in a Canadian Rockies headwaters catchment Siemens, Evan 2016 Sensitivity analysis of mountain hydrology to changing climate Rasouli, Kabir 2017 for the historical period from 1963 to 1986 and the current period from 2007 to 2016. Hourly streamflow is provided for Cabin, Middle, and Twin Creeks from 2007 to 2012, Upper Marmot Creek from 2007 to 2016, and Marmot Creek after June 2013 flood from 26 June 2013 to 2016. Daily stream- flow for Cabin Creek, Middle Creek, Twin Creek, and Upper Marmot Creek from 1963 to 1986 and Marmot Creek daily streamflow from 1962 to 19 June 2013 can be obtained from the ECCC Water Survey of Canada’s “historical hydrometric data search” website. In addition, data from several ground- water wells in Marmot Creek can be accessed from AEP’s “Groundwater Observation Well Network (GOWN)” web- site. In all, these long-term meteorological and hydrometric datasets are a legacy of previous and current research activi- ties conducted in MCRB and support ongoing efforts to de- tect and diagnose climate change in the basin and region, ex- amine extreme hydrometeorological events (i.e. drought and flood), and diagnose the basin response to land cover changes caused by stressors such as insect infestations, fire, and for- est harvesting. This dataset ultimately serves to advance our knowledge of hydrology of the Canadian Rockies. Earth Syst. Sci. Data, 11, 455–471, 2019 www.earth-syst-sci-data.net/11/455/2019/
X. Fang et al.: Hydrometeorological data from Marmot Creek Research Basin                                       469

Appendix A: Abbreviation list

 AEP       Alberta Environment and Parks
 a.g.s.    above ground surface
 AWRP      Alberta Watershed Research Program
 CCG       Cabin Creek gauge
 CFS       Canadian Forestry Service
 CRHM      Cold Regions Hydrological Modelling platform
 CST       central standard time
 DEM       digital elevation model
 ECCC      Environment and Climate Change Canada
 GIS       geographic information system
 GOWN      Groundwater Observation Well Network
 GW        groundwater wells
 Lidar     light detection and ranging
 MCG       Middle Creek gauge
 MCRB      Marmot Creek Research Basin
 MSC       Meteorological Service of Canada
 QC        quality controlled
 ROC       rate of change
 SC        snow courses
 SRB       Saskatchewan River basin
 SWE       snow water equivalent
 TCG       Twin Creek gauge
 UMCG      Upper Marmot Creek gauge
 WY        water year

www.earth-syst-sci-data.net/11/455/2019/                                    Earth Syst. Sci. Data, 11, 455–471, 2019
470                                              X. Fang et al.: Hydrometeorological data from Marmot Creek Research Basin

Author contributions. XF cleaned and organised the dataset.           DeBeer, C. M. and Pomeroy, J. W.: Modelling snow melt
JWP designed and instrumented the research basin, and all authors        and snowcover depletion in a small alpine cirque, Cana-
collected data and contributed to the paper writing.                     dian Rocky Mountains, Hydrol. Process., 23, 2584–2599,
                                                                         https://doi.org/10.1002/hyp.7346, 2009.
                                                                      DeBeer, C. M. and Pomeroy, J. W.: Influence of snowpack and melt
Competing interests. The authors declare that they have no con-          energy heterogeneity on snow cover depletion and snowmelt
flict of interest.                                                       runoff simulation in a cold mountain environment, J. Hydrol.,
                                                                         553, 199–213, https://doi.org/10.1016/j.jhydrol.2017.07.051,
                                                                         2017.
Special issue statement. This article is part of the special is-      Ellis, C. R. and Pomeroy, J. W.: Estimating sub-canopy shortwave
sues “Hydrometeorological data from mountain and alpine research         irradiance to melting snow on forested slopes, Hydrol. Process.,
catchments” and “Water, ecosystem, cryosphere, and climate data          21, 2581–2593, https://doi.org/10.1002/hyp.6794, 2007.
from the interior of western Canada and other cold regions”. It is    Ellis, C. R., Pomeroy, J. W., Essery, R. L. H., and Link, T. E.: Effects
not associated with a conference.                                        of needleleaf forest cover on radiation and snowmelt dynamics
                                                                         in the Canadian Rocky Mountains, Can. J. Forest Res., 41, 608–
                                                                         620, https://doi.org/10.1139/X10-227, 2011.
                                                                      Ellis, C. R., Pomeroy, J. W., and Link, T. E.: Modeling increases
Acknowledgements. The authors would like to gratefully ac-
                                                                         in snowmelt yield and desynchronization resulting from forest
knowledge the funding assistance provided from the Alberta gov-
                                                                         gap thining treatments in a northern mountain catchment, Water
ernment departments Environment and Parks, and Agriculture and
                                                                         Resour. Res., 49, 936–949, https://doi.org/10.1002/wrcr.20089,
Forestry, the IP3 Cold Regions Hydrology Network of the Canadian
                                                                         2013.
Foundation for Climate and Atmospheric Sciences, the Natural Sci-
                                                                      Essery, R., Pomeroy, J., Ellis, C., and Link, T.: Modelling longwave
ences and Engineering Research Council of Canada through Dis-
                                                                         radiation to snow beneath forest canopies using hemispherical
covery Grants, Research Tools and Instrument Grants, Alexander
                                                                         photography or linear regression, Hydrol. Process., 22, 2788–
Graham Bell Scholarships, and the Changing Cold Regions Net-
                                                                         2800, https://doi.org/10.1002/hyp.6930, 2008.
work, the Global Institute for Water Security, Global Water Futures
                                                                      Fang, X. and Pomeroy, J. W.: Impact of antecedent conditions on
and the Canada Research Chairs programme. Logistical assistance
                                                                         simulations of a flood in a mountain headwater basin, Hydrol.
was received from the Biogeoscience Institute, University of Cal-
                                                                         Process., 30, 2754–2772, https://doi.org/10.1002/hyp.10910,
gary and the Nakiska Ski Area. Field work by many graduate stu-
                                                                         2016.
dents in and collaborators with the Centre for Hydrology and re-
                                                                      Fang, X., Pomeroy, J. W., Ellis, C. R., MacDonald, M. K., De-
search officers Michael Solohub, May Guan, Angus Duncan, and
                                                                         Beer, C. M., and Brown, T.: Multi-variable evaluation of hy-
Greg Galloway was essential in accurate data collection in adverse
                                                                         drological model predictions for a headwater basin in the Cana-
conditions. Natural Resources Canada, Canadian Forest Service are
                                                                         dian Rocky Mountains, Hydrol. Earth Syst. Sci., 17, 1635–1659,
the owners of the copyright of the historical meteorological and
                                                                         https://doi.org/10.5194/hess-17-1635-2013, 2013.
snow survey data. This paper is dedicated to the hundreds of re-
                                                                      Fang, X., Pomeroy, J., DeBeer, C., Harder, P., and Siemens,
searchers who have contributed to data collection in Marmot Creek
                                                                         E.: Hydrometeorological data from Marmot Creek Research
over the last 55 years.
                                                                         Basin, Canadian Rockies, Federated Research Data Repository
                                                                         (FRDR), https://doi.org/10.20383/101.09, 2018.
                                                                      Fisera, Z.: Snow accumulation and melt pattern in tree line stands of
Review statement. This paper was edited by Danny Marks and               Marmot Creek Basin, in: Proceedings of Alberta Watershed Re-
reviewed by two anonymous referees.                                      search Program Symposium, Information Report NOR-X-176,
                                                                         Canadian Forestry Service, Northern Forestry Centre, Edmon-
                                                                         ton, Alberta, 97–109, 1977.
References                                                            Golding, D. L. and Swanson, R. H.: Snow distribution patterns
                                                                         in clearings and adjacent forest, Water Resour. Res., 22, 1931–
Alberta Forest Service: Marmot Creek Watershed Research Basin:           1940, 1986.
  Forest Cover Type Map, Information and Technical Services Di-       Harder, P. and Pomeroy, J. W.: Estimating precipitation phase using
  vision, Graphics Section, Department of Forestry of Canada, Ot-        a psychrometric energy balance method, Hydrol. Process., 27,
  tawa, Ontario, 1963.                                                   1901–1914, https://doi.org/10.1002/hyp.9799, 2013.
Beke, G. J.: Soils of three experimental watersheds in Alberta        Harder, P., Pomeroy, J. W., and Westbrook, C. J.: Hydro-
  and their hydrological significance, PhD thesis, Department of         logical resilience of a Canadian Rockies headwaters
  Soil Science, University of Alberta, Edmonton, Alberta, Canada,        basin subject to changing climate, extreme weather, and
  456 pp., 1969.                                                         forest management, Hydrol. Process., 29, 3905–3924,
Bruce, J. P. and Clark, R. H.: Introduction to Hydrometeorology,         https://doi.org/10.1002/hyp.10596, 2015.
  Pergamon Press, Toronto, Canada, 319 pp., 1965.                     Harlan, R. L.: Soil-water freezing, snow accumulation and ablation
Canadian Forestry Service: Compilation of hydrometeorological            in Marmot Creek Experimental Watershed, Alberta, Canada, in:
  record, Marmot Creek Basin, 1976 data, Volume 12, Northern             Proceedings of the 37th Western Snow Conference, 15–17 April
  Forest Research Centre, Edmonton, Alberta, 1976.                       1969, Salt Lake City, Utah, 29–33, 1969.

Earth Syst. Sci. Data, 11, 455–471, 2019                                                 www.earth-syst-sci-data.net/11/455/2019/
You can also read