Hydrogeologic Conceptual Site Model and Historic Uses for BPMD Operable Unit 3; Bonita Peak Groundwater System; Version
←
→
Page content transcription
If your browser does not render page correctly, please read the page content below

Mountain Studies Institute                                    Conceptual Site Model for BPMD OU3

                                                                  *100012540*
                                                                        100012540

 Hydrogeologic Conceptual Site Model and Historic
   Uses for BPMD Operable Unit 3; Bonita Peak
          Groundwater System; Version 1

                                        October 2022

      Prepared For:                                 Prepared By:
      U.S. Environmental Protection Agency          Mountain Studies Institute
      Region 8                                      Alpine Water Resources, LLC.
      1595 Wynkoop Street                           116 E. 12th P.O. Box 426 St
      Denver, CO 80202                              Silverton, CO 81433

Publication Date: May 1, 2022
Cover Photo Credit: MSI
Author(s): Cowie, Rory 2, Kurzweil, Jake1
Contributors: Roberts, Scott 1, Bonwell, Carly1, Farwell, Haley1, Newman, Connor 3
   1. Mountain Studies Institute, Silverton, CO
   2. Alpine Water Resources, LLC, Silverton, CO
   3. Colorado School of Mines, Golden, CO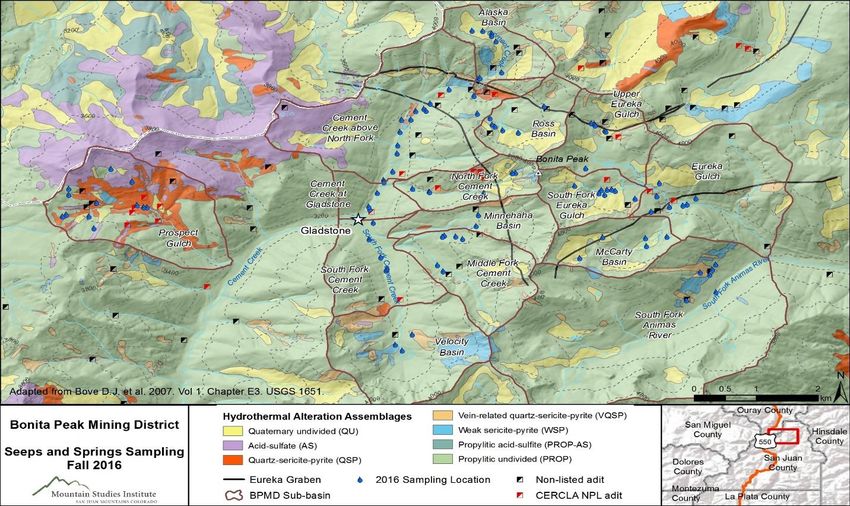
Mountain Studies Institute                                                                                      Conceptual Site Model for BPMD OU3

Table of Contents
1.0 Introduction ..................................................................................................................... 1
2.0 Geographic setting........................................................................................................... 2
3.0 Geologic Setting............................................................................................................... 4
4.0 Hydrologic setting ............................................................................................................ 9
5.0 Temporal Setting ........................................................................................................... 14
   5.1         Pre-Mining historical context (before ~1880) .................................................................... 14
   5.2 Pre-Bulkhead mining period (~1880 to 1990) ........................................................................... 15
   5.3 First Bulkheads (1996-2003) .................................................................................................... 18
   5.4 Second phase of bulkheads: 2001-2005 ................................................................................... 21
   5.5 Post Bulkhead through GK release (2005-2015) ....................................................................... 24
      5.5.1 First phase after bulkheads closed: 2003-2009 ........................................................................................24
   5.6         GK Release period (August 2015-2017) ............................................................................. 25
   5.7         Current conditions (2018-2021) ........................................................................................ 25
6.0 Supporting hydrologic information and data .................................................................. 26
   6.1 USGS Hydrologic studies ......................................................................................................... 27
   6.2 Water Isotopes (18O &3H) ........................................................................................................ 28
   6.3 Rare Earth Elements ............................................................................................................... 31
   6.4 Age dating of Groundwater using natural and anthropogenic tracers (CFCs, SF6, 3H) ................ 32
      6.4.1 Overview ...................................................................................................................................................32
      6.4.2 Methods ....................................................................................................................................................33
      6.4.3 Results .......................................................................................................................................................34
   6.5 Geophysical surveys ............................................................................................................... 36
7.0 Geospatial Analysis ........................................................................................................ 36
8.0 Recommendations ......................................................................................................... 44
   8.1 Future actions to address data gaps ........................................................................................ 44
   8.2 Further interpretation and analysis of existing data to improve CSM ....................................... 47
9.0 References ..................................................................................................................... 49
10.0 Appendix ..................................................................................................................... 51
Mountain Studies Institute                                                                        Conceptual Site Model for BPMD OU3

List of Figures

Figure 1. Conceptual diagram of environmental components of the Bonita Peak groundwater
system. ............................................................................................................................................ 1
Figure 2.Geographic Setting: Overview map of source areas in BPMD and main river systems. 3
Figure 3. Overlay of major mine workings, geologic features, and BPMD sampling locations
surrounding Bonita Peak. All sites have been sampled for water quantity and quality between
2016 and 2020 with the new seep/spring sites only sampled in 2020.The blue band represents the
200’ elevation above the R&B mine where the water table may have been increased during the
bulkhead test closure. ...................................................................................................................... 4
Figure 4. Generalized structure and geology of Silverton caldera. Animas River and Mineral
Creek follow structural margin of the Silverton Caldera. In addition to the ring fractures that
were created when the Silverton and earlier San Juan calderas formed, radial and graben faults,
which host most of the subsequent vein mineralization are shown. Figure from; Yager and Bove
2007, Chapter E1, figure 5 in USGS pp 1651 (Church et al., 2007). ............................................. 5
Figure 5. Overview of mine workings, major faults and veins, mines, and seeps and springs
sampled between 2016 and 2018. ................................................................................................... 7
Figure 6. Intersection of the hinge fault with the American Tunnel and proximity of Gold King
and Red and Bonita Mine workings. All currently closed bulkheads are shown for reference.
Figure modified from map prepared by Kirstin Brown, Colorado Division of Reclamation and
Mining History, September 22, 2015 (Sorenson & Brown, 2015). ................................................ 7
Figure 7. Burns Formation near Gold King Mine. Modified from: Burbank and Luedke, 1969,
and Sorenson and Brown, 2015. ..................................................................................................... 8
Figure 8. Distribution of ferricrete landforms in the BPMD mapped by the USGS (citation
UGSG PP 1651 chapter 15). Of note is the absence of ferricrete landforms in most of the basins
of the BPMD yet there is colluvial ferricrete in the North Fork of Cement Creek and the vast
majority are in the main stem of Cement Creek in the areas between Red and Bonita and
American Tunnel. ........................................................................................................................... 9
Figure 9. Conceptual diagram of surface water and groundwater interactions in natural and
mining impacted mountain environments. The arrows depict the direction and magnitude of
water movement. Precipitation is separated into snow (blue) and rain (green) with water losses as
ET partitioned into summer (light green) and winter (light blue). Natural surface flows are
blue/green while mine discharge is red. Groundwater flow is in orange...................................... 11
Figure 10. Timing and magnitude of mine and stream discharge in Cement Creek for water years
2019-2020. Modified from (Cowie & Rock, 2020). ..................................................................... 13
Figure 11. Proportion of total discharge in Cement Creek at Gladstone (stream gage CCSG1)
that comes directly from the six upstream monitored draining mines (orange) and from other
non-gaged source waters (blue). Figure from (Cowie & Rock, 2020). ........................................ 14
Figure 12. Bulkhead Closures and mine adit flows in upper Cement Creek from 1991 to 2020.
(Deere & Ault Consultants, 2021). ............................................................................................... 20
Figure 13. Working conceptual diagram of groundwater elevations following bulkheading
(Deere & Ault Consultants, 2021). ............................................................................................... 26
Figure 14. Tritium concentrations (Tritium Units, TU) in mine discharges in Cement Creek. It
should be noted that the modern springs data from 2019 is an average value.............................. 29

Mountain Studies Institute                                                             Conceptual Site Model for BPMD OU3

Figure 15. Avg Fluoride from 2016 through 2019 plotted with sub basins and surficial geology.
Heightened values can still be seen in California basin. As well as Gold King Level 7, Red and
Bonita, and the American Tunnel. ................................................................................................ 37
Figure 16. Temporal trends of fluoride for the six major draining mines. Mogul Mine (CC01b),
Red & Bonita (CC03C), Gold King Level 7 (CC06), Natalie Occidental Mine or Silver Ledge
(CC14), American Tunnel (CC19), and Clack Hawk Mine (CC50). Red & Bonita (CC03C)
shows a significant negative trend, while Gold King Level 7 (CC06), and Natalie Occidental
show significant Increases. All other locations have non-significant trends. The gray bar shows
the 95% confidence interval of the monotonic trend. ................................................................... 38
Figure 17. Mean beryllium values from geochemical data collected between 2016 and 2019. .. 39
Figure 18. Draining mines and groundwater expressions estimated flow duration in the system.
Concentrations of Tritium are plotted against CFC-12. These are then plotted against possible
flow models Piston flow, Dispersion, and Exponential mixing). ................................................. 40
Figure 19. Principal Component Analysis (PCA) plot reflecting analytical results of samples
collected during low flow 2016-2020 (from Roberts and Cowie 2021). ...................................... 43
Figure 20. Principal Component Analysis (PCA) loading vectors indicating the strength and
direction of how strongly each water quality parameter influenced the plotted variability among
samples depicted in PCA plots (from Roberts and Cowie 2021). ................................................ 43

Mountain Studies Institute                                 Conceptual Site Model for BPMD OU3

List of Abbreviations and Acronyms

AT           American Tunnel
AMD          Acid Mine Drainage
AWR          Alpine Water Resources, LLC
ARSG         Animas River Stakeholder Group
BPMD         Bonita Peak Mining District
CCSG         Cement Creek Stream Gage
CSM          Conceptual Site Model
D&A          Deere and Ault Engineering Inc.
DM           Draining Mine
DRMS         Division of Reclamation and Mining Safety
USEPA        U.S. Environmental Protection Agency
EGSG         Eureka Gulch Stream Gage
GK           Gold King Mine
IWTP         Interim Water Treatment Plant
MSI          Mountain Studies Institute
NO           Natalie Occidental Mine
OU           Operating Unit for BPMD RI
OU3          Bonita Peak Groundwater Operating Unit for BPMD
QA/QC        Quality Assurance, Quality Control
R&B          Red and Bonita Mine
REE          Rare Earth Elements
RI           Remedial Investigation
S&S          Seeps and Springs
SW           Surface Water
SNOTEL       Snow telemetry
USGS         United States Geologic Survey

Mountain Studies Institute                                                    Conceptual Site Model for BPMD OU3

1.0 Introduction
    The Conceptual Site Model (CSM) is used to develop an understanding of a location of
interest to direct sampling and monitoring, interpret results, and evaluate risks and exposure to
human health and the environment. The CSM is a living document which is developed in the
scoping phase of the Remedial Investigation (RI) and refined and expanded, as necessary, to
incorporate additional information from ongoing investigation during the RI phase. The CSM is
intended to incorporate historical and current understanding of the contaminant sources,
migration and transport routes, and potential receptors. The CSM document helps to describe the
mechanisms that release contaminants from source materials followed by the fate and transport
of the contaminants in the environment. The following is the current framework of the Bonita
Peak Mining District (BMPD) Operating Unit 3 (OU3) CSM, created to specifically understand
the hydrologic system controlling contaminant transport within the Bonita Peak groundwater
areas of the BPMD. The document is supplemented with additional maps, figures, graphs, and
diagrams that aid in visual representation of the CSM (see appendix Figures 1A-10A).
    The relevant site information needed to provide the basic framework for the BPMD OU3
CSM is broken down into four basic components: geography and geology, hydrology, mine
workings and geologic structures, and ongoing remediation (bulkheads and closures) (Figure 1).
Each of the components plays a role in the sources and flowpaths of surface and groundwaters in
OU3.

            Figure 1. Conceptual diagram of environmental components of the Bonita Peak groundwater system.

                                                                                                               1
Mountain Studies Institute                                        Conceptual Site Model for BPMD OU3

2.0 Geographic setting
    The OU3 (Bonita Peak Groundwater system) investigation is one component of the site-wide
BPMD RI and seeks to understand the impacts of mining-related source waters and naturally
occurring groundwater to receiving surface waters surrounding Bonita Peak (Figure 2). The OU3
system focuses on the impacts of underground mine workings and associated portals with
discharging water in the vicinity of Bonita Peak, Colorado, which resides between the Upper
Animas Watershed to the east and the Upper Cement Creek Watershed to the west in San Juan
County, Colorado. Due to the presence of several large volume mine discharges with high metal
content in the Upper Cement Creek watershed (Mogul, Red and Bonita, Gold King Level 7,
American Tunnel, Natalie Occidental, and Blackhawk mines), the OU3 CSM will focus on these
mine water sources and their potential hydrologic connections with other mine workings and
surface water sources (e.g., seeps, springs, and surface water channels) in the Upper Cement
Creek Watershed. Due to potential hydrologic connectivity of mine waters in Cement Creek to
the eastern side of Bonita Peak via natural (faults and fractures) and artificial (mine workings)
sub-surface pathways, this CSM will also focus on the Eureka Gulch and South Fork of Animas
watersheds which receive waters from the eastern side of Bonita Peak. Additionally, potential
hydrologic connectivity to other areas outside of the Cement Creek and Animas River surface
water boundaries will be considered. Specifically, the extent of the regional geologic structures
(large grabens and faults), which may extend outside of the apparent surface topographical extent
of the Bonita Peak groundwater system, will be considered as potential influences on the Bonita
Peak groundwater system. Preliminary investigations of seeps, springs, and draining mines on all
sides of Bonita Peak indicate that there are few to no major source water locations to the north
(California and Placer Gulch) nor south (e.g., Boulder Gulch) that appear to have significant
hydrologic connection to the waters beneath Bonita Peak (Cowie & Roberts, 2019). However,
the ongoing recent hydrologic investigations may indicate considerable east to west hydrologic
connections in the Bonita Peak groundwater system which are not wholly explained by the
existing mine workings, nor the assumptions/conclusions associated with the existing bulkheads.
These bulkheads were implemented to specifically control and impede movement of mine pool
waters to various exit locations across the watersheds.

                                                                                                    2
Mountain Studies Institute                                                    Conceptual Site Model for BPMD OU3

               Figure 2.Geographic Setting: Overview map of source areas in BPMD and main river systems.

    Historic mining activity within OU3 was most prolific in the areas beneath former Lake
Emma, at the headwaters of Eureka Gulch, collectively known as the Sunnyside mine workings.
Due to the large scale of these operations in the high elevation basin, there were additional
haulage and drainage tunnels connected to the Sunnyside mine workings which made physical
and hydrologic connections to the nearby surface waters on both sides of the Bonita Peak.
Specifically, the American Tunnel connected the Sunnyside mine workings to the Gladstone area
on Cement Creek and the Terry Tunnel connected to Eureka Gulch on the Animas River side of
Bonita Peak (Figure 3). A large amount of previous work has been completed to document the
physical extent and interconnections of known mine workings in relation to their geographical
locations within the Bonita Peak OU3 area (Sorenson & Brown, 2015). The known
configurations and locations of these mine workings along with the mapping of topographical
geography in vicinity of the mine workings provides the initial baseline to define the extent of
OU3 for development of a Conceptual Site Model.

                                                                                                               3
Mountain Studies Institute                                                       Conceptual Site Model for BPMD OU3

Figure 3. Overlay of major mine workings, geologic features, and BPMD sampling locations surrounding Bonita Peak. All sites
   have been sampled for water quantity and quality between 2016 and 2020 with the new seep/spring sites only sampled in
2020.The blue band represents the 200’ elevation above the R&B mine where the water table may have been increased during the
                                                    bulkhead test closure.

3.0 Geologic Setting
    The BPMD resides within the San Juan Mountains of Southwest Colorado which were
formed by a series of volcanic events collectively known as the San Juan volcanic field. The San
Juan volcanic field consists of 15 caldera complexes of which five are mineralized (Lipman et
al., 1976). Three of the five complexes reside near Silverton with the other two mineralized
complexes being Creede and Summitville on the eastern side of the San Juan Mountains.
Specifically, the BPMD OU3 mine sites are primarily located within or near the Silverton
Caldera Complex. Most historic mining activity occurred in geologic areas associated with
hydrothermal alterations of faults and fractures around the Eureka Graben structure, which
formed following the collapse of the Silverton caldera (Casadevall & Ohmoto, 1977). The
production and emplacement of valuable minerals in relation to the hydrothermal alteration along

                                                                                                                          4
Mountain Studies Institute                                                            Conceptual Site Model for BPMD OU3

major structures, like the Eureka Graben, generally occur within a few hundred meters of the
structures and therefore correlate with the locations of the largest and most extensive mine
workings in the Silverton area (e.g., Sunnyside mines proximal to the Eureka Graben) (figures
3,4). The geologic structures related to the Silverton Caldera are pervasive features that were not
sealed by mineralizing fluids and may provide important groundwater flow paths at the basin
wide scale (Have, 1973). The Silverton caldera collapsed in a half graben manner toward the
southwest and formed a hinged, half-graben structure at 27.5 Ma b.p. (Lipman et al., 1976).
There was additional resurgent volcanic activity along the southern margin at 25.1 Ma b.p.,
followed later by the Red Mountain porphyry system, which was intruded about 11 Ma b.p. into
the northwestern part of the caldera and is the youngest resurgent rock of the volcanic center
(Koch, 1990). The apical Eureka graben subsided between 27.5 and 22.5 Ma b.p. to the
northeast, the Eureka graben ends at the margin of the Lake City caldera. To the southwest, the
Eureka graben ends where it meets the eastern margins of the Red Mountain system near
Gladstone, CO (figure 4 and 11A for surficial geology).

 Figure 4. Generalized structure and geology of Silverton caldera. Animas River and Mineral Creek follow structural margin of
the Silverton Caldera. In addition to the ring fractures that were created when the Silverton and earlier San Juan calderas formed,
 radial and graben faults, which host most of the subsequent vein mineralization are shown. Figure from; Yager and Bove 2007,
                                   Chapter E1, figure 5 in USGS pp 1651 (Church et al., 2007).

                                                                                                                                 5
Mountain Studies Institute Conceptual Site Model for BPMD OU3
Below is an excerpt from Koch (1990), a PhD dissertation on the geology of the Gold King
Mine area and further explains the geologic structures in OU3 near the Gold King mine.
“The Gold King-Davis gold veins are proximal to the Red Mountain porphyry system in the
north-central part of the Silverton caldera. In this area, west-northwest-striking hinge faults
formed due to the collapse of the caldera and intersect northeast-trending faults of the
Eureka graben. At the intersection of these faults the GK-Davis hydrothermal system exhibits
up to 5 m wide veins that follow steeply southeast and northwest-dipping structures of the
Eureka graben. Additional subsidiary veins up to 1 m wide branch off the main GK-Davis
lodes striking NE” (Koch, 1990).
The hinge faults formed by the younger Red Mountain porphyry system may have different
hydrothermal alteration assemblages and may also support local and regional groundwater flow
paths in an east to west direction. The hinge fault that follows the surface features of upper dry
gulch, North Fork of Cement Creek, and the lower Eureka Gulch lies nearly perpendicular to the
north/south drainages of Upper Cement Creek and the Animas River and intersects the American
Tunnel (figure 5). The large historic inflows of groundwater into the American Tunnel
(discussed later in document) occur at the same location as the intersection of the hinge fault and
associated fracture zone (figure 6) and highlight the potential hydrologic significance of
interactions between mine workings and geologic structures in the Bonita Peak Groundwater
system.
In addition to the major geologic structures and mine workings there is also importance to
understanding the complex vertical stratigraphy in the vicinity of the mine workings and surface
waters. An example of the complex stratigraphy in the vicinity of the Gold King mine from Koch
(1990);
“Below the precious metal lode mined at the GK, the caldera roof consists of Proterozoic
basement rocks that are unconformable overlain by Tertiary caldera fill of rhyolitic ash flow
tuffs, latic flows, and flow breccias of the Burns Formation.”
Specifically, the ground water flowpaths to emergence points at seeps and springs can be
influenced by variable primary porosity in different geologic layers. In the vicinity of the
American Tunnel and Gold King mines there is limited information available on the locations of
the daylighting of the Burns Formation along Cement Creek and Gladstone area (figure 7). More
information is needed on the horizontal layers within the Burns formation with contact layers
6Mountain Studies Institute Conceptual Site Model for BPMD OU3
Figure 5. Overview of mine workings, major faults and veins, mines, and seeps and springs sampled between 2016 and 2018.
Figure 6. Intersection of the hinge fault with the American Tunnel and proximity of Gold King and Red and Bonita Mine
workings. All currently closed bulkheads are shown for reference. Figure modified from map prepared by Kirstin Brown,
Colorado Division of Reclamation and Mining History, September 22, 2015 (Sorenson & Brown, 2015).
7Mountain Studies Institute Conceptual Site Model for BPMD OU3
of differing permeability which could promote the lateral movement of upwelling or
downflowing (vertical) groundwater flow. One consideration for the presence of lateral
movement of groundwater towards Cement Creek may be the presence of ferricrete deposits
around seeps and historic fens in locations not obviously tied to larger secondary porosity
structures (fractures and faults). There are several of these iron deposits and iron fen features
near Gladstone which have been previously mapped by the USGS (figure 8) and further
understanding of the localized stratigraphy may support greater understanding of groundwater
flowpaths in the area. Additional detail on the geology of the BPMD area can also be found in
(Church et. al., 2007) and has also been recently presented in relation to impacts of Sunnyside
Mine bulkheads to Cement Creek water quality (Walton-Day et al., 2021).
Figure 7. Burns Formation near Gold King Mine. Modified from: Burbank and Luedke, 1969, and Sorenson and Brown, 2015.
8Mountain Studies Institute Conceptual Site Model for BPMD OU3
Figure 8. Distribution of ferricrete landforms in the BPMD mapped by the USGS (citation UGSG PP 1651 chapter 15). Of note
is the absence of ferricrete landforms in most of the basins of the BPMD yet there is colluvial ferricrete in the North Fork of
Cement Creek and the vast majority are in the main stem of Cement Creek in the areas between Red and Bonita and American
Tunnel.
4.0 Hydrologic setting
The construction of hardrock mines made thousands of artificial hydrologic pathways
through the mountains, which often resulted in the creation of unnatural increases in surface
water and groundwater interactions. Mine tunnels provide direct access to different depths within
the flow system, but they can severely perturb natural flow paths and rates, drawing near-surface
water to depths well below where it normally circulates. Most hardrock mines are specifically
targeting mineralization associated with faulting and fracturing of parent bedrock material
associated with mountain building processes. For obvious reasons associated with accessibility,
the mines are also generally located in areas where there is surface, or near-surface expression of
the geologic activity associated with mineralization. From an economic standpoint, the mines
9Mountain Studies Institute Conceptual Site Model for BPMD OU3
also generally target mineral reserves that are closest to the surface. As a result, the mine
environments will frequently interact with surface water and/or groundwater processes that are
being actively controlled by present day hydrologic conditions (i.e. timing, magnitude, and type
of precipitation). Additionally, mine workings have potential of interaction with deeper
groundwater that has traveled along long flow paths associated with the secondary porosity of
bedrock fracturing and faulting. The long flow path groundwater is synonymous with what has
been described as “mountain block recharge” (Manning & Caine, 2007) in numerous natural
mountain settings. This type of groundwater flow is therefore often recharged from high
elevation alpine areas where snow-dominated precipitation is greatest and then travels along
diverse and non-uniform pathways before being intercepted by the mine. As a result, mine
environments can interact with both localized and regional scale hydrologic processes
demonstrating the need to be able to investigate the surface and subsurface water interactions at a
wide range of spatial and temporal scales to gain a process-based understanding of how Acid
Mine Drainage (AMD) is generated.
There is also clear implication of the need to understand both the localized and
regional geologic setting and sub-surface architecture influencing water movement into and out
of mine environments. A strong conceptual understanding of the location and magnitude of both
drivers (inputs from precipitation or surface flows) and controls (extent of hydrologic
connectivity in the subsurface) is therefore necessary to address remediation opportunities to
reduce long-term impacts of mines on water resources in mountains.
A conceptual diagram is presented to compare the surface and groundwater
interactions that are observed in both natural and mine impacted mountain environments (figure
9). The left side of the figure helps to conceptualize the continuum of the hydrologic processes
that occur in natural mountain settings. The right side of the figure depicts a similar mountain
environment with the addition of a complex of mining tunnels commonly found in abandoned
hard rock mine settings. The mine tunnels create an artificial flow path for intercepted
groundwater to move towards the surface, picking up metals along the way and discharging to
the surface as AMD. The shorter flow path (A) depicts mine interception of shallower recharge
that occurs near the mine environment and fluctuates on short time scales in response to seasonal
meteoric recharge. Meanwhile, the longer flow path (B) depicts mine interception of deep
circulating groundwater that has traveled long distances via fracture flow before interacting with
10Mountain Studies Institute Conceptual Site Model for BPMD OU3
the faults that are being mined. The conceptual diagram therefore demonstrates that hardrock
mines can interact with variable groundwater flow paths generated from unique sources of
recharge.
Figure 9. Conceptual diagram of surface water and groundwater interactions in natural and mining impacted mountain
environments. The arrows depict the direction and magnitude of water movement. Precipitation is separated into snow (blue) and
rain (green) with water losses as ET partitioned into summer (light green) and winter (light blue). Natural surface flows are
blue/green while mine discharge is red. Groundwater flow is in orange.
The OU3 area is a high elevation mountain catchment dominated by winter, snow
precipitation (80%+ of annual precipitation) which accumulates from October through May each
year. The surface water streams have seasonal peak discharges from May-July each year
following snowmelt and then a return to low baseflow conditions by October, which remain until
snowmelt resumes the following year. Further information can be found in the BPMD Water
Budget Report (Cowie & Rock, 2020).
11Mountain Studies Institute Conceptual Site Model for BPMD OU3
The regionally estimated meteoric water in and out of the OU3 system is being monitored
using weather stations (in) and stream gages (out) and the spatial and temporal resolution of data
sets is improving with more instrumented sites planned. The interannual variability of climate is
an important component of the CSM and must be quantified and factored into each interpretation
of changes or trends in hydrologic parameters as the CSM is improved throughout the remedial
investigation.
Preliminary results of ongoing BPMD isotope studies (e.g. water isotopes) do not indicate
presence of deep geothermal waters significantly interacting with meteoric waters in the OU3
system. The Sampled mine waters contain tritium (presented later) and do not have water
temperatures greater than the expected geothermal gradient from point of recharge to point of
discharge (e.g. no temperatures > 10 deg C).
This is the typical scenario for most legacy mine sites in the area, but exceptions have been
identified such as the Nelson Tunnel NPL site in Creede, CO (Cowie & Williams, 2014) where
mine water temperatures are in excess of 19 deg C. Therefore, it is important to document this
using the recent isotopic data available for the BPMD.
The seasonal temporal patterns of mine discharge have also been documented, (Cowie &
Rock, 2020), and highlights that each draining mine site has a unique annual discharge pattern
that may not be positively correlated with the annual peak stream discharge timing (figure 10).
High resolution mine discharge monitoring has enhanced the understanding of mine discharges
in relation to the Bonita Peak groundwater system in several ways. As expected, the seasonal
increases in mine discharge are greatest at non-bulkheaded mine sites (e.g., Gold King, Natalie
Occidental, Blackhawk, Red and Bonita). Additionally, major increases in mine discharge close
to the timing of snowmelt driven peak stream discharge indicates rapid melt water infiltration
into the mine workings and thus a shorter and faster flowpath at that time (e.g., Natalie
Occidental and Gold King). Conversely, a more delayed and gradual increase in mine discharge,
in relation to seasonal stream discharge, is more indicative of a longer or slower flowpath of
groundwater from infiltration to exit from a mine (e.g., Blackhawk and Red and Bonita). The
variance in spring discharge in relationship to meteoric inputs indicates that there are different
residence times associated with each of these mines and remedial responses will vary,
particularly with longer flowpaths indicative of longer residence times.
12Mountain Studies Institute Conceptual Site Model for BPMD OU3
Additionally, understanding the timing and magnitude of mine water contributions to surface
water flows is important as the relative contributions can be highly temporally variable. Analysis
of daily mine water contributions to stream flow in upper Cement Creek was conducted in 2019
and 2020 (Cowie & Rock, 2020)(figure 11).
High temporal resolution monitoring of mine adit discharge and water chemistry in the
Cement Creek mines has occurred since 2018 and that data should be incorporated when further
developing the CSM. Specifically, if changes are made to the current system via additional
bulkheading or other actions, the resulting impacts to other mines/locations can only be
measured and understood if the individual site variability is first understood. Additionally,
remediation of individual sites at different times but within the same watershed or groundwater
system will have varying impacts on downstream water quality making it important to quantify
exactly where and how remedial actions are altering the mobilization, fate, and transport of
contaminants.
Figure 10. Timing and magnitude of mine and stream discharge in Cement Creek for water years 2019-2020. Modified from
(Cowie & Rock, 2020).
13Mountain Studies Institute Conceptual Site Model for BPMD OU3
Figure 11. Proportion of total discharge in Cement Creek at Gladstone (stream gage CCSG1) that comes directly from the six
upstream monitored draining mines (orange) and from other non-gaged source waters (blue). Figure from (Cowie & Rock, 2020).
5.0 Temporal Setting
This section details the history of mining impacts specific to the hydrology of Bonita Peak
OU3. The following is a timeline of the known and documented events related to mining activity
impacts to the ground water system beneath Bonita Peak.
5.1 Pre-Mining historical context (before ~1880)
The historic pre-mining groundwater flow path emergence points within Bonita Peak are
indicated by existing features such as fens and ferricrete deposits around seeps (figure 11A). The
presence of historic groundwater features was highlighted in the recent R&B bulkhead test
reports (Deere & Ault Consultants, 2021; Farwell et al., 2021). Based on regional fen studies
(Chimner et al., 2002) the fens present in BPMD are at least a few thousand years old based on
peat accumulation rates and require a steady source of groundwater (GW) to maintain GW table
near the surface. These fens are likely to be located on major flow paths driven by geologic
fracture systems and/or surface expression of permeability boundaries (e.g., Burns formation
layers) within the sub surface. The pre-mining groundwater flows that established these fens,
14Mountain Studies Institute Conceptual Site Model for BPMD OU3
will never be completely known but additional investigation into historical mining records may
provide more insight on where water was encountered in early mining endeavors.
5.2 Pre-Bulkhead mining period (~1880 to 1990)
After the start of significant mining development in the late 1800’s, the Bonita Peak OU3
groundwater was controlled by the lowest elevation tunnels, with the American Tunnel (AT)
acting as an exploration tunnel and eventually as a drainage and haulage tunnel for various mine
areas within Bonita Peak. The AT was excavated very early on (1902) and was known to have
significantly altered groundwater levels via mine drainage and thus will be the starting point for
conceptual understanding of how mine structures impacted historical groundwater conditions in
OU3.
The AT exits the mountain at an elevation of 10,500 ft along Cement Creek just upstream of
the Gladstone site. The tunnel was first built in 1902 and extended under Bonita Peak to a
distance of 6,233 ft (Burbank and Luedke, 1969), stopping before the intersection of the Bonita
Fault (see figure 6). The tunnel remained at this length until 1959 when it was extended another
~5000 ft to connect with the Sunnyside mine workings beneath Lake Emma. The tunnel
connected with the Sunnyside mine workings one level below the H level and thus becoming the
lowest elevation mine workings in the Sunnyside mine. The AT was completed as a development
and exploration tunnel in 1961.
From 1902 until 1959 the tunnel would have served as a drainage elevation for any
intercepted groundwater in the vicinity (the first 6,000 ft into Bonita Peak from the Cement
Creek side and any major secondary porosity pathways such as open faults or fractures).
Importantly, we know that this original tunnel intercepted a hinge fault and fracture zone located
beneath the North Fork of Cement Creek and in the vicinity of the present day Red and Bonita
and Gold King Mine locations (figure 5). This hinge fault has been documented as a source of
water since at least 1961 when it was measured at 900 gpm and was still receiving inflows
measured at 580 gpm in 2001 prior to installing the outermost bulkheads in the American Tunnel
(Walston et al., 1993). As a result, the original tunnel may have lowered groundwater levels in
the surrounding bedrock starting as early as 1902 which could have enabled greater development
of nearby mine workings without intercepting groundwater flows and having to deal with
constant management of draining water.
15Mountain Studies Institute Conceptual Site Model for BPMD OU3
After 1961, the AT tunnel was a conduit of ground and mine waters from the Bonita Peak
area. The tunnel was connected to the Sunnyside mine workings below the H level and provided
a drain for waters entering connected levels at and above that level/elevation. The AT tunnel also
provided an exit pathway for groundwater which entered the tunnel via intersection with
secondary porosity (cracks and fracture systems) along the tunnel such as the hinge fault
described above. By February of 1961, the American Tunnel was gravity draining the Sunnyside
Mine, which had flooded to an elevation of 11,500 ft, approximately fifty feet below the F-level
of the mine, during the preceding twenty-plus years of inactivity (Walston et al., 1993). This
observation of a mine pool at 11,500 ft following 20 years of filling is important insight into
natural/equilibrated Bonita Peak groundwater table. How the pre-bulkheading mine pool
elevation relates to the observed mine pool table during bulkheading also important and
highlighted by Sorenson and Brown (2015). The following text is from the Division of Mine
Reclamation and Safety (DRMS) report by Sorenson and Brown (2015) on the feasibility and
justification for construction of the R&B bulkhead and contain important details on the measured
and assumed hydrologic conditions (pressures and water table elevations) related to the
Sunnyside bulkheads.
“In 1991 flows from the AT were measured at 2160 gpm. American Tunnel discharge
measurements taken at the outlet of a settling pond at the tunnel portal from 1987 through
1991 were fairly consistent between 1400-2000 gpm, with some outlying values measured
(Simon Hydro-Search 1992). Based on the flow measurements taken in October 1991,
American Tunnel bulkhead #1, installed in 1996 impounds approximately 910 gpm inflows
from the Washington, Brenneman, and Sunnyside veins in the Sunnyside Mine, and from the
fracture zone located at the American Tunnel 0770 runaround located approximately 8000
feet inby the portal. American Tunnel bulkhead #2 impounds 580 gpm of particularly acidic,
metal laden water (compared to the other inflows to the tunnel) from the fracture zone
located between 2700 and 3100 feet inby the portal (DRMS, 2001). This fracture zone is not
associated with the prominent Bonita fault zone, which is located more than 2500 feet to the
east. Effectively, the American Tunnel drained mine workings and fracture systems below the
F-level of the mine, F-level elevation ranging from approximately 11,550 to 11,600 feet.”
(Sorenson & Brown, 2015).
To summarize, the total discharge of 2,160 gpm in 1991 was approximately 40% from the
Sunnyside area, ~26% from fracture zone (580 gpm from hinge Fault), and additional ~30%
from other areas along the 2-mile tunnel at non-measured and/or non-discrete locations. Of note
is that the 580-gpm inflow from hinge fault is approximately equal to the sum of present-day
discharges from R&B+ GK which may indicate a steadier groundwater state behind bulkhead #2
16Mountain Studies Institute Conceptual Site Model for BPMD OU3
whereby the nearby GK and R&B mine workings may be expressing what was previously
exiting the AT.
An additional insight is that the hinge fault zone was producing about 900 gpm of water in
1961 and decreasing to 580 gpm by the 1990s. The measured decrease in discharge between
these known measurement points may further suggest that the water produced at the intersection
of the AT and the hinge fault was artificially and gradually decreasing the overall Bonita Peak
groundwater table and lowering the pressure head across the OU3 area. The inflows at the
fracture zone were measured as acidic and metal laden compared to other tunnel inflows and the
sources and flowpaths of that acidic water are not fully known at this time but may be of great
importance for the overall remedial investigation.
Sorensen and Brown (2015) also stated that the fracture zone (hinge fault) is separate from
the location of the Bonita fault zone and does not mention water entering AT where it crossed
the Bonita fault. This further supports the Koch (1990) indications that the hinge fault is not the
same as the Bonita fault in terms of likelihood of moving large volumes of water.
During the period of AT operation, the pre-mining groundwater table elevation for areas in
Bonita Peak above the AT likely decreased. There is little to no data in the form of stream flows
or seeps and springs records from within the area that date back to early 1900’s to definitively
determine if a hydrologic change occurred to the surface water and groundwater interactions in
Upper Cement Creek Watershed. However, if water tables have been lowered by the AT
drainage since 1902, we would expect to see some evidence on the landscape seen as drying
seeps and springs within the historic water table elevation. Examples of this occurrence would be
the degradation of wetlands (including fens) due to decreased groundwater supply and the drying
up of historic seeps or springs that may have left an age marker in the form of well-developed
iron ferricrete (fens, alluvial, colluvial) deposits at emergence points where oxidation occurred
for many centuries. Both types of formations (fens and ferricrete deposits) take hundreds to
thousands of years to develop, and fens have been dated back to the last deglaciation in the San
Juan Mountains (Chimner et al., 2002). There are some qualitative indications of a reduction of
groundwater flows to several fen sites along Cement Creek. Specifically, the fens beneath the
R&B and the Adams mines are currently in a degraded state which could be driven by decreasing
groundwater supply over the past 100 years in addition to surface damage from mine wastes and
structures. The information about historic seeps and springs would be qualitative in nature but
17Mountain Studies Institute Conceptual Site Model for BPMD OU3
could improve the conceptual understanding of mining impacts to the Bonita Peak groundwater.
Further hydrologic studies of these fens and ferricrete deposits would also benefit the conceptual
understanding of historic groundwater movement in OU3.
5.3 First Bulkheads (1996-2003)
As the economic viability of mining diminished, all mines in BPMD have since been
abandoned, and remediation efforts have begun. The chosen method to reduce the direct instream
contribution of AMD from the Sunnyside mine to surface water systems was bulkheads. Table 1
provides information on the nine bulkheads that were constructed by Sunnyside Gold
Corporation to impound the Sunnyside mine pool (Sorenson & Brown, 2015).
Table 1. Bulkheads constructed by Sunnyside Gold Corporation to impound the Sunnyside Mine pool.
Bulkhead Construction Valve Bulkhead Water Notes
Name Date Closed Elevation Pressure
F-Level 1-28-1994 n/a 11,592 ft. 36 psi Prevents direct
Secondary (calculated) discharge to
Mogul Mine
F-Level Primary 3-8-1994 n/a 11,588 ft. 36 psi Twinned with
(calculated) F-level secondary
B-Level 4-29-1994 n/a 12,148 ft. Zero, Above Would prevent
Secondary Mine Pool direct discharge to
Mogul
B-Level 5-24-1994 n/a 12,148 ft. Zero, Above Twinned with
Primary Mine Pool B-Level
Secondary
Terry Tunnel #1 9-1-1994 7-1996 11,555 ft. 40 psi 3800 Feet inbye
8-24-2000 the Tunnel Portal
American 7-7-1995 9-9-96 10,660 ft. 438 psi Initial Valve
Tunnel #1 5-14-2001 Closure 7-29-96,
Later Reopened
Terry Tunnel #2 9-28-2000 10-5-00 11,521 ft. Not Measured Stopped
Discharge from
Near Surface
Fractures
American 8-24-2001 8-31-01 10,612 ft. 175 psi Design Pressure,
Tunnel #2 8-15-2002 Ground Surface in
N. Fk. 277 psi
American 11-12-2002 12-3-02 10,595 ft. Not measured Reduced
Tunnel #3 Discharge from
Near Surface
Fractures
18Mountain Studies Institute Conceptual Site Model for BPMD OU3
In 1994, Sunnyside Gold Corporation constructed five internal bulkheads to stop water from
exiting the Sunnyside mine pool. As a part of mine closure and reclamation, Technical Revision
14 to the Operating Permit for the Sunnyside Gold mine described the purpose of the bulkheads:
“The proposed goal is to install bulkheads to impound groundwater within the Sunnyside
Mine in order to eliminate flow from the Sunnyside Mine property to surface down the tunnels, to
restore an approximation of pre-Sunnyside Mine hydrologic conditions and eliminate the need
for perpetual water treatment.”
These initial bulkheads were built on the B and F levels of the mine and in the Terry Tunnel
where it connected to the mine workings. The primary objective was to contain water in the mine
workings and prevent rapid discharge of mine waters out the Mogul mine workings. In 1994-
1995 the water levels behind the bulkhead immediately began to rise and this was most evident
from the >100 times increase in flows at the un-bulkheaded Mogul mine portal between 1992
and 2001 (~2 gpm to 249 gpm), which was connected to the F level of the Sunnyside mine
workings. This suggests that the mine workings flooded first and then water exited the mines
when it reached the lowest levels that had tunnels to the surface (e.g., Mogul). Figure 11 tracks
the changes in mine discharges from 1991 (before bulkheading) up until 2020.
The first Bulkhead was installed in the American Tunnel on September 9th, 1996, to reduce
flows from the Sunnyside Mine workings into the American Tunnel. Flows at the AT portal were
decreased from > 1,500 GPM to around 500 GPM after the installation of bulkhead #1
suggesting that about 2/3 of the water exiting the AT before bulkheading was coming directly
from the Sunnyside Mine workings. Flows increased at the Mogul from 1992 to 2001 while
essentially no flows were recorded from the R&B, which is not directly connected to the
Sunnyside workings. The Red and Bonita mine portal was observed to be dry until 2002.
Measured discharges from the Red and Bonita in 2002 were 3 gpm on June 20th, and 10 gpm on
September 5th. Two years later in September of 2004, discharge from the Red and Bonita mine
portal was observed to have significantly increased and was measured at 72 gpm (ARSG, 2010,
figure 12).
As the mine pool was filling and spilling out other mine access points (most notably, Mogul
Mine), it was also likely gradually increasing the water table of the entire mountain by filling up
the secondary porosity (fractures) in surrounding rock of the Bonita Peak area. As the ground
water table continues to rise it intercepts anthropogenically physically disconnected, but
19Mountain Studies Institute Conceptual Site Model for BPMD OU3
proximal mine workings, that reside within the rebounding water table (e.g., GK and R&B) at
varying times following the bulkhead closure. The permeability and tortuosity of the naturally
occurring secondary porosity (fractures in host rock) surrounding mine workings (considered to
be tertiary porosity) controls the rate and magnitude of water movement from the flooded
Sunnyside mine workings or tunnels to the surrounding host rock. The time required to reach
water table equilibrium with surrounding host rock is not well understood but could feasibly
range from months to decades or longer depending on site specific conditions. As a result, it is
important to develop appropriate spatial and temporal monitoring programs with any bulkhead
closure that can adequately capture the unknown time to equilibrium.
Figure 12. Bulkhead Closures and mine adit flows in upper Cement Creek from 1991 to 2020. (Deere & Ault Consultants, 2021).
It is also fundamental to quantify the climate driven water balance and how it factors in. For
example, after bulkheading the region began to experience drought in early 2000’s (2002 lowest
water year on record at Red Mountain Pass). Drier conditions mean less total recharge to the
groundwater tables that are increasing behind the new bulkheads and a longer time to reach non-
drought equilibrium groundwater levels. The dry hydrologic years following bulkheading likely
influenced the length of time until mine discharges increased significantly at the other adits.
20Mountain Studies Institute Conceptual Site Model for BPMD OU3
During the first few years (96-98’) of monitoring mine discharges after the AT#1 bulkhead,
there was also only intermittent seasonal flows from the GK adit. These flows appeared to
fluctuate from zero at low flow to 30-40 GPM during high flow (summer) measurements. This
result suggests that during this time there was no direct hydrologic connection between the
Bonita Peak groundwater filling the AT/Sunnyside mine workings behind bulkhead #1 and the
predominantly dry Gold King Mine workings. The small volumes of water at the GK#7 adit
during high flow conditions were likely coming from localized annual snowmelt recharge
moving through the open GK workings and to the adit only during or just following snowmelt.
This result is important because it suggests there is, and has always been, a seasonal input of
water (snowmelt) directly to the GK workings each year which is likely separate from any
deeper groundwater that is finding its way to GK portal at present. This observation helps
explain why GK level 7 mine water quality and quantity has a brief seasonal snowmelt response
today even with a steady source of deeper groundwater that has maintained a significant
baseflow discharge year-round since the GK release (Cowie & Rock, 2020).
Blackhawk flows also appear to increase between 1996 and 2001 but flow measurements
were scarce and sampling location likely inconsistent due to natural groundwater inputs around
the portal. Whether or not the increase in flows at the Blackhawk (measured by Sunnyside in
annual reports) can be linked directly to AT bulkheads is still inconclusive at this time. High
resolution monitoring data has been collected at Blackhawk since 2017 and will provide more
information on impacts from future remedial actions.
5.4 Second phase of bulkheads: 2001-2005
AT bulkhead #2 was installed on August 31st, 2001, followed by AT bulkhead #3 the next
year on December 3rd, 2002. The final bulkhead installation on the Cement Creek side of Bonita
Peak was the Mogul in August of 2003. The anticipated hydrologic impacts of the bulkhead
closures are best described by Sorenson and Brown (2015).
“American Tunnel bulkhead #2 bypass pipe valve closure occurred on August 31, 2001. The
bulkhead was installed 2000 feet inbye the portal at an elevation of 10,612 feet. On August
15, 2002, the final equilibrium pressure reading of 175 psi was collected at the bulkhead,
equating to a water table elevation of 11,015 feet (DRMS, 2002b). This elevation is 58 feet
higher than the elevation of the proposed Red and Bonita bulkhead, but several hundred feet
below the Mogul and Gold King level #7 portals. American Tunnel bulkhead #2 was
21Mountain Studies Institute Conceptual Site Model for BPMD OU3
designed and located in order to impound the inflows to the tunnel from the fracture zone at
2700 to 3100 feet inbye and seepage from a fault at 2030 feet inbye the portal. The fracture
zone and associated water inflow intersected the American Tunnel 640 feet directly below the
North Fork of Cement Creek. The design intent of the bulkhead was to force water into the
fracture zone. Therefore, the bulkhead was designed to resist a maximum water head of 640
feet (DRMS, 2001). As will be discussed below, the timing of discharge from the Red and
Bonita, the proximity of the Red and Bonita to American Tunnel bulkhead #2, the geologic
structure and topography between the mines, all indicate that the Red and Bonita drainage is
derived from water backed up behind American Tunnel bulkhead #2, and not from the
Sunnyside mine pool impounded by American Tunnel bulkhead #1.”
With greater understanding of the hydrology of the Bonita Peak groundwater and American
Tunnel mine water system in the 20 years following bulkhead closures there are now other
questions that influence the present-day conceptual understanding of OU3. The first question is
the validity of the assumption that the reported equilibrium pressure created a static water table
elevation of 11,015’. Specifically, the pressure was only measured for one year following
bulkheading and that year (2002) was the driest hydrologic year on record for the Silverton area.
With an improved understanding of the potentially large interannual hydrologic variability in the
area (Cowie & Rock, 2020) it can be assumed that groundwater (and mine pool water) recharge
was significantly lower during the monitoring period following bulkhead closure. Additionally,
the R&B and GK mines begin to discharge several years later following wetter hydrologic years
of the late 2000’s (see annual precipitation on figure 12). The assumptions on reaching water
level equilibrium after closing bulkheads may therefore need additional analysis that also factors
in interannual hydrologic variability.
Secondly, the compound impacts of multiple bulkheads along the same mine tunnel and
within the same groundwater system (Bonita Peak) may be complex and take many years or
longer to fully express. Since the bulkheads are only physically blocking water movement within
the mine tunnel the vertical movement of water backed up behind the bulkheads and into the
surrounding primary and secondary pore spaces may not be directly interpreted by direct
pressure on the bulkhead face alone. As a result, the conceptual understanding of groundwater
interactions from multiple bulkheads is not fully understood for the Bonita Peak area. It may be
possible to see a combined pressure head influence from multiple bulkheads in the American
Tunnel on the groundwater in Bonita Peak that took years to develop and could have non
uniform lateral and vertical distribution in three-dimensional space. Since the groundwater flow
22Mountain Studies Institute Conceptual Site Model for BPMD OU3
and movement is predominantly driven by secondary and tertiary (mine workings) porosity in a
fractured bedrock setting, it is reasonable to expect groundwater to “fill and spill” in various
locations across large sections of Bonita Peak and thus emphasizes the importance of
comprehensive spatial and temporal monitoring of groundwater expressions following bulkhead
installations. Additionally, there is currently no way to monitor the pressures behind the internal
AT bulkhead #2 which may be addressed with installation of an additional monitoring well into
the AT behind bulkhead #2. Since 2017 the NFPZ1 monitoring well is intended to be a proxy for
understanding water table elevations behind AT bulkhead #2 and analysis of this data is ongoing.
The final observed water level in the Sunnyside mine workings was reported 11,671 ft on
May 14th, 2001 (DRMS, 2003). This was prior to finishing off the bulkheading which effectively
closed off all internal access to the mines or ability to monitor mine pool water levels. The
present-day Sunnyside mine pool elevations are only assumed. Establishing present-day mine
pool water levels by installing wells is currently planned under the OU3 RI.
The GK and R&B mines begin to flow significantly around 2005 (figure 12) several years
after the final AT bulkhead was closed. Data from other non-bulkheaded mines in the area (e.g.,
Blackhawk and Natalie Occidental) is sparce in this time period so it cannot be fully determined
if the increases at GK and R&B were isolated events solely related to the AT bulkheading or if
there were other environmental factors such as increased annual precipitation as well. The most
comprehensive interpretation of the R&B mine discharge increases around 2005, relative to
historical information, is provided by Sorenson and Brown (2015).
“The Red and Bonita adit had been driven, relatively minor stopping had occurred, and
the mine had been abandoned by between 1897 and 1907 (Ransome, 1901; NPS, 2010).
The portal has been caved and the mine inaccessible since that period of operations until
the EPA rehabilitated the portal in 2011. There are diversions and other works within the
Red and Bonita that demonstrate that the early miners had to manage water inflows to
the workings, and the vegetation kill-zone in the valley below the Red and Bonita mine
dump indicates that the mine had discharged historically, although the vegetation also
appears to have been smothered by tailings from the Red and Bonita mill. However,
CIMRP has found no information sources to indicate drainage from Red and Bonita was
occurring in the 1950s, prior to drainage of the Sunnyside Mine via the extension of the
American Tunnel discussed previously. It is likely that the initial driving of the American
Tunnel (then called the Gold King Tunnel) around 1900, had cut the water bearing
fracture zone 2700 to 3100 feet inbye, which drained the Red and Bonita curtailing its
discharge. The initial driving of the tunnel around 1900 reportedly terminated
approximately one mile from the portal. Once American Tunnel #2 bulkhead was
23You can also read