HY 2021 Results Presentation - Tuesday 23 March 2021 Half Year Results to 31 January 2021

Page created by Jennifer Lyons
 
CONTINUE READING
HY 2021 Results Presentation - Tuesday 23 March 2021 Half Year Results to 31 January 2021
Tuesday 23 March 2021

HY 2021
Results Presentation
Half Year Results to 31 January 2021
HY 2021 Results Presentation - Tuesday 23 March 2021 Half Year Results to 31 January 2021
Disclaimer

This presentation contains forward-looking statements that reflect YouGov’s current views with respect to future
events and financial and operational performance. These forward-looking statements are based on YouGov’s beliefs,
assumptions and expectations regarding future events and trends that affect YouGov’s future performance, taking into
account all information currently available to YouGov, and are not guarantees of future performance. By their nature,
forward-looking statements involve risks and uncertainties because they relate to events and depend on
circumstances that may or may not occur in the future, and YouGov cannot guarantee the accuracy and completeness
of forward-looking statements. A number of important factors, not all of which are known to YouGov or are within
YouGov’s control, could cause actual results or outcomes to differ materially from those expressed in any forward-
looking statement as a result of risks and uncertainties facing YouGov. Any forward-looking statements are made only
as of the date of this presentation, and YouGov assumes no obligation to publicly update or revise any forward-looking
statements, whether as a result of new information or for any other reason.
HY 2021 Results Presentation - Tuesday 23 March 2021 Half Year Results to 31 January 2021
Key Highlights
Stephan Shakespeare, CEO
HY 2021 Results Presentation - Tuesday 23 March 2021 Half Year Results to 31 January 2021
Robust underlying revenue and profit growth in line with expectations

Financial Summary
•       Revenue growth of 3% (9% on an underlying1 basis) with a strong sales pipeline weighted towards the second half of the financial year

         •       Record sales seen in December 2020 with that strong momentum continuing into 2021

         •       Several multi-year contracts secured in the last three months, underpinning our confidence for the future

•       Underlying1 operating profit up by 15%, representing a margin of 14.2% (HY20: 13.5%), despite absorbing an increased non-cash share-
        based payment charge

             •    Adjusted operating profit2 down 7% to £10.5m (HY20: £11.3m) impacted by planned closure of Kurdistan business

•       Adjusted earnings per share3 up by 11% to 9.7p (HY20: 8.7p)

•       Net cash balances of £27.5m (31 January 2020: £27.2m); cash conversion of 92%

             •    Cash balance maintained despite increased investments in panel and technology and payment of dividends in December 2020

    •     Continued investment in the business for further growth supported by a strong, debt-free balance sheet

        1 Defined as growth in business excluding impact of current and prior period acquisitions and Kurdistan business closure, and movement in exchange rates.
        2 Defined as operating profit including amortisation of intangible assets charged to operating expenses and excluding separately reported items.
        3 Defined as earnings per share before the post-tax impact of share based payment charges, imputed interest and separately reported items.
HY 2021 Results Presentation - Tuesday 23 March 2021 Half Year Results to 31 January 2021
Underlying business continues to deliver strong bottom-line growth in line
with our long-term growth plans

                                                                              Adjusted Basic EPS1 (p per share)

20.0
18.0                                                                                                                                                               11% growth
                                                                                                                18.1                                          44% on underlying2 basis
16.0
14.0                                                                                    15.0
12.0
10.0                                                            11.5
 8.0                                                                                                                                                                            9.7
                                                                                                                                                                 8.7
 6.0
                                        6.2
 4.0            4.8
 2.0
 0.0
             FY 2016                 FY 2017                 FY 2018                 FY 2019                 FY 2020                                           HY 2020        HY 2021

  1 Defined as earnings per share before the post-tax impact of share based payment charges, imputed interest and separately reported items.
  2 Defined as growth in business excluding impact of current and prior period acquisitions and Kurdistan business closure, and movement in exchange rates.
HY 2021 Results Presentation - Tuesday 23 March 2021 Half Year Results to 31 January 2021
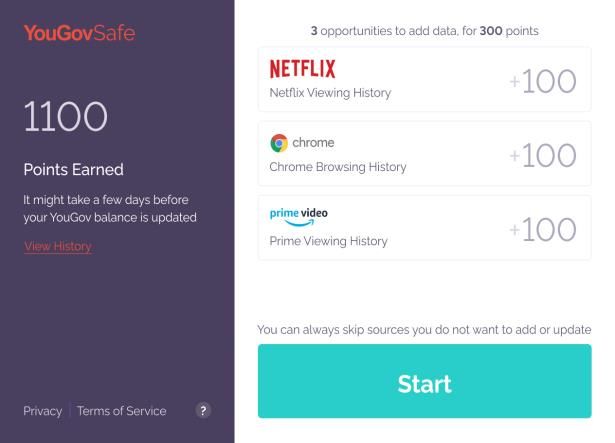
Continuing to execute against our stated strategy and increase the
relevance of our business proposition
Operational Highlights

   •   Stronger demand for more tactical, fast turnaround projects as   Continued investment in the business for further growth supported by a
       our clients adjusted to the pandemic                             strong balance sheet:
   •   Completed the transition to a client-centric account             •   Commenced the biggest simultaneous expansion of YouGov’s panel
       management structure in the US and UK which led to                   into 15 new markets allowing sales teams to target more global
       significant new contract wins towards the end of the period          contracts
   •   Turnaround in Mainland Europe following the unification of our   •   Developed YouGov Safe to allow users to generate personal value
       European teams completed last year                                   from data portability initiatives while giving them control to securely
                                                                            and safely store data
                                                                        •   Expanded YouGov Direct into new markets and integrated with
                                                                            YouGov Chat to acquire members
                                                                        •   Continued evolution to bring our core data products and services onto
                                                                            a single platform and unify our member base for a simpler, more
                                                                            rewarding panellist experience
HY 2021 Results Presentation - Tuesday 23 March 2021 Half Year Results to 31 January 2021
Financial Updates
Alex McIntosh, CFO
HY 2021 Results Presentation - Tuesday 23 March 2021 Half Year Results to 31 January 2021
Revenue Performance by Division
                                                                                                                                                        Group Revenue (£m)
•   Data Products performance has been moderate as the shift in                                                                                             3% growth
    account management structure pushed sales, in our key US and                                                                                       9% on underlying1 basis
    UK markets, into the latter half of the period

                                                                                                                                                76.9                                        79.0
•   Data Services benefitted from a global recovery in demand for
    fast turn-around research projects as clients adjusted to the “new
    normal”
                                                                                                                                             HY 2020                                       HY 2021

•   Custom Research saw stable underlying growth trends
                                                                                                                                                    Revenue1 by Division (£m)
     •    Mainland Europe performed well on the back of contract wins
          in the previous year that leveraged our connected data                                                                                                          2%
          proposition                                                                                                                                                                         30.1
                                                                                                                                                33.9
     •    US benefitted from non-recurring election work
                                                                                                                                                18.4                                          21.8
     •    Reported results offset by the expected closure of operations
          in Kurdistan in the prior year period                                                                                                 25.1                                          26.5

                                                                                                                                           HY 2020                                          HY 2021
                                                                                                                                        Data Products              Data Services            Custom Research

    1 Growth figures are on an underlying basis. Defined as growth in business excluding impact of current and prior period acquisitions and Kurdistan business closure, and movement in
    exchange rates.
Revenue Performance by Sector
                            HY 2020                                                                     HY 2021

                                         Agencies                                                                 Agencies
                 Other                     14%                                            Other                     15%
                 27%                                                                      27%

                                                                                                                             Technology
                                                    Technology                                                                  13%
                                                       17%

             Retail                                                                    Retail
              4%                                                                        5%                               Banking &
                                                                                                                         Insurance
              Sports                           Banking &                                  Sports                            9%
               7%                              Insurance                                   7%
                                                  8%                                                               Media Owners
               Government                                                                  Government
                  9%         FMCG     Media Owners                                                         FMCG         8%
                                                                                                8%
                              6%           8%                                                               8%

•   Growth seen in Retail and FMCG sectors as the pandemic reinforces the importance for online, data-driven research for consumer-
    facing businesses
•   Government sector has seen good growth, but contribution impacted by planned Kurdistan closure
•   Sports business has maintained its contribution despite the sector being heavily disrupted by the pandemic
•   New initiatives in the gaming and e-sports and healthcare segments have made good progress during the pandemic
Adjusted Operating Profit1 Performance by Division and Geography

•   15% growth in underlying2 operating profit (excluding impact of planned                                                                           6 months to 31 January 2021
    Kurdistan closure and FX)                                                                                                                          Adjusted Operating Profit1
     •    Represents an underlying2 operating profit margin of 14.2% (HY20:
          13.5%)                                                                                                                                                             0%
                                                                                                                                                                       -1%
•   Slight decline in Data Products margin due to lower revenue growth
                                                                                                                                                                   9%
•   Data Services margin expanded benefitting from operational leverage
•   Custom Research margin impacted by closure of the Kurdistan business
                                                                                                                                                                                      38%
                             Six Months          Six Months          Operating            Operating Margin
                                  to                  to               Profit            Year to     Year to
                             31 Jan 2021         31 Jan 2020          growth             31 Jan      31 Jan
                                 £m                  £m                  %                2021        2020
Data Products                      8.8                8.5                4%               33%              34%

Data Services                      3.7                2.8                33%              17%              15%
                                                                                                                                                                 52%
Custom Research                    4.7                8.0               (41%)             16%              24%

Central costs                     (6.7)              (8.0)                 -                 -               -
                                                                                                                                     UK       Americas          Mainland Europe   Middle East   Asia Pacific
Group                             10.5               11.3                (7%)             13%              15%

    1 Defined as operating profit including amortisation of intangible assets charged to operating expenses and excluding separately reported items.
    2 Defined as growth in business excluding impact of current and prior period acquisitions and Kurdistan business closure, and movement in exchange rates.
Balance Sheet

                                                                                             31 Jan 2021   31 Jan 2020
•   Debtor days decreased from 34 days to 33 days                                                £m            £m
                                                             Non-current Assets
                                                             Goodwill                            60.2          63.6
•   Creditor days increased to 25 days from 24 days
                                                             Other intangible assets             27.2          19.0
                                                             Other non-current assets            28.0          22.0
                                                             Total                              115.4         104.6
•   Contingent consideration of £9.5m due to be paid by 31   Current Assets
    January 2022                                             Trade and other receivables        37.1          31.9
                                                             Cash                               27.5          27.2
                                                             Current tax assets                 0.7           2.4
•   No debt; cash balance of £27.5m as at 31 January 2021    Total                              65.3          61.5
                                                             Current Liabilities
                                                             Trade and other payables           36.0          36.4
                                                             Contingent consideration           9.5           1.6
                                                             Provisions                         8.2           5.5
                                                             Other current liabilities          3.3           3.5
                                                             Total                              57.0          47.0
                                                             Non-Current Liabilities
                                                             Contingent consideration             -            2.3
                                                             Long term lease liabilities         10.9          7.3
                                                             Other non-current liabilities       6.4           6.5
                                                             Total                               17.3          16.1
                                                             Net Assets                         106.4         103.0
Cash Flow

•   Steady generation of cash from operations at £18.5m; 92% of                    Cash generation and conversion
    adjusted EBITDA
    •   Stable cash conversion as the business remains highly cash      20               93%                           92%            100%
        generative enabling continued investments for growth                            17.3                         18.5
                                                                        10                                                            50%
•   Higher cash outflow from investing activities includes:
    •   £6.1m on panel recruitment as we establish and further              0                                                         0%
        develop panel globally                                                        HY 2020                       HY 2021
                                                                                   Operating cash generation (£m)       Cash conversion
    •   £5.2m on technology development related to new products,
        the YouGov platform and our websites and mobile
        applications                                                                    Capital Expenditures (£m)
•   Financing outflow includes £5.5m on dividend payments and                                                            0.6
                                                                     12.0
    £2.2m on purchase of own shares
                                                                                         0.6
                                                                                                                         6.1
•   Net cash outflow since 31 July 2020 of £7.3m                      7.0
                                                                                         4.2
•   Cash balance at end of period £27.5m (31 January 2020:
    £27.2m)                                                                                                              5.2
                                                                      2.0                3.5

                                                                                      HY 2020                          HY 2021
                                                                     -3.0
                                                                                Technology         Panel recruitment           PP&E
Operational Updates
Sundip Chahal, COO
YouGov DataProducts

YouGov’s Data Products division is comprised of our syndicated
data products suite including YouGov BrandIndex and YouGov
Profiles as well as newer sector specific offerings such as YouGov
SportsIndex and YouGov DestinationIndex.                                                60                                                                        40%
                                                                                                         34%         35%                      34%        33%
                                                                                        50    31%
                                                                                                                     51.3
•   All geographies contributed to growth in the period                                                                                               Growth in   30%

                                                                           Revenue £m
                                                                                        40                                                             period:
                                                                                                         41.5
•   Implemented a new account management structure as planned                                                                                            6%
    to achieve our current strategic growth plan                                        30                                                                        20%
                                                                                              30.4
•   Performance was more moderate as the reshuffle shifted                                                                                    25.1       26.5
    contract wins into the latter half of the period                                    20
                                                                                                                                                                  10%
•   Strong sales pipeline for syndicated Data Products augmented                        10
    by long-term custom trackers
                                                                                        0                                                                         0%
•   Slight decline in divisional margin as a result of lower operational                     FY 2018    FY 2019     FY 2020                 HY 2020    HY 2021
    leverage
                                                                                                     Revenue (£m)           Adj. Operating Profit Margin %
YouGov DataServices

Our Data Services division consists of our fast-turnaround research
services, including our market-leading YouGov Omnibus.

                                                                                   40                                                                               30%
•   Strong growth was seen across most regions as pent-up demand                   35                37.2         37.8                                Growth in
    for fast-turnaround tactical project work was released                                                                                             period:      25%
                                                                                   30    21%                                                               19%
                                                                                                     20%
    •   Mainland Europe returned to double digit growth                                  29.0                                                                       20%

                                                                      Revenue £m
                                                                                                                  18%
                                                                                   25                                                                      17%
    •   US saw stellar growth in the period, up 33% on a reported                                                                           15%
                                                                                   20                                                                      21.8     15%
        basis
                                                                                                                                            18.4
                                                                                   15
    •   Asia Pacific saw strong growth as well as the COVID-19                                                                                                      10%
        situation was largely stable in the region                                 10
                                                                                                                                                                    5%
•   Margin in the division improved to 17% on the back of strong                   5
    revenue growth and increased efficiencies in the research
                                                                                   0                                                                                0%
    process                                                                             FY 2018     FY 2019      FY 2020                  HY 2020         HY 2021

                                                                                                  Revenue (£m)           Adj. Operating Profit Margin %
YouGov CustomResearch

YouGov’s Custom Research division offers a wide range of
quantitative and qualitative research, including substantial global
trackers, that is tailored by sector specialist teams to meet clients'
specific requirements
                                                                                                                                  70                                                                            50%
                                                                                                                                                                                                   Decline in   45%
•   Mainland Europe saw strong growth following contract wins in                                                                  60                             64.6
                                                                                                                                                                                                    period:
                                                                                                                                        58.7       60.0                                                         40%
    the prior year that adopted a regional approach to our Cube-                                                                                                                                     -11%
                                                                                                                                  50                                                                            35%

                                                                                                                     Revenue £m
    aligned tracking projects
                                                                                                                                  40                                                                            30%
•   Performance in the period has been impacted by the planned                                                                                                                           33.9                   25%
                                                                                                                                                                                                      30.1
    closure of the Kurdistan business in the prior year                                                                           30
                                                                                                                                                                                         24%                    20%
                                                                                                                                                   22%
                                                                                                                                        20%                      20%                                            15%
•   The US saw stable growth on the back of election work while the                                                               20
                                                                                                                                                                                                     16%
    UK was flat due to the reshuffle in sales structure                                                                                                                                                         10%
                                                                                                                                  10
                                                                                                                                                                                                                5%
•   Planned closure of the Kurdistan business accounted for half of                                                               0                                                                             0%
    the margin decline in the division while subdued top-line growth                                                                   FY 2018    FY 2019       FY 2020                 HY 2020    HY 2021
    on an underlying1 basis lowered ability to absorb central cost                                                                             Revenue (£m)             Adj. Operating Profit Margin %
    allocations

    1 Defined as growth in business excluding impact of current and prior period acquisitions and Kurdistan business closure, and movement in exchange rates.
Progress made on strategic priorities in the period

                                    •   Global expansion into 15 new markets across Europe, South America, the
                                        Middle East and North Africa
        Expansion of our panel      •   Developed plan to unify our member base for a simpler, more rewarding
                                        panellist experience

                                    •   Launched YouGov Direct in two new markets and developed YouGov Safe
        Investment in technology,   •   Commenced back-end integration of our products and tools to develop a
        products and platform           single YouGov platform
                                    •   Launched our new B2B website structured along our key sectors

        Efficiency though CenX      •   Stepped up recruitment in Mumbai and Bangalore CenXs to further expand
        model                           their role and extract more cost savings

        Focus on sales
                                    •   Completed the shift to a client-centric sales structure in the US, UK, Europe
        organisation and key            leading to large strategic project wins using our connected data proposition
        global accounts

                                    •   Completed acquisition of Wizsight, a Turkish online-focussed research
        Acquiring and integrating       agency
        bolt-on acquisitions        •   Announced the acquisition of Charlton Insights, a Canadian sports research
                                        firm
Strategic Update and Outlook
Stephan Shakespeare, CEO
YouGovSafe
Unlocking verified online behavioral data while rewarding our members

YouGov Safe is the latest enhancement to the YouGov connected data ecosystem, strengthening self-reported panellist survey data with
verified online behavior for truly unique 360-degree consumer intelligence. It is a fully opted-in cross-device tracker of online behavioral data
including streaming, gaming, shopping, search and more. Designed in response to GDPR/CCPA regulations, it boosts our ESG commitment to
pioneering data privacy and control for citizens.

                 Connected data
                 Integrated with existing YouGov data products and cross-
                 references reported opinions with verified consumer actions

                 Granular ad targeting & re-contacts
                 Enables seed marketing on a granular level to a hyper-targeted
                 audience

                 Reach & reward
                 Provides access to our highly engaged and expanding global
                 panel of fully opted-in users in 22 countries

                 Powerful data analysis
                 Results available in our easy-to-use data tools, YouGov
                 Profiles and YouGov Signal, with ability to design a customized
                 research project
Long-term growth targets

We believe our progress thus far this year, our operational resilience, and our flow of innovations, keeps us on-plan for meeting the ambitious
targets of our 2019-23 growth plan:

                              1                                                                           2                                                                  3
                        Double                                                            Double Group Adjusted                                                  Achieve an Adjusted Earnings
                     Group Revenue                                                        Operating Profit1 Margin                                               Per Share2 compound annual
                                                                                                                                                                  growth rate in excess of 30%

   1 Defined as operating profit operating profit including amortisation of intangible assets charged to operating expenses and excluding separately reported items.
   2 Defined as earnings per share before the post-tax impact of share based payment charges, imputed interest and separately reported items.
Current Trading and Outlook

  •   Trading in the second half is off to a good start with a strong sales pipeline weighted towards the second half of the financial year

      •   Current trading in line with Board expectations for the full year

      •   Strong balance sheet enabling further investment in our strategic initiatives, technology and panels

      •   Resilient business model, especially in light of unprecedented headwinds over the past twelve months

      •   Remain confident of meeting our long-term targets

  •   Continue to see no material impact to date from the COVID-19 pandemic

      •   Extensive measures to ensure the safety of our employees and phased our return-to-office plans maintained

      •   No employees furloughed or government support needed

      •   Clients increasingly expect their marketing budgets to deliver better return on investment which bodes well for our data-driven
          research approach

      •   Investment in strategic areas continued through sufficient cash reserves with no debt balances
Thank you
You can also read