Human-in-the-loop model explanation via verbatim boundary identification in generated neighborhoods
←
→
Page content transcription
If your browser does not render page correctly, please read the page content below
Human-in-the-loop model explanation via
                                             verbatim boundary identification in generated
                                                           neighborhoods

                                         Xianlong Zeng, Fanghao Song, Zhongen Li, Krerkkiat Chusap, and Chang Liu

                                         School of Electrical Engineering and Computer Engineering, Ohio University, Athens,
arXiv:2106.13093v1 [cs.AI] 24 Jun 2021

                                                                            OH 45701 USA
                                                                     {xz926813, liuc}@ohio.edu

                                               Abstract. The black-box nature of machine learning models limits their
                                               use in case-critical applications, raising faithful and ethical concerns that
                                               lead to trust crises. One possible way to mitigate this issue is to un-
                                               derstand how a (mispredicted) decision is carved out from the decision
                                               boundary. This paper presents a human-in-the-loop approach to explain
                                               machine learning models using verbatim neighborhood manifestation.
                                               Contrary to most of the current eXplainable Artificial Intelligence (XAI)
                                               systems, which provide hit-or-miss approximate explanations, our ap-
                                               proach generates the local decision boundary of the given instance and
                                               enables human intelligence to conclude the model behavior. Our method
                                               can be divided into three stages: 1) a neighborhood generation stage,
                                               which generates instances based on the given sample; 2) a classification
                                               stage, which yields classifications on the generated instances to carve out
                                               the local decision boundary and delineate the model behavior; and 3) a
                                               human-in-the-loop stage, which involves human to refine and explore the
                                               neighborhood of interest. In the generation stage, a generative model is
                                               used to generate the plausible synthetic neighbors around the given in-
                                               stance. After the classification stage, the classified neighbor instances
                                               provide a multifaceted understanding of the model behavior. Three in-
                                               tervention points are provided in the human-in-the-loop stage, enabling
                                               humans to leverage their own intelligence to interpret the model behav-
                                               ior. Several experiments on two datasets are conducted, and the exper-
                                               imental results demonstrate the potential of our proposed approach for
                                               boosting human understanding of the complex machine learning model.

                                               Keywords: Explainable artificial intelligence · method classification ·
                                               human-in-the-loop · deep learning

                                         1    Introduction

                                         Machine learning models are typically designed and fine-tuned for optimal ac-
                                         curacy, which often results in layers of weights that are difficult to explain or
                                         understand. In the meantime, recent successes of machine learning systems have
                                         attracted adoption from more end-users, who need to better understand the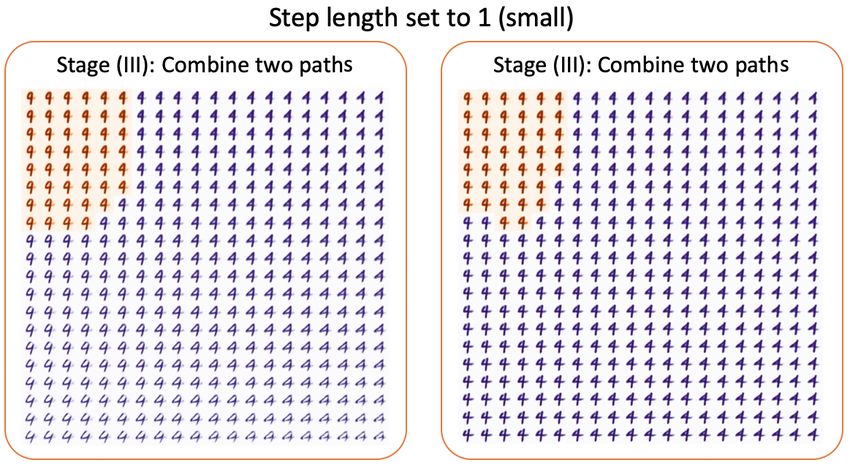
2      Zeng et al.

model in order to trust or properly use such machine learning systems. To make
these two ends meet, researchers and practitioners alike have adopted several ap-
proaches, including 1) using approximate models just for explanation[2]; 2) linear
local explanation for complex global models (e.g. LIME[9]); 3) example-based ex-
planation by finding and showing most influential training data points[5]. These
approaches all have their own merits, but none of them deliver everything needed
by end-users[10].
    The fundamental limitation of these approaches is that they assume that
1) certain aspects of machine learning systems, especially complex deep neural
networks, cannot be understood by human beings, and 2) typical human users
can only understand simple concepts such as linear systems.
    We have an opportunity to improve on previous attempts with two assump-
tions. First, human users are intelligent, just not in the same way as machines.
Humans can identify patterns intelligently but may not be able to scale up to
thousands of data points easily. Second, machine learning systems are built to re-
flect actual physical systems that follow logical and physical rules. What worked
well most likely can be explained, even though the explanation could be complex.
What cannot be explained most likely is not a good reflection of the underlying
physical properties.
    We intend to make improvements in this area by 1) presenting various aspects
of the actual model through verbatim model manifestation (instead of trying
to approximate the models), and 2) identifying and generating a manageable
number of data points to present to users in the local context of the point-of-
interest, so that human users can use their own intelligence to understand what
the actual model is trying to do within a limited scope that is manageable by a
human being.
    With this intuition, we aim to design an approach to facilitate human users’
understanding of machine learning models through 1) verbatim manifestation of
certain aspects of the underlying machine learning systems and 2) contextualized
visualization of carefully curated or generated data points that facilitates human
understanding. In other words, we try to build a bridge between machine and
human intelligence to address machine learning models’ explainability problems.
Furthermore, we observe that a typical human user does not need to understand
the complete machine learning model to gain confidence in the results from the
model. The user only needs to understand the rationale behind the decision
related to the current task.
    In this paper, we present a three-stage human-in-the-loop XAI system, a high-
level illustration of which is depicted in Figure 1. For a given (mispredicted)
point-of-interest, our framework tries to carve out its local decision boundary
and delineate the model behavior through a neighborhood manifestation. Our
framework leverages variational autoencoders (VAE) to generate neighborhood
examples that cross the decision boundary. Human users are involved in ex-
ploring the neighborhood through three carefully designed intervention points.
These intervention points help human users limit the neighborhood’s scope and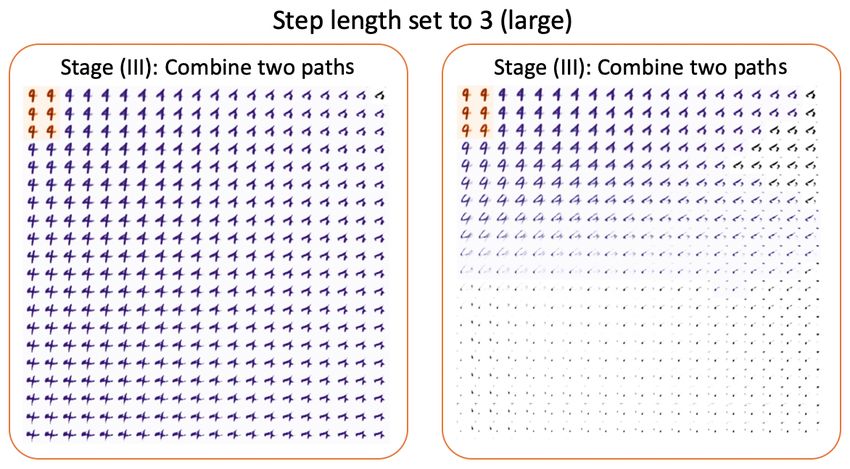
Title Suppressed Due to Excessive Length          3

enable them to gain insights from the model behavior. The source code of our
work is public available on GitHub: https://github.com/drchangliu/xai.
   The main contributions of our work are:
 – We proposed a novel human-in-the-loop framework that could mitigate the
   trust crisis between human users and machine learning models.
 – Several case studies are presented to illustrate the potential of our approach
   to facilitating human understanding of complex machine learning models.
 – A general framework to depict the local decision boundary around the (mis-
   predicted) instance-of-interest.

Fig. 1. A high-level illustration of our proposed framework. a) For a (mispredicted)
point-of-interest (red x) and a trained machine learning model, b) our framework tries
to carve out the local decision boundary and delineate the model behavior through a
manageable neighborhood manifestation. c) Images of sandals and ankle boot from the
fashionMNIST dataset that cause confusion to a classifier. Human users can under-
stand the classification errors by seeing the context that some sandals have boot-shape
heels. Another classification error is from the Caltech 101 dataset. Trust crisis can be
mitigated given the context that some chairs have fan-shaped bases.

2    Related Work
Machine learning researchers and practitioners have always used techniques and
tools to better understand machine learning models. In this section, we examine
a few state-of-the-art tools that are publicly accessible in an attempt to shed
some light on how they can help software engineers adopt machine learning
components.
4      Zeng et al.

    To understand the information flow of a deep network, Ancona et al.[1]
has studied the problem of assigning contributions to each input feature of a
network. Such methods are known as attribution methods, which can be di-
vided into two categories: perturbation-based and backpropagation-based. The
perturbation-based methods, such as Occlusion [18], LIME [9] and Shapely value
[2], change the input features and measure the difference between the new out-
put and the original output, while backpropagation-based methods compute the
attributions for all input features through the network. Backpropagation-based
methods include the feature-wise manner and the layer-wise manner. Feature-
wise approaches includes Gradient*Input [13] and Integrated Gradients [15]).
Layer-wise approaches includes Layer-wise Relevance Propagation [3], Class ac-
tivation maps [14][11][4][16] and DeepLIFT [12].

   Among these related research efforts, LIME [9] and DEEPVID [17] are the
two most relevant methods as compared to our framework. LIME, proposed by
Ribeiro et al., was an approach that was able to explain the predictions of any
model[9]. LIME utilized a locally interpretable model to interpret the black-box
model’s prediction results and constructed the relationship between the local
sample features and the prediction results. Explanations from LIME do not
exactly reflect the underlying model. LIME describes the prediction outcomes
obtained even with different complex models, such as Random Forest, Support
Vector Machine, Bagged Trees, or Naive Bayes. LIME can handle different input
data types, including tabular data, image data, or text data.

    DEEPVID, proposed by Wang et al., was a visual analytics system that
leverages knowledge distillation and generative modeling to generate a visual
interpretation for image classifiers [17]. Given an image of interest, DEEPVID
applied a generative model to generate samples near it. These generated samples
were used to train a local interpretable model to explain how the original model
makes the decision. The difference between our approach and DEEPVID is that,
instead of utilizing interpretable models such as linear regression to provide
interpretation, our approach visualizes boundary examples directly. End-users
can then leverage their human intelligence to interpret the model decision.

    DeepDIG [6][7], developed by Karmi et al, was a framework that used to
characterize the decision boundary for deep neural networks. The main contri-
bution can be divided into two parts. The first part is to generating borderline
instances that are near the decision boundary. This part is completed in three
steps, the first and second steps are used to generate adversarial instances by
Autoencoder. The third step is used to generate the borderline instances based
on the binary search and adversarial instances produced after step one and step
two. The second contribution is related to the characterization that is used to
measure the decision boundary complexity in the input space and embedding
space. The input space complexity is calculated by the generated borderline in-
stances from the first contribution. The embedding space complexity is measured
by developing a linear Support Vector Machine (SVM) model.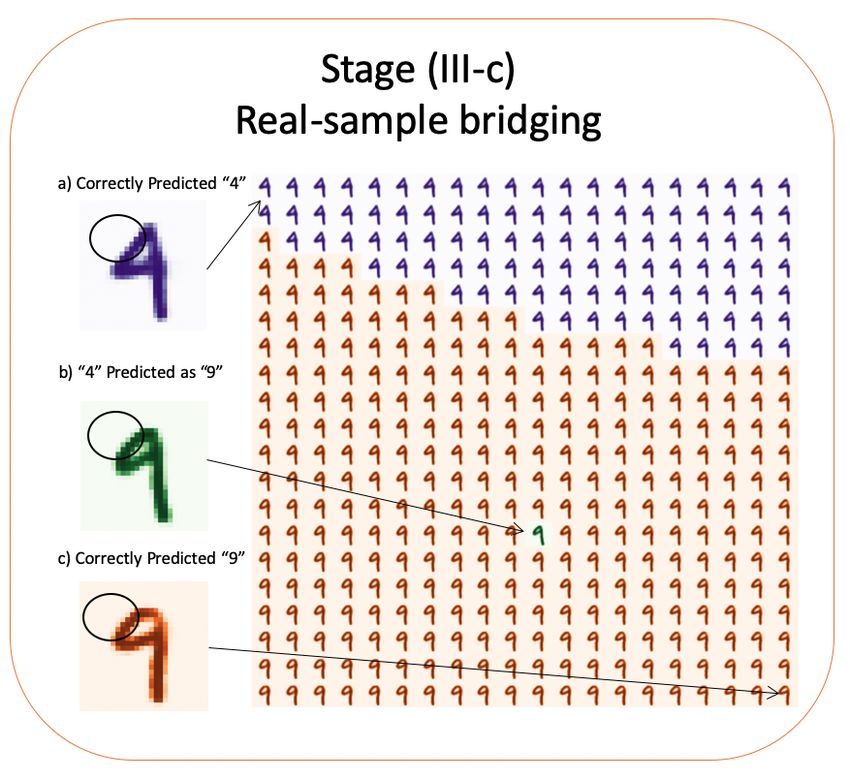
Title Suppressed Due to Excessive Length          5

3    The proposed human-in-the-loop framework

Given a trained machine learning model and a (mispredicted) point-of-interest,
we intend to generate a neighborhood that can enable a better human under-
standing of the model. The generated neighborhood needs to satisfy three critical
criteria:

 – The instances in the neighborhood need to be semantically close to the point-
   of-interest.
 – The decision boundary is at least partially visible within the neighborhood.
 – The neighborhood needs to maintain the number of instances in a manage-
   able size so that human users can gain insight from it.

    To generate a neighborhood that can satisfy the above three criteria, we
propose the human-in-the-loop framework that contains three stages, as shown
in Figure 2. In the first stage, a neighborhood is generated based on the given
sample through a trained generative model. In the second stage, the pre-trained
machine learning model is used to yield classification on the generated instances
to carve out the local decision boundary and delineate the model behavior. Next,
three intervention points are provided to enable human users for a throughout
exploration for gaining insights. In the following section, we explain each stage
in detail.

Fig. 2. The proposed human-in-the-loop framework. It contains three stages. In stage
(I), a neighborhood is generated based on the given sample through a trained varia-
tional autoencoder. In stage (II), the pre-trained machine learning model is used to
yield classification on the generated instances to carve out the local decision boundary
and delineate the model behavior. In stage (III), human users are enabled with three
intervention points to explore the neighborhood: a) refined multifacet path exploration,
b) “zoom-in”& “zoom-out” area exploration, and c) boundary-crossing morphing ex-
ploration.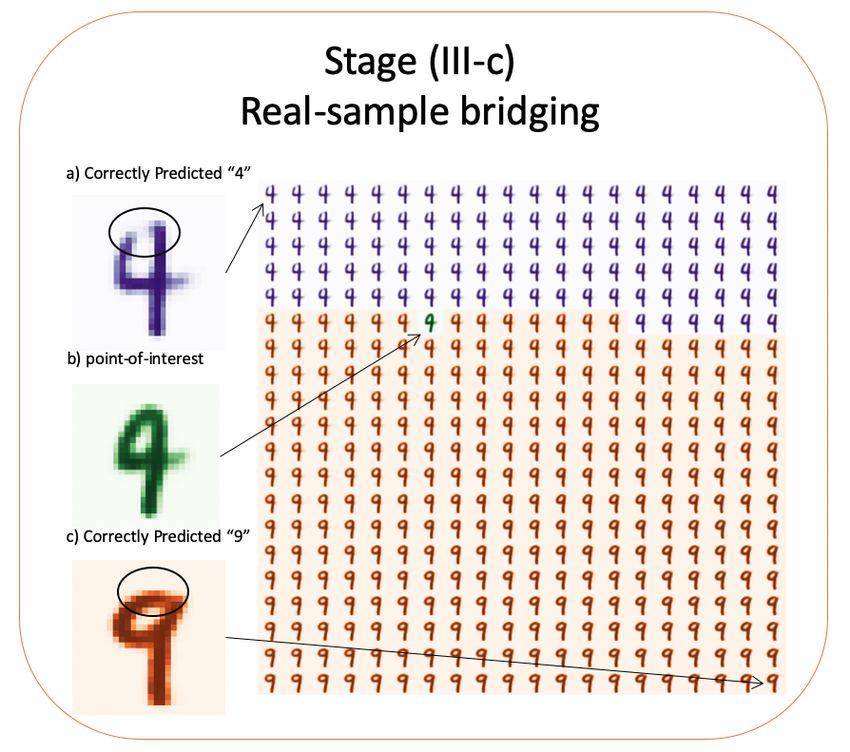
6       Zeng et al.

3.1   Stage (I): Neighborhood Generation

Stage one can be described as a stochastic process that generates neighbors
from the given point-of-interest. There are two approaches to accomplish such a
procedure: Variational Auto-Encoders (VAEs) and Generative Adversarial Net-
works (GANs). Both of these two generative methods assume an underlying
latent space that is mapped to the original data space through a deterministic
parameterized function. The generative model often consists of an encoder that
can map the given data into the latent space, and a decoder that can decode
the latent space vector back to the original space. In this work, we adopt VAE
as the generative model because of its more straightforward model structure.
    As shown in Figure 3, we train an encoder-decoder CNN-VAE with ten latent
dimensions on the MNIST dataset to learn the underlying latent distribution. A
hyper-parameter step-length is applied to each latent space via linear interpola-
tion to generate the perturbed latent vectors. The perturbed latent vectors are
then fed through the decoder to generate neighbors around the point-of-interest.
    More formally, a VAE model that consists of encoder qθ (z|x) and decoder
qφ (x|z) are trained on the dataset X, where X = {(x1 , y1 ), (x2 , y2 ), ..., (xn , yn )},
xi ∈ RD and yi ∈ [1, c]. The VAE is trained with the negative log-likelihood
with regularizer. The loss function li for data instance xi is:

                  −Ez−qθ (z|xi ) [logpθ (xi |z)] + KL(qθ (z|xi )||p(z)),               (1)

   where z ∈ Rd denotes the d-dimension embedding space learned by the VAE
encoder.
   Utilized by the trained VAE, examples near the point-of-interest can be gen-
erated and form the neighborhood. A hyper-parameter step-length needs to be
chosen to determine the border of the neighborhood. In practice, we set step-
length equal to one as the default value.

Fig. 3. The architecture of our selected generative model, i.e., a Variational AutoEn-
coder (VAE)

3.2   Stage (II): Neighborhood Classification

To identify and visualize the local decision boundary, the given trained machine
learning model is applied to the generated instances. The classification results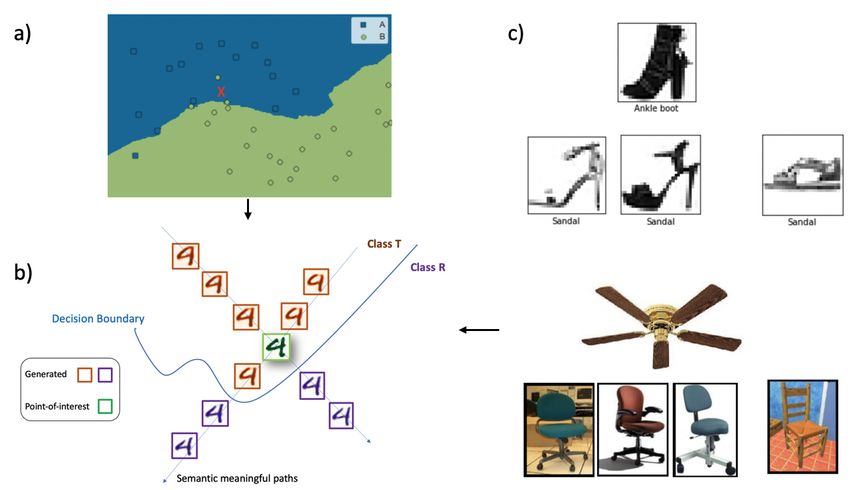
Title Suppressed Due to Excessive Length        7

are highlighted with different colors so that the model behavior can be delin-
eated. We call this classification results as classified neighborhood. A classified
neighborhood is one where every data point within the neighborhood has been
classified by the model-under-investigation so that the decision boundary is iden-
tified and visualized verbatim. Because the actual model is used, this is a ver-
batim manifestation of the model decision boundary within the neighbourhood.
In practice, a larger value of step-length is recommended to ensure a decision
boundary with clear difference between the opposite sides. In our experiments,
we set the step-length to 1.

3.3   Stage (III): Human-in-the-loop Exploration

Three intervention points are provided in our human-in-the-loop stage. Specifi-
cally,

 – a refinement intervention point that provides a multifacet refined neighbor-
   hood exploration.
 – a “zoom-in” & “zoom-out” intervention point that enables human users to
   take a closer look at the certain region of interest.
 – a morphing intervention point that selects two examples from each side of
   the decision boundary and creates a visualization path.

    For the first intervention point, human users are enabled to identify the di-
mensions of interest, i.e., specific dimensions from the d-dimensional latent space.
Next, we allow the human to adjust the hyper-parameter step-length along the
selected latent dimension for exploration. A larger value of the step-length will
enrich the semantic variation, while a smaller value can provide a more concen-
trated result. The step-length serves as a ”tuning knob” to adjust traversal speed
in the latent space, which helps human users to understand how a prediction is
carved out from specific changes.
    Human users are allowed to identify two hidden dimensions of interest for the
second intervention point and construct a morphing matrix based on these two-
dimension spaces. Allowing the morphing of two dimensions simultaneously can
provide a richer context around the point-of-interest. The second intervention
point acts as a “zoom-in”& “zoom-out” effect to assist human users in gathering
insights from the generated examples.
    For the third intervention point, a few instances that are semantically close
to the given point-of-interest at two sides of the decision boundary are provided.
Next, a morphing path between the two instances are created and the path
passes through the point-of-interest. The algorithm for identifying the nearest
neighbor and creating the morphing path is shown in Algorithm 1. Such mor-
phing traverses data manifold while crossing the decision boundary, which can
delineate the model behavior and explain how and why a particular image is
relevant to the prediction.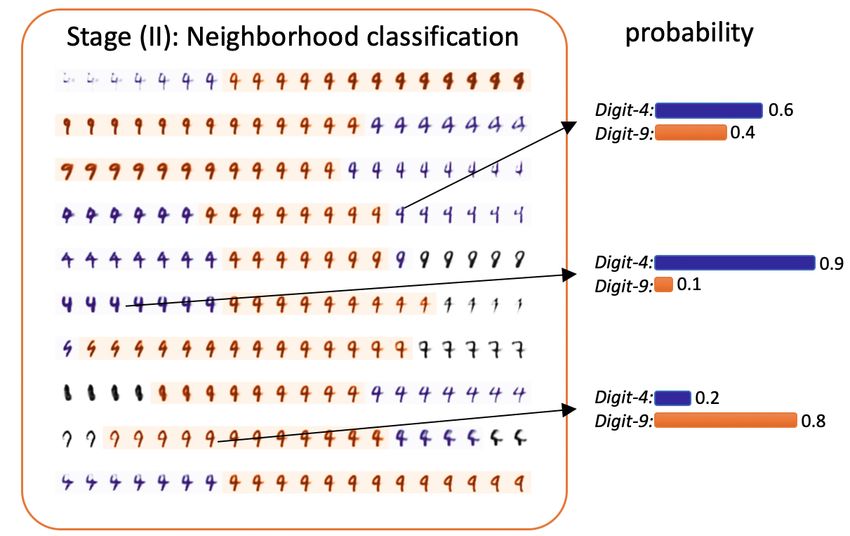
8         Zeng et al.

    Algorithm 1: Pseudocode for the proposed method
      Given: Dataset (X, Y )
      Given: Classifier F () to be interpreted
      Given: Pretrained VAE: (VAE-enc, VAE-dec)
      Given: Data instance of interest (xi , yi ), where yi = c1 , but mispredicted
       F (xi ) = c2
       1: enc-xi = VAE-enc(xi )
       2: for (xj , yj ) ∈ (X, Y ), yj = c1 do
       3:    enc-xj = VAE-enc(xj )
       4:    update xj s.t. kenc-xj − enc-xi kL1 is smallest
       5: end for
       6: for (xk , yk ) ∈ (X, Y ), yk = c2 do
       7:    enc-xk = VAE-enc(xk )
       8:    update xk s.t. kenc-xk − enc-xi kL1 is smallest
       9: end for
      10: interval=(enc-xk − enc-xi )/num-neighbors
      11: neighbors=[]
      12: labels=[]
      13: for i=0, i≤num-neighbors; i++ do
      14:     neigh = enc-xi ±interval
      15:     neighbors.append(neigh)
      16:     labels.append(F (neigh))
      17: end for
      18: Visualize(neighbors, labels)

4      Experiment Setup
To verify the effectiveness of our proposed framework, we conduct several ex-
periments on two datasets. Section 4.1 describes the datasets and the trained
machine learning model architectures. Section 4.2 presents the detailed experi-
mental settings for our framework.

4.1     Dataset and Trained machine learning Architecture
We investigate the proposed framework against two datasets, MNIST and Fash-
ionMNIST. The MNIST dataset is a large database of handwritten digits, while
FashionMNIST is a dataset of Zalando’s article images. The images in these
datasets are 28x28 grayscale images associated with a label of 10 classes. Both
MNIST and FasionMNIST are commonly used for training various image pro-
cessing machine learning models. The details of the datasets and the chosen
model performance are shown in Table 1.

4.2     Our proposed framework settings
In this subsection, we describe the training detail of each stage. Stage (I) utilizes
an autoencoder that is pre-trained on the dataset to generate the neighborhood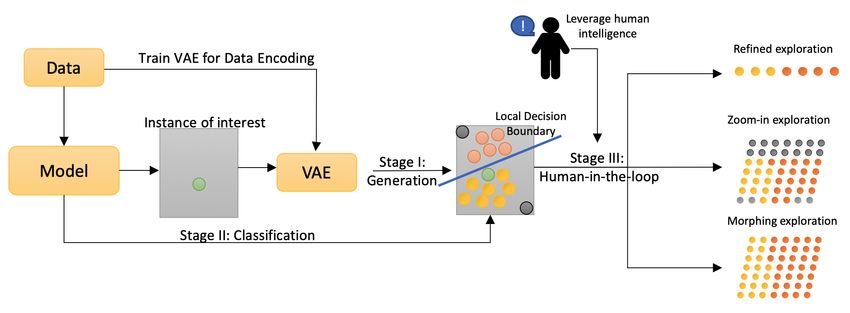
Title Suppressed Due to Excessive Length          9

                  Table 1. Description of the investigated datasets.

                                             MNIST    FashionMNIST
# of training examples                       60,000   60,000
# of testing examples                        10,000   10,000
# of output classes                          10       10
Original data space (i.e., # of dimension)   784      784
Test accuracy of the chosen model            94.1     92.5

based on the given point-of-interest. Table 2 demonstrates the hyper-parameters
of the pre-trained autoencoder for both datasets. Since MNIST contains sim-
pler data points than FashionMNIST, we use a 10-dimensional latent space to
represent the images in MNIST, while a 20-dimensional latent space for Fash-
ionMNIST.

Table 2. Description of variational autoencoder models used in Stage (I) and classifiers
that need to be explained. The model architecture, activation function, and the number
of hidden layers are shown accordingly.

             VAE                       Classifier
MNIST        CNV (32,64, 64), ReLU, 10 Linear (20,10), ReLU
FashionMNIST CNV (32,64, 64), ReLU, 20 Linear (20,10), ReLU

5     Result
This section will first apply our proposed framework to the MNIST dataset
and illustrate how our framework works by providing multiple examples. Then,
we apply our method to the FashionMNIST dataset. The examples we presented
here demonstrate our framework’s potential for improving human understanding
of the black-box machine learning models. Note that due to the page limits we
only present a handful case studies on two datasets. We also apply our framework
on other datasets such as 3-D point cloud data. More interesting examples can
be found in our GitHub Page.

5.1   MNIST
A CNN model trained on the MNIST dataset for digit classification is selected
and yields a 94.1% accuracy on the testing dataset. A mispredicted example
is chosen for the case study. Figure 4 and Figure 5 show the selected mispre-
dicted point-of-interest and the stage (I) and stage (II) process. As shown in
Figure 4, the neighborhood of the point-of-interest is generated in grey-scale.
The examples in the neighborhood satisfied the criteria in Section 3 as they are
all semantically close to the original data point. The classified neighborhood is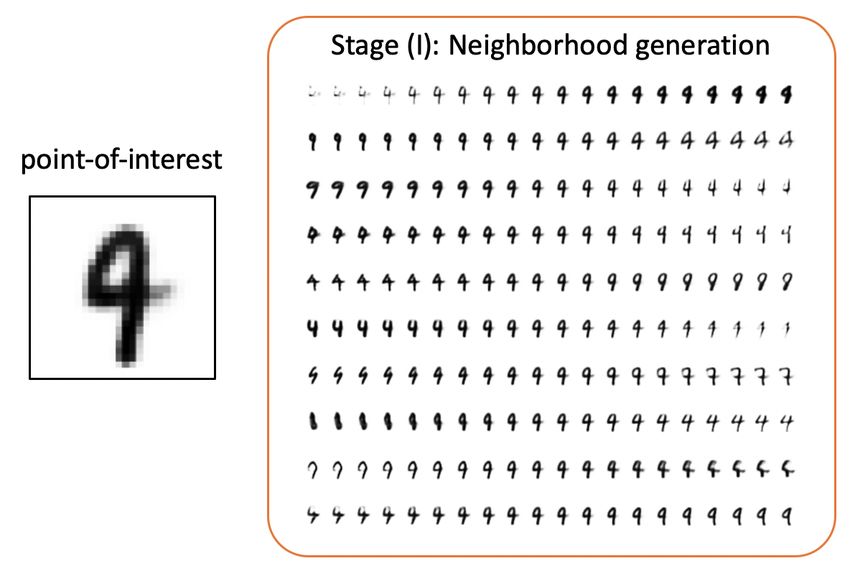
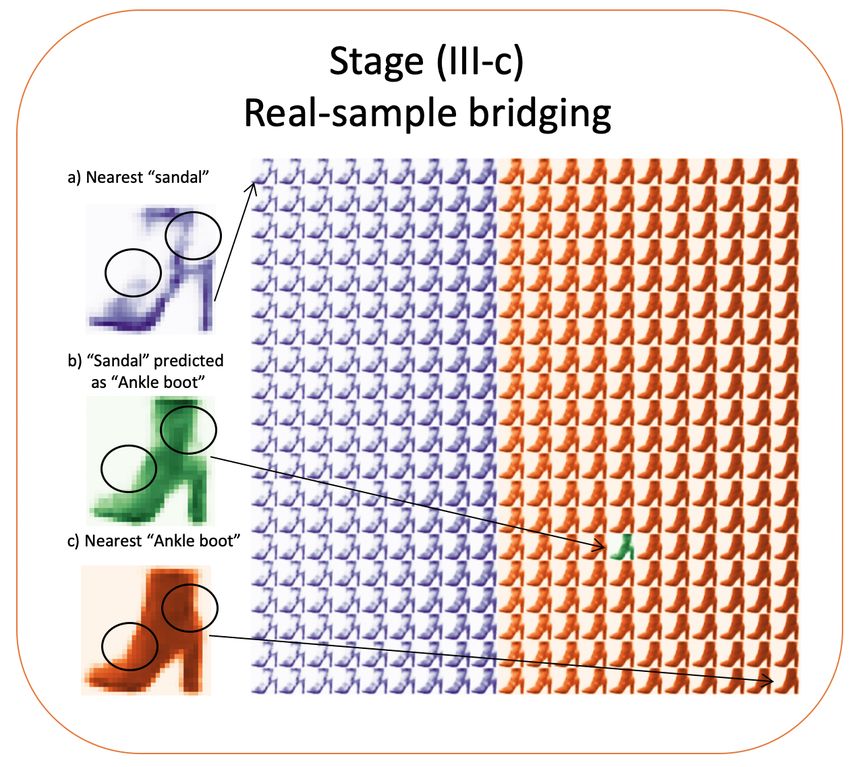
10      Zeng et al.

shown in Figure 5. The colors refer to the classification results. We observe that
despite being classified to the same label, images close to the decision boundary
have higher fidelity. This observation is consistent with our intuition that the
model is more likely mispredicting samples near the decision boundary. One can
also draw a similar conclusion by visually examining the classified neighborhood:
examples near the decision boundary often have an ambiguous shape that some-
times confuses machine learning models. Through stage (I) and stage (II), our
framework generates examples that delineate the model behavior by depicting
the local decision boundary.

Fig. 4. Stage (I) of our framework. In Stage (I), the neighborhood of the point-of-
interest is generated. The examples in the neighborhood satisfied the criteria in Section
3 as they are all semantically close to the original data point.

   After getting the classified neighborhood that carves the local decision bound-
ary around the point-of-interest, human users could be invited to explore the
neighborhood using their own intelligence. Figure 6, Figure 7, Figure 8 and
Figure 9 illustrate the three possible human-in-the-loop exploration strategies.
From Figure 6, one can observe that at stage (III-a) there exist three interest-
ing ways of morphing between digit-4 and digit-9. Therefore, human users can
gain insights by investigating the relevant features that have been changed along
the process of digit-4 morphing to digit-9. In this example, the three identified
morphing paths revealed three related features: 1) the tartness of the circle, 2)
the size of the circle and, 3) the straightness of the line. Next, human users can
combine two paths for a “zoom-in”& “zoom-out” investigation. Combining two
Title Suppressed Due to Excessive Length           11

Fig. 5. Stage (II) of our framework. In Stage (II), the generated neighborhood is clas-
sified with the given trained machine learning model. Purple color indicates the image
is classified as digit-4, orange color indicates the image is classified as digit-9 and all
other classification results are marked as color grey. We also observe that despite being
classified to the same label, images close to the decision boundary have higher fidelity.

paths allows human users to gather richer information related to the decision
boundary. As shown in Figure 8 and Figure 7, two possible combinations are
chosen and presented, and the step-length are adjusted for the “zoom-in” effect
and the “zoom-out” effect. From the denser region manifestation, one might
conclude that 1) an ”open-circle” at the top could help the given predictor cor-
rectly identify a digit-4, and 2) lines with roundness instead of tartness could
mislead the predictor to mispredict a digit-4 to digit-9. Such conclusions could
help human users better understand how the model behaves in a certain region.
    Figure 9 demonstrates the result generated by our third intervention point.
As shown in the Figure, a digit-4 is mispredicted as digit-9. By examining the
morphing from the nearest digit 4 (in purple) to the nearest digit 9 (in orange),
the circled area can be identified by human intelligence as one of the explanations
for the misprediction.
    Two other examples are shown in Figure 10 and Figure 11. The local decision
boundary of the model near the two selected instance-of-interest are displayed,
end-users can better understood the model behavior by visually examining these
samples. In these two cases, we could observe that the mispredictions are likely to
be caused by the circle areas in the image’s top-left region. Note that human users
can leverage their own intelligence to generate their own understanding with
respect to the model behavior. Our framework only provides the intervention
12 Zeng et al. Fig. 6. Stage (III-a) of the framework. In Stage (III-a), three paths are identified and the morphing is highlighted with different colors. In this example, the three identified morphing paths revealed three related features: 1) the tartness of the circle, 2) the size of the circle and, 3) the straightness of the line. points that bridge the gaps between human minds and the black-box nature of machine learning models. 5.2 FashionMNIST We provide another experiment using FashionMNIST dataset. In Figure 12, a sandal is mispredicted as an ankle boot (in green) by a pre-trained CNN. Without the context that some sandals are boot-shaped, it would be difficult to understand the cause of this error. We select this mispredicted image as an item-of-interest and apply the trained VAE to extract its latent vector. Next, we explore the latent space around the extracted latent vector and generate a manageable number of neighbor images. The trained CNN is then applied to classify the generated images. The decision boundary can be observed as the classified label is morphing from sandal (in purple) to ankle boot (in orange). By visually displaying the neighborhood and the decision boundary (the area that purple turns into orange), the end-user can observe the smooth transition between sandal and ankle boot. Human users can easily draw the conclusion that the circled areas might cause the misprediction, i.e., if a boot-shaped image with blank space at the circled areas, it is likely the image will be classified as ankle boot. 6 Workflow of human users of the proposed framework This study aims to improve explainability of machine learning models in a human-centric fashion. In this section, we present how a human user or a soft- ware engineer can leverage our framework to understand why a given ML model misclassifies a data point. There are three human intervention points.
Title Suppressed Due to Excessive Length        13

Fig. 7. Stage (III-b) of the framework. In Stage (III-b), the combination of two paths
is presented to achieve a “zoom-in” effect for better carving out the model behavior.
From this denser region manifestation, one might conclude that 1) an ”open-circle” at
the top could help the given predicter correctly identify a digit-4, and 2) lines with
roundness instead of tartness could mislead the predictor to mispredict a digit-4 to
digit-9.

6.1   Identifying the point-of-interest
First, the human user identifies a mispredicted point-of-interest, which software
engineers routinely encounter as they debug software systems with ML compo-
nents.

6.2   Identifying interesting dimensions and appropriate step lengths
Second, the key question from a user’s perspective is: how and why a particular
region of the point of interest is relevant to the prediction. That is where hu-
man users can again contribute by identifying the most interesting dimensions of
semantic changes. Our framework leverages a powerful generative model, varia-
tional autoencoders, to generate a neighborhood of closely related data points.
The generated neighborhood displays a progressive set of plausible variations of
the point-of-interest and visualizes the semantic changes across all directions.
The human user can use his common sense judgement to identify more interest-
ing dimensions and more appropriate step lengths of changes on these dimensions
so that changes in neighboring data-points are perceivable but not too dramatic.

6.3   Selecting two most revealing dimensions to generate a matrix
      for decision boundary visualization
Third, human users then select two most revealing dimensions so that a matrix of
data-points can be generated to visualize the efforts of gradual changes on both
14 Zeng et al.
Fig. 8. Stage (III-b) of the framework. In Stage (III-b), the combination of two paths
is presented to achieve a “zoom-out” effect for better carving out the model behavior.
dimensions. This matrix represents the neighborhood of interest. All generated
data-points in the neighborhood are passed through the actual model-under-
investigation so that the decision boundary is identified and visualized verbatim.
Human users can gain knowledge and insights by walking through the classified
instances and examining the decision boundary.
These three intervention points provide helpful exploration tools to help hu-
man users see, select, and manipulate the neighborhood of the data-point-of-
interest and the decision boundary within it and therefore better understand
the behavior of the underlying model.
7 Discussion, Limitations and Future Works
This paper proposes a human-in-the-loop framework to improve human under-
standing of the black-box machine learning models locally through verbatim
neighborhood manifestation.
However, the proposed method is limited in several ways. First, the neigh-
borhood is generated based on the reconstructed data point. We lack a quan-
titative measure of the fidelity of the generated neighborhood to the original
samples. Though the generated samples are derived from the VAE that was di-
rectly trained on the original dataset, some details are lost. Second, we adopt a
standard VAE to encode the data point into latent space. Moving in such a latent
space typically affects several factors of variation at once, and different direc-
tions interfere with each other [8]. This entanglement effect poses challenges for
interpreting these directions’ semantic meaning and, therefore, hinders human
users from understanding the machine learning models.Title Suppressed Due to Excessive Length 15
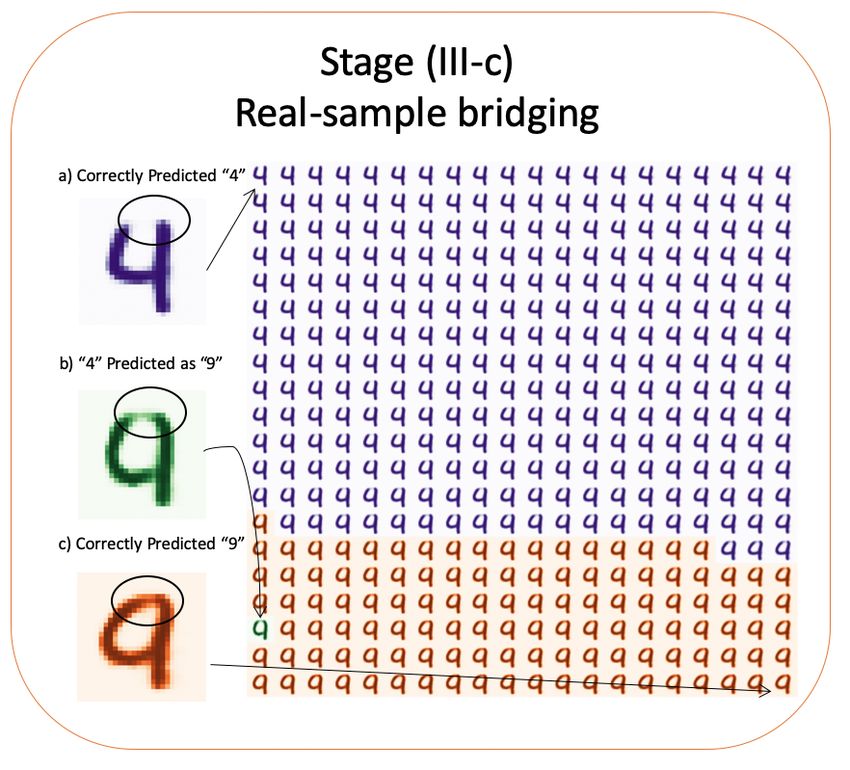
Fig. 9. Stage (III-c) of the framework. In this stage, two nearest data samples from
the original dataset are selected to bridge the gaps between the point-of-interest and
real samples on two sides of the decision boundary.
Each of the limitations mentioned above points to a potential direction for
future work. We want to quantify the fidelity of the generated data through met-
rics such as mean-absolute-error or binary-cross-entropy. For the second limita-
tion, we are considering leveraging disentangle-VAE to generate neighborhoods
along with semantic meaningful directions. We are also interested in learning a
set of latent space directions inducing orthogonal transformations that are easy
to distinguish from each other and offer robust semantic manipulations in the
neighborhood manifestation. These future works introduce exciting challenges
for bridging the gaps between the black-box nature of machine learning models
and human understanding.
8 Conclusion
Machine learning models are mainly being developed and fine-tuned for optimal
accuracy, while understanding these models has not attracted much attention.16 Zeng et al. Fig. 10. Stage (III-c) of the framework. In this stage, two nearest data samples from the original dataset are selected to bridge the gaps between the point-of-interest and real samples on two sides of the decision boundary. Existing XAI models focus on providing approximate hit-or-miss explanations, which do not involve humans in explaining and neglect human intelligence. We propose a human-in-the-loop explanation framework that reframes the explana- tion problem as a human-interactive problem to tackle this limitation. Our ap- proach utilizes a generative model to enrich the (mispredicted) point-of-interest neighborhood and crave out the local decision boundary by highlighting the model prediction results. We provide three human-involved exploration inter- vention points that assist human users to leverage their own understanding of the model behavior. We conducted case studies on two datasets, and the experi- mental results demonstrate the potential of our framework for building a bridge between machine and human intelligence.
Title Suppressed Due to Excessive Length         17

Fig. 11. Stage (III-c) of the framework. In this stage, two nearest data samples from
the original dataset are selected to bridge the gaps between the point-of-interest and
real samples on two sides of the decision boundary.

References

 1. Ancona, M., Ceolini, E., Öztireli, C., Gross, M.: Towards better understanding
    of gradient-based attribution methods for deep neural networks. arXiv preprint
    arXiv:1711.06104 (2017)
 2. Ancona, M., Öztireli, C., Gross, M.: Explaining deep neural networks with a
    polynomial time algorithm for shapley values approximation. arXiv preprint
    arXiv:1903.10992 (2019)
 3. Bach, S., Binder, A., Montavon, G., Klauschen, F., Müller, K.R., Samek, W.: On
    pixel-wise explanations for non-linear classifier decisions by layer-wise relevance
    propagation. PloS one 10(7), e0130140 (2015)
 4. Chattopadhay, A., Sarkar, A., Howlader, P., Balasubramanian, V.N.: Grad-
    cam++: Generalized gradient-based visual explanations for deep convolutional
    networks. In: 2018 IEEE Winter Conference on Applications of Computer Vision
    (WACV). pp. 839–847. IEEE (2018)
18 Zeng et al.
Fig. 12. A sandal is mispredicted as Ankle boot in FashionMNIST dataset. Without
the context that some sandal have boot-shaped, it would be difficult to understand the
cause of this error. The neighborhood manifestation provided by our framework enable
human users to explore the context environment thus gain understanding of this type
of mistakes.
5. Kabra, M., Robie, A., Branson, K.: Understanding classifier errors by examining
influential neighbors. In: Proceedings of the IEEE conference on computer vision
and pattern recognition. pp. 3917–3925 (2015)
6. Karimi, H., Derr, T., Tang, J.: Characterizing the decision boundary of deep neural
networks. arXiv preprint arXiv:1912.11460 (2019)
7. Karimi, H., Tang, J.: Decision boundary of deep neural networks: Challenges and
opportunities. In: Proceedings of the 13th International Conference on Web Search
and Data Mining. pp. 919–920 (2020)
8. Mathieu, E., Rainforth, T., Siddharth, N., Teh, Y.W.: Disentangling disentangle-
ment in variational autoencoders. In: International Conference on Machine Learn-
ing. pp. 4402–4412. PMLR (2019)
9. Ribeiro, M.T., Singh, S., Guestrin, C.: ”why should I trust you?”: Explaining the
predictions of any classifier. In: Proceedings of the 22nd ACM SIGKDD Interna-
tional Conference on Knowledge Discovery and Data Mining, San Francisco, CA,
USA, August 13-17, 2016. pp. 1135–1144 (2016)Title Suppressed Due to Excessive Length 19
10. Rudin, C.: Stop explaining black box machine learning models for high stakes
decisions and use interpretable models instead. Nature Machine Intelligence 1(5),
206–215 (2019)
11. Selvaraju, R.R., Cogswell, M., Das, A., Vedantam, R., Parikh, D., Batra, D.: Grad-
cam: Visual explanations from deep networks via gradient-based localization. In:
Proceedings of the IEEE international conference on computer vision. pp. 618–626
(2017)
12. Shrikumar, A., Greenside, P., Kundaje, A.: Learning important features through
propagating activation differences. arXiv preprint arXiv:1704.02685 (2017)
13. Shrikumar, A., Greenside, P., Shcherbina, A., Kundaje, A.: Not just a black box:
Learning important features through propagating activation differences. arXiv
preprint arXiv:1605.01713 (2016)
14. Simonyan, K., Vedaldi, A., Zisserman, A.: Deep inside convolutional networks:
Visualising image classification models and saliency maps. CoRR abs/1312.6034
(2014)
15. Sundararajan, M., Taly, A., Yan, Q.: Axiomatic attribution for deep networks.
arXiv preprint arXiv:1703.01365 (2017)
16. Wang, H., Wang, Z., Du, M., Yang, F., Zhang, Z., Ding, S., Mardziel, P., Hu, X.:
Score-cam: Score-weighted visual explanations for convolutional neural networks.
In: Proceedings of the IEEE/CVF Conference on Computer Vision and Pattern
Recognition Workshops. pp. 24–25 (2020)
17. Wang, J., Gou, L., Zhang, W., Yang, H., Shen, H.W.: Deepvid: Deep visual in-
terpretation and diagnosis for image classifiers via knowledge distillation. IEEE
transactions on visualization and computer graphics 25(6), 2168–2180 (2019)
18. Zeiler, M.D., Fergus, R.: Visualizing and understanding convolutional networks.
In: European conference on computer vision. pp. 818–833. Springer (2014)You can also read