Housing statistics 1 April 2021 - 31 March 2022 - Published 23 June 2022 Making homes happen - GOV.UK
←
→
Page content transcription
If your browser does not render page correctly, please read the page content below
Making homes happen

Housing statistics
1 April 2021 – 31 March 2022
Published 23 June 2022

                         OFFICIAL
Contents

1. Key results ............................................................................................................ 3
2. Introduction ........................................................................................................... 4
3. Housing outputs ................................................................................................... 6
4. Accompanying tables ......................................................................................... 11
5. Other information................................................................................................ 13
6. User consultation................................................................................................ 14
7. Technical Notes .................................................................................................. 14
Annexe 1 .................................................................................................................. 15
Annexe 2 .................................................................................................................. 20

Page 2

                                                            OFFICIAL
1. Key results
1.1    In the financial year 2021-22 there were 38,436 housing starts on site and 37,164 housing completions
       delivered through programmes managed by Homes England in England (excluding London for all
       programmes except those administered by Homes England on behalf of the Greater London Authority
       (GLA)). Levels of starts and completions were higher than in 2020-21 when the Covid-19 pandemic
       caused a slow-down in housebuilding activity. Homes England manages the Help to Buy (Equity Loan)
       scheme in England but the completions are reported by the Department for Levelling Up, Housing and
       Communities (DLUHC) (formerly the Ministry of Housing, Communities and Local Government
       (MHCLG)) available from the webpage linked below 1 and are, therefore, excluded from this publication.

1.2    27,509 or 72 per cent of housing starts on site in 2021-22 were for affordable homes. This represents
       a decrease of 2 per cent on the 28,176 affordable homes started in 2020-21, when they accounted for
       76 per cent of all housing starts. The number of affordable starts was the lowest since 2015-16 which
       can be attributed to the closure of bidding for the Shared Ownership and Affordable Homes Programme
       (SOAHP) 2016-21 in March 2021 and the gradual build up of starts from the newly launched Affordable
       Homes Programme (AHP) 2021-26.

1.3    5,606 affordable homes started were for Affordable Rent, a reduction of 48 per cent on the 10,713
       started in 2020-21. A further 4,778 were for Intermediate Affordable Housing schemes, including Shared
       Ownership and Rent to Buy. This is a decrease of 35 per cent on the 7,314 started in 2021-22. 1,981
       were for Social Rent, a decrease of 23 per cent on the 2,585 started in the previous year. In addition, a
       further 15,144 affordable homes started with tenure to be confirmed 2, an increase of 100 per cent on
       the 7,564 started in the previous year. Of the affordable homes started in 2021-22, the highest delivering
       programmes were: SOAHP 2016-21 with 54 per cent (down from 90 per cent); the AHP 2021-26 with
       39 per cent in its first year of delivery; and the Single Land Programme (SLP) with 3 per cent (down from
       4 per cent).

1.4    26,485 or 71 per cent of housing completions in 2021-22 were for affordable homes. This represents
       an increase of 11 per cent on the 23,949 affordable homes completed in the previous year, when they
       accounted for 69 per cent of total completions.

1.5    13,929 affordable homes completed were for Affordable Rent, an increase of 5 per cent on the 13,306
       completed in the previous year. A further 9,479 were for Intermediate Affordable Housing schemes,
       including Shared Ownership and Rent to Buy, an increase of 8 per cent on the 8,747 completed in the
       previous year. The remaining 3,077 were for Social Rent, a 62 per cent increase on 1,896 completed
       in the previous year. Of the affordable homes completed, the highest delivering programmes were: the
       SOAHP 2016-21 with 86 per cent (down from 89 per cent); the AHP 2021-26 with 3 per cent in its first
       year of delivery; and the Single Land Programme with 3 per cent (no change).

1 https://www.gov.uk/government/collections/help-to-buy-equity-loan-and-newbuy-statistics
2 Affordable Tenure TBC refers to units that have reached the start on site milestone but where the tenure of these units
has not yet been specified. This was introduced as a flexibility for Strategic Partnerships to enable them to determine
tenure close to or at the point of completion. These starts will be restated under their specified tenure headings in future
national statistics updates once the tenure has been established at completion.

Page 3

                                                         OFFICIAL
2. Introduction
Geographical coverage
2.1    This release presents the housing starts on site and housing completions delivered by Homes England
       between 1 April 2009 and 31 March 2022 in England excluding London (for both the current and
       historical series3) with the exception of the Build to Rent (BTR), Builders Finance Fund (BFF), Get Britain
       Building (GBB) and the Home Building Fund – Short Term Fund (HBF – STF) programmes which are
       administered by Homes England on behalf of the Greater London Authority (GLA) and where delivery
       covers all of England including London.

Purposes and uses
2.2    The figures in this release show the supply of affordable and market housing delivered through Homes
       England’s programmes4 with the exception of Help to Buy (Equity Loan scheme), the statistics for which
       are published quarterly by DLUHC5. Further details on housing types are available in section 5 of the
       technical notes document accompanying this release6. DLUHC also publishes annual statistics on
       affordable housing supply in England7 showing the gross annual supply of affordable homes, irrespective
       of funding mechanism. Further information on the Affordable Housing Supply and Help to Buy releases
       is provided in section 6 of the technical notes document.

2.3    The data in this release are used by DLUHC to monitor delivery of affordable homes as part of the
       DLUHC business plan (see paragraph 6.3 in the technical notes). Homes England uses the data to
       measure progress towards commitments made in its published Strategic Plan 8 and its Annual Business
       Plan. Local authorities also use the data when compiling their annual return to DLUHC for the purpose
       of calculating the enhancement for affordable housing under the New Homes Bonus (NHB), a grant for
       local authorities to incentivise new housing supply.

What is included in this release?
2.4    This is the first release of data relating to delivery for the financial year ending 31 March 2022 and covers
       all current and historical programmes delivered by Homes England (summarised in Annex 1). These
       include the acquisition of existing land or property as well as new house building, and some programmes
       provide a mix of affordable and market housing. Affordable housing may be for home ownership (on
       Shared Ownership or Rent to Buy terms) or for rent.

2.5    Housing starts on site and housing completions are reported for each programme, where applicable.

2.6    A programme breakdown of the data is available in Table 1 of the tables accompanying this release6.
       Further information on the accompanying tables is provided in section 4 of this release. Table A of the
       latest annual statistics on affordable housing supply in England published by DLUHC7 shows how
       Homes England programmes relate to the statistics on affordable housing published by DLUHC.

How is new subsidised housing provided?
2.7    Affordable homes delivered through Homes England programmes are funded by central government.
       The funding is administered by Homes England to fund investment partners (including private registered
       providers, house builders, community groups and local authorities) to deliver affordable housing.

2.8    With the exception of the Single Land Programme (SLP), funding for all programmes is allocated
       through an application/bidding process based on the assessment eligibility/criteria for each

3 As  housing starts on site and completions are recorded by their geographical location, this release may exclude homes
located outside London where the funding was allocated to a local authority district within London.
4 See Annex 1 for a summary and links to information about Homes England’s programmes.
5 https://www.gov.uk/government/collections/help-to-buy-equity-loan-and-newbuy-statistics
6 https://www.gov.uk/government/collections/housing-statistics
7 https://www.gov.uk/government/collections/affordable-housing-supply
8 https://www.gov.uk/government/publications/homes-england-strategic-plan-201819-to-202223

Page 4

                                                       OFFICIAL
programme. Funding is paid in accordance with the contractual agreement for each programme.
Investment for projects delivered under the SLP is determined in accordance with Homes England’s
Framework Document9 and relevant commissioning template.
London
2.9 Since April 2012, the Mayor of London has had oversight of strategic housing, regeneration and
economic development in London. This means that Homes England no longer publishes housing starts
on site and completions for London, except where Homes England is administering a programme on
behalf of the GLA. The historical series for London, which reflects past delivery by Homes England, is
included in Homes England’s housing statistics published on 12 June 2012 (revised 24 August 2012)
available from the housing statistics page on the Homes England section of GOV.UK 10.
2.10 DLUHC has combined the affordable housing statistics in this release with the GLA’s affordable housing
statistics to produce Table 1012 showing total affordable housing starts on site and completions
delivered nationally under the affordable housing programmes of Homes England and the GLA11. From
2019/20 onwards, table 1012 includes units delivered by the GLA funded via the Right to Buy ringfence
offer which are not included in their quarterly management information. Therefore there will be some
discrepancies between the total in this table and the GLA's own tables. This table excludes additional
affordable housing delivery reported annually through local authority returns, which are included in
DLUHC’s full annual release on affordable housing supply in England 12. The table includes any
revisions made to London data since it was published by Homes England on 12 June 2012 (revised 24
August 2012). Further details are provided in section 6 of the technical notes.
9 https://www.gov.uk/government/publications/homes-england-framework-document
10 https://www.gov.uk/government/collections/housing-statistics
11 https://www.gov.uk/government/statistical-data-sets/live-tables-on-affordable-housing-supply
12 https://www.gov.uk/government/collections/affordable-housing-supply
Page 5
OFFICIAL3. Housing outputs
This section provides the detailed statistics for housing starts and completions by tenure. It
includes all Homes England programmes and analyses them over time 13.
Data for the current and previous year should be considered as provisional since they are subject to
revisions as set out in section 4 of the technical notes accompanying this release.
Starts on site
Table 1a:
Housing starts on site by tenure, England (excluding non-Homes England London delivery) 1, 2
Intermediate Affordable
Total
Housing Affordable Total
Financial Affordable Social Affordable
Period Affordable Tenure Market 6 Housing
Year 3 Rent Rent Intermediate Housing
Home TBC 4 Starts
Rent Starts 5
Ownership
2021-22 Apr - Sep 1,680 869 71 1,400 7,790 11,810 4,305 16,115
2021-22 Oct - Mar 3,926 1,112 195 3,112 7,354 15,699 6,622 22,321
2021-22 Full Year 5,606 1,981 266 4,512 15,144 27,509 10,927 38,436
2020-21 Apr - Sep 3,322 483 262 2,520 3,380 9,967 2,689 12,656
2020-21 Oct - Mar 7,391 2,102 295 4,237 4,184 18,209 6,456 24,665
2020-21 Full Year 10,713 2,585 557 6,757 7,564 28,176 9,145 37,321
2019-20 Apr - Sep 5,337 710 57 4,150 2,895 13,149 4,777 17,926
2019-20 Oct - Mar 11,675 1,662 95 7,451 1,843 22,726 7,081 29,807
2019-20 Full Year 17,012 2,372 152 11,601 4,738 35,875 11,858 47,733
2018-19 Apr - Sep 5,698 508 156 3,543 .. 9,905 6,230 16,135
2018-19 Oct - Mar 12,074 749 158 7,760 .. 20,741 9,102 29,843
2018-19 Full Year 17,772 1,257 314 11,303 .. 30,646 15,332 45,978
2017-18 Apr - Sep 4,526 304 8 2,130 .. 6,968 6,501 13,469
2017-18 Oct - Mar 12,627 1,314 108 7,017 .. 21,066 7,616 28,682
2017-18 Full Year 17,153 1,618 116 9,147 .. 28,034 14,117 42,151
2016-17 Apr - Sep 7,218 308 42 1,838 .. 9,406 5,318 14,724
2016-17 Oct - Mar 14,895 629 8 4,201 .. 19,733 6,693 26,426
2016-17 Full Year 22,113 937 50 6,039 .. 29,139 12,011 41,150
2015-16 Apr - Sep 5,858 199 0 1,317 .. 7,374 3,952 11,326
2015-16 Oct - Mar 10,686 431 5 2,822 .. 13,944 7,838 21,782
2015-16 Full Year 16,544 630 5 4,139 .. 21,318 11,790 33,108
2014-15 Apr - Sep 7,487 698 0 1,242 .. 9,427 3,226 12,653
2014-15 Oct - Mar 14,392 547 21 2,071 .. 17,031 5,676 22,707
2014-15 Full Year 21,879 1,245 21 3,313 .. 26,458 8,902 35,360
1 Since April 2012, the Mayor of London has had oversight of strategic housing, regeneration and economic development in
London. This means that Homes England no longer publishes housing starts on site and completions for London (current and
historical series) except for delivery in London under the Build to Rent, Builders Finance Fund, Get Britain Building and The
Home Building Fund – Short Term Fund (HBF – STF) programmes which are administered by Homes England on behalf of the
GLA. The historical series for London included in Homes England’s housing statistics published on 12 June 2012 (revised 24
August 2012) is available from: https://www.gov.uk/government/collections/housing-statistics
2 Figures by local authority and region are available in the accompanying tables.
3 To ensure consistent reporting with completions, with effect from 1 April 2014 the range of products reported for affordable
housing starts on site includes the start on site for new build homes where the procurement route is such that the provider
purchases the home at completion. For reporting purposes, the start on site date is taken as the date of completion.
4 Tenure will be determined on completion of the unit and will be restated in future releases under its appropriate tenure.
5 Total affordable housing is the sum of Affordable Rent, Social Rent, Intermediate Rent, Affordable Home Ownership and (for
starts only) Affordable Tenure TBC.
6 The market units delivered under the Accelerated Land Disposal, Build to Rent, Builders Finance Fund, Economic Assets, Get
Britain Building, Kickstart Housing Delivery, Levelling Up – Home Building Fund, Local Authority Accelerated Construction,
Property and Regeneration, Single Land and the HBF – STF programmes may include some starts on site and completions
which are made available at below market price or rents but do not meet the definition for affordable housing.
“..” not applicable
13The tables and charts in this and future releases have been restricted to an eight-year rolling profile to avoid
overcrowding pages with excessively long graphics. For earlier years (going back to 2009-10) please see the
accompanying tables and previous releases available at https://www.gov.uk/government/collections/housing-statistics.
Page 6
OFFICIALChart 1a: Housing starts on site
40,000
35,000
30,000
Housing Units
25,000
20,000
Affordable
15,000 Market
10,000
5,000
0
2014-15 2015-16 2016-17 2017-18 2018-19 2019-20 2020-21 2021-22
Year
Chart 1b: Affordable Housing starts on site
25,000
20,000 Affordable Rent
Housing Units
15,000 Social Rent
Intermediate Affordable
10,000
Housing
Affordable Tenure TBC
5,000
0
2014-15 2015-16 2016-17 2017-18 2018-19 2019-20 2020-21 2021-22
Year
In the period 1 April 2021 to 31 March 2022
(financial year 2021-22, with comparisons to 2020-21):
3.1 A total of 38,436 homes started on site, representing an increase of 1,115 or 3 per cent compared to
37,321. Excluding last year, levels of starts were the lowest since 2015-16 and this can be attributed to
the closure of the SOAHP 2016-21 to new bids at the end of March 2021 as well as the effects of the
Covid-19 pandemic on the housebuilding industry. Additionally, whilst the AHP 2021-26 was open, the
first year of a new programme typically sees fewer starts.
3.2 27,509 or 72 per cent of housing starts on site were for affordable homes – a decrease of 667 or 2 per
cent compared to 28,176. Whilst some of this can be attributed to the Covid-19 pandemic affecting
housebuilding activity, 2021-22 is the first year of the AHP 2021-26 and historical trends show that
delivery of starts tends to be low at the beginning of a new programme.
3.3 5,606 (20 per cent) of affordable homes started were for Affordable Rent, a reduction of 5,107 or 48 per
cent on 10,713. A further 4,778 (17 per cent) were for Intermediate Affordable Housing schemes,
including Shared Ownership and Rent to Buy. This is a decrease of 2,536 or 35 per cent on 7,314.
1,981 (7 per cent) were for Social Rent, a decrease of 604 or 23 per cent on 2,585. In addition, a further
15,144 (55 per cent) of affordable homes started with tenure to be confirmed, an increase of 7,580 or
100 per cent on 7,564 (mainly due to delivery from Strategic Partners increasing in scale and delivery
from non-Strategic Partners tailing off due to the SOAHP 2016-21 closed for new business). All ‘tenure
to be confirmed starts’ originate from Strategic Partnerships where providers are not contractually
required to identify the tenure of a unit until completion. The increase in this type of starts from 2019-
20 corresponds directly to the overall increase in Strategic Partnership starts as the programme reached
maturity in 2020-21. The tenure for these units will not be known until completion and they will be
restated under their appropriate tenure in future releases.
Page 7
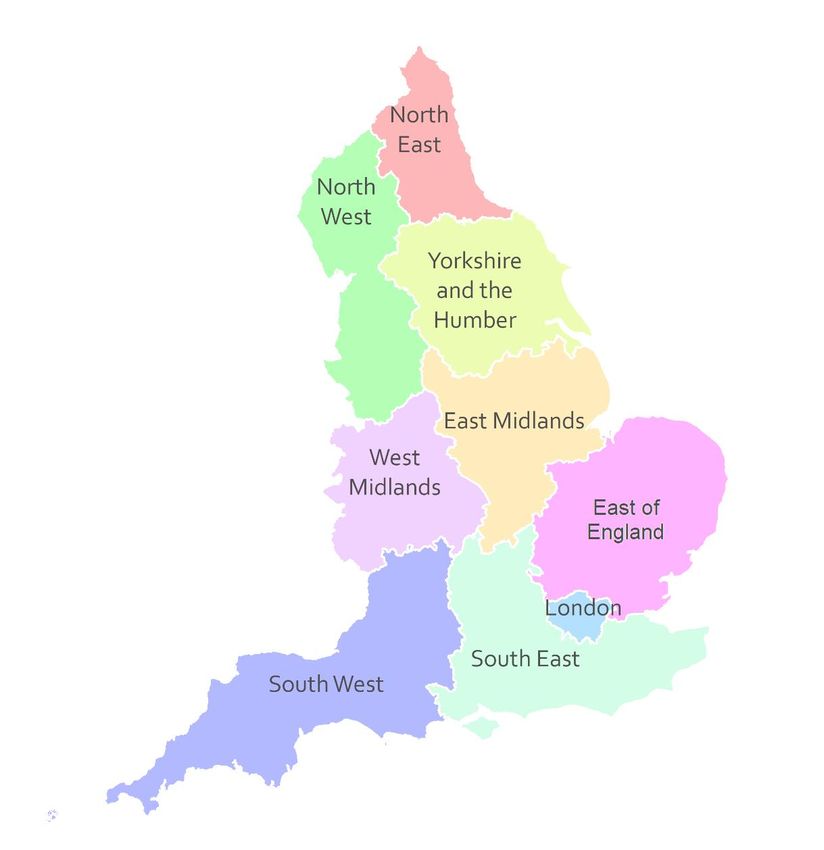
OFFICIAL3.4 Table 1b below shows the percentage of Homes England’s affordable housing starts on site delivered
by each region14 compared to last year15, ranked highest to lowest. A map showing the region
boundaries is available at Annex 2.
Table 1b: Affordable Housing Starts on Site - Percentage Delivery by Region
2021-22 2020-21
North West 24% 24%
South East 15% 18%
West Midlands 14% 11%
East Midlands 12% 10%
South West 11% 10%
East of England 10% 13%
Yorkshire and The Humber 9% 9%
North East 5% 6%
London 0% 1%
3.5 The number of market starts on site increased by 1,782 (19 per cent) to 10,927 compared to 9,145.
The SLP produced nearly half of these at 4,999 or 46 per cent, the HBF – STF delivered 4,816 or 44
per cent, the Levelling Up – Home Building Fund (LU-HBF) delivered 635 or 6 per cent and the
remaining 477 or 4 per cent were delivered by Local Authority Accelerated Construction (LAAC). The
rise in market starts compared to the same period last year can be attributed to a less severe impact
from the Covid-19 pandemic which necessitated the closure of most building sites at the beginning of
the 2020-21 financial year.
14 https://www.ons.gov.uk/methodology/geography/ukgeographies/administrativegeography/england#regions-former-gors
15 Note that proportions do not sum to 100 per cent due to rounding.
Page 8
OFFICIALCompletions (excluding Help to Buy):
Table 2a:
Housing completions by tenure, England (excluding Help to Buy and non-Homes England London
delivery) 1, 2
Intermediate Affordable
Housing Total
Total
Financial Affordable Social Affordable
Period Market 6, 7 Housing
Year Rent Rent Affordable Housing
Intermediate Completions
Home Completions 5
Rent
Ownership
2021-22 Apr - Sep 5,346 1,174 65 3,511 10,096 4,297 14,393
2021-22 Oct - Mar 8,583 1,903 139 5,764 16,389 6,382 22,771
2021-22 Full Year 13,929 3,077 204 9,275 26,485 10,679 37,164
2020-21 Apr - Sep 4,315 700 21 3,043 8,079 3,904 11,983
2020-21 Oct - Mar 8,991 1,196 57 5,626 15,870 7,084 22,954
2020-21 Full Year 13,306 1,896 78 8,669 23,949 10,988 34,937
2019-20 Apr - Sep 6,405 556 20 3,362 10,343 4,713 15,056
2019-20 Oct - Mar 10,458 918 97 6,397 17,870 7,577 25,447
2019-20 Full Year 16,863 1,474 117 9,759 28,213 12,290 40,503
2018-19 Apr - Sep 7,912 326 3 2,824 11,065 4,752 15,817
2018-19 Oct - Mar 10,977 668 42 5,964 17,651 6,618 24,269
2018-19 Full Year 18,889 994 45 8,788 28,716 11,370 40,086
2017-18 Apr - Sep 7,219 174 0 1,900 9,293 2,723 12,016
2017-18 Oct - Mar 12,544 859 34 3,132 16,569 5,321 21,890
2017-18 Full Year 19,763 1,033 34 5,032 25,862 8,044 33,906
2016-17 Apr - Sep 7,096 218 1 1,338 8,653 2,957 11,610
2016-17 Oct - Mar 11,184 373 4 2,671 14,232 5,252 19,484
2016-17 Full Year 18,280 591 5 4,009 22,885 8,209 31,094
2015-16 Apr - Sep 4,681 684 0 1,032 6,397 3,082 9,479
2015-16 Oct - Mar 8,419 813 2 1,759 10,993 4,919 15,912
2015-16 Full Year 13,100 1,497 2 2,791 17,390 8,001 25,391
2014-15 Apr - Sep 7,447 865 0 2,141 10,453 3,682 14,135
2014-15 Oct - Mar 23,387 2,124 18 4,882 30,411 6,218 36,629
2014-15 Full Year 30,834 2,989 18 7,023 40,864 9,900 50,764
1, 2, 5, 6 See
footnotes below Table 1a on page 6
7Some of the market completions delivered since 2013-14 may include houses sold to purchasers who have received
assistance through the Help to Buy scheme to buy a property at market value from a house builder where the scheme as
a whole may have benefitted from funding through another programme. Help to Buy is reported by DLUHC (see
https://www.gov.uk/government/collections/help-to-buy-equity-loan-and-newbuy-statistics)
Page 9
OFFICIALChart 2a: Housing completions (excluding Help to Buy)
45,000
40,000
35,000
30,000
Housing Units
25,000
20,000 Affordable
15,000 Market
10,000
5,000
0
2014-15 2015-16 2016-17 2017-18 2018-19 2019-20 2020-21 2021-22
Year
Chart 2b: Affordable Housing completions
35,000
30,000
25,000
Housing Units
20,000
Affordable Rent
15,000
Social Rent
10,000 Intermediate Affordable
Housing
5,000
0
2014-15 2015-16 2016-17 2017-18 2018-19 2019-20 2020-21 2021-22
Year
In the period 1 April 2021 to 31 March 2022
(financial year 2021-22, with comparisons to 2020-21):
3.6 37,164 homes were completed, an increase of 2,227 or 6 per cent compared to 34,937. Excluding
2020-21, levels of completions were the lowest since 2017-18 and, as with housing starts, this can be
attributed to the effects of the Covid-19 pandemic on the housebuilding industry.
3.7 26,485 (71 per cent) affordable homes were completed, an increase of 2,536 or 11 per cent compared
to 23,949.
3.8 13,929 (53 per cent) of affordable completions were for Affordable Rent, an increase of 623 or 5 per
cent compared to 13,306. Intermediate Affordable Housing accounted for a further 9,479 (36 per cent),
an increase of 732 or 8 per cent compared to 8,747. The remaining 3,077 (12 per cent) of affordable
homes completed were for Social Rent, an increase of 1,181 or 62 per cent compared to 1,896. The
increase in Social Rent completions follows the upward trend seen over recent years and is a reflection
of the funding being focussed on intermediate tenures in the early years of the 2016-21 programme with
the grant funding opening up to Affordable Rent and Social Rent in subsequent years.
Page 10
OFFICIAL3.9 Table 2b below shows the percentage of Homes England’s affordable housing completions delivered
by each region compared to last year16, ranked highest to lowest.
Table 2b: Affordable Housing Completions - Percentage Delivery by Region
2021-22 2020-21
South East 22% 22%
North West 18% 17%
East of England 13% 16%
West Midlands 13% 12%
South West 10% 10%
East Midlands 10% 8%
North East 7% 6%
Yorkshire and The Humber 7% 8%
3.10 10,679 market homes completed, a decrease of 309 or 3 per cent compared to 10,988. Fluctuations in
the number of market completions between periods reflects the nature of the programmes, with different
types and sizes of sites commencing at different times and having varying build-out rates. Market
completions were delivered by the SLP with 4,914 or 46 per cent, HBF - STF with 4,814 or 45 per cent,
BTR with 524 or 5 per cent, LAAC with 391 or 4 per cent and GBB with 36 (less than half a per cent).
First Homes
3.11 32 First Homes (FH) completions were delivered in the second six months of 2021-22 but are excluded
from the accompanying tables as they have been reported as Market units. These FH units are part of
a small phase 1 pilot being delivered by the SLP, the starts on site for which are also reported as market
units. A phase 2 grant funded pilot is delivering 1,500 FH units via the First Homes Early Delivery
Programme 2021-23. Both pilots are in advance of the delivery of First Homes via Planning Policy.
These FH completions are included in Table 1012 published by DLUHC 17, therefore the total affordable
housing in table 1012 will differ from this release.
4. Accompanying tables
4.1 The tables accompanying this release are available to download from the housing statistics page on the
Homes England section of GOV.UK18 and include the following:
Table 1
Housing starts on site and completions by programme and tenure for:
1 April 2021 – 31 March 2022 with half year analysis
1 April 2020 – 31 March 2021 with half year analysis
1 April 2019 – 31 March 2020 with half year analysis
1 April 2018 – 31 March 2019 with half year analysis
1 April 2017 – 31 March 2018 with half year analysis
1 April 2016 – 31 March 2017 with half year analysis
1 April 2015 – 31 March 2016 with half year analysis
1 April 2014 – 31 March 2015 with half year analysis
1 April 2013 – 31 March 2014 with half year analysis
1 April 2012 – 31 March 2013 with half year analysis
1 April 2011 – 31 March 2012 with half year analysis
1 April 2010 – 31 March 2011 with half year analysis
1 April 2009 – 31 March 2010 with half year analysis
16 Note that proportions do not sum to 100 per cent due to rounding.
17 https://www.gov.uk/government/statistical-data-sets/live-tables-on-affordable-housing-supply
18 https://www.gov.uk/government/collections/housing-statistics
Page 11
OFFICIALTable 2a
Housing starts on site and completions by local authority district and tenure (all programmes except
Help to Buy), 1 April 2021 – 31 March 2022.
Table 2b
Housing starts on site and completions by local authority district and tenure (all programmes except
Help to Buy), 1 April 2020 – 31 March 2021.
Table 2c
Housing starts on site and completions by local authority district and tenure (all programmes except
Help to Buy), 1 April 2019 – 31 March 2020.
4.2 Housing starts on site and completions by local authority district and tenure (all programmes except
Help to Buy) for historical periods are available to download from the Homes England housing statistics
web page19.
4.3 In a small number of cases, Homes England funding to an affordable housing provider may be to support
a person or family to be housed in a local authority that is different to the one in which they currently
reside. The local authority presentations in Table 2a, 2b and 2c are based on the local authority district
in which the house is located. These tables also identify the region in which each local authority is
located.
4.4 We can provide programme level statistics for specified local authority areas in response to requests
made to housing.statistics@homesengland.gov.uk.
19 https://www.gov.uk/government/collections/housing-statistics
Page 12
OFFICIAL5. Other information
Pre-release access
5.1 Details of officials who receive pre-release access to the release up to 24 hours before publication are
available from the housing statistics page on the Homes England section of GOV.UK 20.
A brief history of Homes England
5.2 Homes England was launched by the Secretary of State on 11 January 2018. Homes England is the
trading name of Homes and Communities Agency (HCA) (the legal entity). The HCA was created on 1
December 2008 by bringing together the regeneration body English Partnerships (including the Property
and Regeneration programme), the investment arm of the Housing Corporation (including the National
Affordable Housing Programme), the Academy for Sustainable Communities and a number of housing
and regeneration programmes from DLUHC (then known as the Department for Communities and Local
Government (DCLG). In October 2011, the HCA took responsibility for the land and property assets of
eight of England’s nine Regional Development Agencies, ahead of their operational closure in March
2012. On 1 April 2012, the HCA’s former London operating area transferred to the GLA.
Future publication dates
5.3 Our official statistics for the period 1 April 2022 to 30 September 2022 will be published in
November/December 2022.
Responsible statistician
5.4 The responsible statistician for this statistical release is Mike Shone.
20 https://www.gov.uk/government/collections/housing-statistics
Page 13
OFFICIAL6. User consultation
6.1 Users’ comments on any issues relating to this statistical release are welcomed and encouraged.
Responses should be sent to the “Statistical Enquiries” address given below:
Enquiries
Media Enquiries Email: media@homesengland.gov.uk
Tel: 020 7874 8262
Statistical Enquiries Mike Shone (c/o)
Email: housing.statistics@homesengland.gov.uk
Tel: 01234 242537
7. Technical Notes
Please see the accompanying technical notes document for further information. This can be found on the
Homes England housing statistics page for 1 April 2021 to 31 March 2022:
https://www.gov.uk/government/collections/housing-statistics
Page 14
OFFICIALAnnexe 1
Homes England’s programmes
The following table and links provide information about Homes England’s programmes which are funded by
the Ministry of Housing, Communities and Local Government except for Care and Support Specialised
Housing, Homelessness Change 2015-18 and Platform for Life which are funded by the Department of Health:
Programme Programme Summary Tenure 1 Build
Type 2
The Accelerated Land Disposal programme was Social Rent NB
announced in the Budget 2011 to support the additional / AHO /
Accelerated Land or accelerated delivery of 3,000 housing starts on site Market
Disposal by 31 March 2015. With effect from 1 April 2015,
existing commitments transferred to the Single Land
Programme.
On 6 September 2012, the Government announced its Aff. Rent / NB/A
proposal to guarantee up to £10bn of debt to help Social Rent
housing providers expand the provision of both purpose / AHO
built private rented and affordable housing. As well as
the Guarantee for the Affordable Homes element, the
Affordable Homes
Government confirmed that it would make £225m of
Guarantees
funding available for new affordable housing, for use
where needed alongside the Affordable Homes
Guarantee. This funding was then doubled in the 2013
Budget to £450m, including London, to support up to
30,000 new affordable homes.
The Affordable Homes Programme was announced as Aff. Rent / NB/A
part of the Government’s Spending Review 2010 and Social Rent
Affordable Homes
delivered over 58,000 (excluding London) new / AHO
Programme 3
affordable homes by 31 March 2015, with rents set at up
to 80 per cent of market rent.
The Affordable Homes Programme 2015-18 replaced Aff. Rent / NB/A
the Affordable Homes Programme 2011-15 and aims to Social Rent
Affordable Homes
increase the supply of new affordable homes in England / AHO
Programme 2015 -
by March 2018. It is now closed although commitments (Shared
18
agreed under this programme will be delivered during Ownership)
the 2016-21 period.
The Affordable Homes Programme 2021-26 is replacing Aff. Rent / NB/A
the Shared Ownership and Affordable Homes Social Rent
Affordable Homes
Programme 2016-21 with the aim to increase the supply / AHO
Programme 2021-26
of new affordable homes in England by March 2026. (Shared
Ownership)
The Build to Rent Fund was launched in December Market NB
2012 in response to the recommendations of the
Montague report to stimulate new private rented
Build to Rent
housing supply and to provide opportunities for new
institutional investment in the sector. It will support the
delivery of up to 10,000 new homes.
The £525 million Builders Finance Fund is designed to Social Rent NB/A
help restart and speed up housing developments / Int. Rent /
between 5 and 250 units that have slowed down or AHO /
stalled. Its main objective is to address difficulties in Market
Builders Finance
accessing development finance faced by some house
Fund
builders, particularly smaller developers, and to help
bring forward stalled but viable sites. With effect from
October 2016, existing commitments transferred to the
Home Building fund – Short Term Fund.
Page 15
OFFICIALProgramme Programme Summary Tenure 1 Build
Type 2
The Department of Health’s Care and Support Aff. Rent / NB/A
Specialised Housing Fund (CASSH) provides funding Social Rent
for housing for older people and adults with disabilities / AHO
(physical or sensory disabilities, mental health needs (Shared
Care and Support and learning disabilities & autism). Ownership)
Specialised Housing The fund is spilt into two phases. Phase 1 was launched
Fund in October 2012 and phase 2 was launched in February
2015. The initial budget for the programme was £160m
over five years (2013-14 to 2017-18) outside London. In
2013, this was increased by a further £80m and the
delivery time frame extended to 2020-21.
The Economic Assets programme was announced in Social Rent NB/A
the Budget 2011 and worked with partners to ensure the / Int. Rent /
effective use and disposal of more than 300 land and AHO /
Economic Assets property assets transferred from the former Regional Market
Development Agencies. With effect from 1 April 2015,
existing commitments transferred to the Single Land
Programme.
The Empty Homes programme was announced as part Aff. Rent / A
of the Government’s Spending Review 2010 to bring Social Rent
back into use empty residential properties (in private / AHO
Empty Homes 3
ownership) as affordable housing. The programme
delivered 2,759 homes by 30 September 2016 outside
London.
In November 2012 a second round of funding was Aff. Rent / A
launched to bring back into use empty properties as Social Rent
affordable housing. As well as residential properties (in / AHO
Empty Homes
private ownership), the programme had an emphasis on
Round Two
the refurbishment of empty commercial and non-
residential properties. The programme delivered 868
homes by 31 March 2017 outside London.
The FirstBuy scheme was announced in the Budget AHO NB
2011 to help support 10,000 first time buyers on the
FirstBuy property ladder. The scheme was expanded in
September 2012 and from 1 April 2013 was replaced
with Help to Buy
The Get Britain Building programme was set up to Social Rent NB
unlock more than 12,000 homes on stalled sites with / Int. Rent /
Get Britain Building
planning permission through access to development AHO /
finance. Market
Page 16
OFFICIALProgramme Programme Summary Tenure 1 Build
Type 2
Help to Buy was announced in the Budget 2013 to help Market NB
purchasers struggling to buy a new build home. It offers
a maximum 20% (40% in London) equity loan (minimum
10%) on new build properties up to a maximum
purchase price of £600,000.
Launched in April 2013 with an initial budget of £3.7bn,
the programme aspired to support 74,000 plus
homebuyers in the first 3 years. The 2015 Spending
Review confirmed £8.6bn of funding and extended the
programme to 2021 to assist an anticipated 145,000
purchases. In October 2017, the Government
Help to Buy (equity announced it will invest a further £10 billion in the Help
loan) to Buy Equity Loan programme.
More than 130,000 completions have already taken
place by people using the equity loan, which helps
people buy a new build home with only a 5% deposit.
The new funding means that the Help to Buy Equity
Loan could help around 135,000 more people to buy
homes by 2021. This would bring the total number of
households across England that would be supported
through the scheme since it began in 2013 to around
360,000.
The Homelessness Change Programme was Aff. Rent NB/A
announced as part of the Government’s Spending
Homelessness
Review 2010 and delivered 1,128 new or refurbished
Change 3
bed spaces in hostel accommodation by 31 March 2015
(outside London).
Homes England is allocating a share of up to £25 million Aff. Rent NB/A
capital funding for specialist housing providers, on
behalf of the Department of Health, to bring forward
proposals for developing and improving hostel
accommodation and facilities for the delivery of
healthcare, training or education aimed at supporting
Homelessness
rough sleepers, those at risk of sleeping rough, and
Change 2015-18
other non-statutory homeless people of specialist
housing to meet the needs of older people and adults
with disabilities or mental health problems outside of
London.
This programme was launched jointly alongside the
Platform for Life fund in March 2015.
The Kickstart Housing Delivery programme was part of Social Rent NB
Kickstart Housing the 2009 Housing Stimulus Programme investing in / Int. Rent /
Delivery restarting more than 20,000 homes on stalled sites. AHO /
The programme closed on 31 March 2013. Market
The Levelling Up – Home Building Fund offers finance Social Rent NB
Levelling Up – from £250,000. Smaller loans for innovative housing / Int. Rent /
Home Building Fund solutions will also be considered. AHO /
Market
Through our new Accelerated Construction programme Social Rent NB
we want to provide a tailored package of support to / Int. Rent /
ambitious local authorities who would like to develop out AHO /
Local Authority surplus land holdings at pace. Market
Accelerated There is no single approach to accelerated construction
Construction that we expect to support. Our intention is to support a
range of proposals at different scales and in locations
where there is sufficient demand for housing.
Local Authority New The Local Authority New Build programme was set up to Social Rent NB
Build deliver 4,000 homes for rent by 31 March 2012.
Page 17
OFFICIALProgramme Programme Summary Tenure 1 Build
Type 2
The Mortgage Rescue scheme was announced as part AHO / Int. A
of the Government’s Spending Review 2010 to provide Rent
Mortgage Rescue 3 support to some 2,500 vulnerable home owners
struggling to maintain mortgage payments and at risk of
repossession. This scheme is now closed.
The National Affordable Housing Programme is the Social Rent NB/A
National Affordable
predecessor to the AHP 2011-15. / Int. Rent /
Housing Programme
AHO
Homes England is allocating a share of up to £25 million Aff. Rent NB/A
capital funding for specialist housing providers, on
behalf of the Department of Health, to bring forward
proposals for developing low-rent accommodation for
young people aged 18 to 24 who are homeless or at risk
of homelessness and are in housing need, to support
their participation in work, further education or
Platform for Life
vocational training, with the aim of assisting residents
into long term employment and independence, and
improving their prospects for a successful and healthy
life.
This programme was launched jointly alongside the
Homelessness Change 2015 to 2017 fund in March
2015.
The Property and Regeneration programme covered all Social Rent NB/A
Property and the historical property and regeneration investments and / Int. Rent /
Regeneration assets inherited from English Partnerships. With effect AHO /
Programme from 1 April 2015, existing commitments transferred to Market
the Single Land Programme.
The Rent to Buy Loan 2015-17 provided loans at a low, AHO NB
fixed rate to registered providers to deliver homes
outside London. The homes will be let at a sub-market
Rent to Buy rent for at least 7 years with the intention of supporting
working households to save money and achieve their
aspiration of home ownership.
This programme is now closed.
With effect from 2 April 2012, every additional local Aff. Rent NB
authority home sold under Right to Buy will be replaced
by a new home for affordable rent, with receipts from
Right to Buy sales recycled towards the cost of replacement. Where
Replacement a local authority decides not to undertake the
development themselves, they return the relevant
portion of the receipts to DLUHC for re-investment
nationally.
This programme aims to increase the supply of Shared Aff. Rent / NB/A
Ownership and other affordable homes in England by Social Rent
Shared Ownership
March 2021. / AHO
and Affordable
(Shared
Homes Programme
Ownership
2016-21
and Rent to
Buy)
A Short Form Agreement (SFA) is used by Homes Aff. Rent NB/A
Short Form
England to contract with providers who wish to deliver
Agreement 3
Affordable Rent units without Homes England funding.
Page 18
OFFICIALProgramme Programme Summary Tenure 1 Build
Type 2
The Single Land Programme, with effect from 1 April Social Rent NB/A
2015, consists of existing commitments taken from the / Int. Rent /
amalgamation of historical Homes England land AHO /
programmes (Accelerated Land Disposal, Economic Market
Single Land Assets and Property and Regeneration) and transferred
Programme sites from across Government under the Public Sector
Land Transfer model. It is a self-financing programme
funded through the recycling of receipts supporting
Government’s targets on housing (including starter
homes), public sector land release and asset disposals.
The Home Building Fund is government finance to Social Rent NB/A
The Home Building increase the number of new homes being built in / Int. Rent /
Fund – Short Term England. Applications are being accepted from private AHO /
Fund sector businesses to build new homes or prepare sites Market
for development.
The Traveller Pitch Funding programme was announced Aff. Rent / NB/A
as part of the Government’s Spending Review 2010 and AHO
Traveller Pitch
delivered 515 new traveller pitches by 31 March 2015
Funding 3
(outside London). In addition, 386 refurbished pitches
were delivered.
1 Tenure indicates whether units delivered under each programme are allocated to Affordable Rent (Aff. Rent), Social
Rent (Social Rent), Intermediate Rent (Int. Rent), Affordable Home Ownership (AHO), including Shared Ownership and
Rent to Buy, or Open Market (Market).
2 New supply is either a new build (NB) or an acquisition (A) from existing non-affordable stock. Grant under some
programmes can be used to deliver either newly built units or to fund acquisitions.
3 The programme was part of the Affordable Homes Programme (AHP) 2011-15. The majority of delivery through the
AHP 2011-15 and other associated programmes was made available as Affordable Rent with some Affordable Home
Ownership and, in some limited circumstances, Social Rent. Intermediate Rent was not delivered by the AHP 2011-15
unless it was through Mortgage Rescue or pre-existing commitments from the National Affordable Housing Programme.
Page 19
OFFICIALAnnexe 2
England – Regions (former Government offices for the regions (GOR))
Page 20
OFFICIALenquiries@homesengland.gov.uk
0300 1234 500
gov.uk/homes-england
OFFICIALYou can also read