Hotspot Analysis of Structure Fires in Urban Agglomeration: A Case of Nagpur City, India - MDPI

 
CONTINUE READING
Hotspot Analysis of Structure Fires in Urban Agglomeration: A Case of Nagpur City, India - MDPI
fire

Article
Hotspot Analysis of Structure Fires in Urban Agglomeration:
A Case of Nagpur City, India
Priya P. Singh * , Chandra S. Sabnani and Vijay S. Kapse

                                          Department of Architecture and Planning, Visvesvaraya National Institute of Technology, Nagpur 440010, India;
                                          csabnani@arc.vnit.ac.in (C.S.S.); vskapse@arc.vnit.ac.in (V.S.K.)
                                          * Correspondence: priya.work.singh@gmail.com or priyasingh@students.vnit.ac.in

                                          Abstract: Fire Service is the fundamental civic service to protect citizens from irrecoverable, heavy
                                          losses of lives and property. Hotspot analysis of structure fires is essential to estimate people and
                                          property at risk. Hotspot analysis for the peak period of last decade, using a GIS-based spatial
                                          analyst and statistical techniques through the Kernel Density Estimation (KDE) and Getis-Ord Gi*
                                          with Inverse Distance Weighted (IDW) interpolation is performed, revealing fire risk zones at the
                                          city ward micro level. Using remote sensing, outputs of hotspot analysis are integrated with the
                                          built environment of Land Use Land Cover (LULC) to quantify the accurate built-up areas and
                                          population density of identified fire risk zones. KDE delineates 34 wards as hotspots, while Getis-Ord
                                          Gi* delineates 17 wards within the KDE hotspot, the central core areas having the highest built-up
                                          and population density. A temporal analysis reveals the maximum fires on Thursday during the
                                          hot afternoon hours from 12 noon to 5 p.m. The study outputs help decision makers for effective
                                          fire prevention and protection by deploying immediate resource allocations and proactive planning
                                          reassuring sustainable urban development. Furthermore, updating the requirement of the National
                                Disaster Management Authority (NDMA) to build urban resilient infrastructure in accord with the
         
                                          Smart City Mission.
Citation: Singh, P.P.; Sabnani, C.S.;
Kapse, V.S. Hotspot Analysis of
                                          Keywords: fire incidence; hotspot analysis; KDE; Getis-Ord Gi*; IDW interpolation; fire risk zones;
Structure Fires in Urban
                                          built-up areas; temporal analysis; sustainable development
Agglomeration: A Case of Nagpur City,
India. Fire 2021, 4, 38. https://doi.
org/10.3390/fire4030038

Academic Editor: Maged A. Youssef         1. Introduction
                                                Structure fires are the fires involving the structural components of various types of
Received: 23 June 2021                    residential, commercial, educational, or industrial buildings. Structure fires have sub-
Accepted: 19 July 2021                    stantial consequences adversely affecting urban sustainable development threatening life
Published: 21 July 2021                   safety, property protection, continuity of operations, environmental protection, and her-
                                          itage conservation. As per the International Association of Fire and Rescue Services, India
Publisher’s Note: MDPI stays neutral      has accounted the average fire rate as 1.18 per 1000 inhabitants per year with an average
with regard to jurisdictional claims in   fire death of 1.04 per 100 fires for a period of five years from 2014 to 2018 [1]. The Indian
published maps and institutional affil-   Risk Survey Report 2018 has listed fire as the third of the top five identified risks, with the
iations.
                                          increased vulnerability causing tremendous losses to physical assets over the last three
                                          years, and in 2019, fire risk was on the tenth rank. Hence, fire is of major concern [2].
                                          The National Crime Records Bureau 2019 data of India has accounted for a total of 11,037
                                          accidental fires, with 69% of these fires being in the structures of schools or commercial,
Copyright: © 2021 by the authors.         residential, and governmental buildings, and a total of 10,915 deaths, with 62% in structure
Licensee MDPI, Basel, Switzerland.        fires, and a total of 441 persons injured, with 78% in structure fires [3]. Hence, it is evident
This article is an open access article    that structure fires have an adverse impact on the sustainability of an urban built environ-
distributed under the terms and           ment, affecting and disrupting the urban functionality with heavy losses of property and
conditions of the Creative Commons
                                          lives [4]. Therefore, the fire incidence pattern of the urban agglomeration is to be assessed
Attribution (CC BY) license (https://
                                          delineating the hotspot area along with statistically significant fire risk areas for effective
creativecommons.org/licenses/by/
                                          and efficient mitigation [5].
4.0/).

Fire 2021, 4, 38. https://doi.org/10.3390/fire4030038                                                            https://www.mdpi.com/journal/fire
Hotspot Analysis of Structure Fires in Urban Agglomeration: A Case of Nagpur City, India - MDPI
Fire 2021, 4, 38                                                                                             2 of 25

                         Urban agglomeration is an inevitable phenomenon in the process of urbanization
                   sheltering nearly 68% of the Earth’s population by 2050 and with its center of gravity in the
                   Asian cities of China and India [6,7]. Mckinsey and company have predicted the probability
                   of Indian urban agglomeration with an intense rise in population density accounting for
                   nearly thirteen cities with a population of more than four million and a million-plus
                   population in sixty-eight cities by 2030 [8]. With the rapid urban agglomeration, cities
                   are leading to have compact development and expansion by urban sprawl development
                   with land-use transformations resulting in a multitude of challenges by increased and new
                   fire risks [9–11]. In addition, the increasing demography increases the vulnerability of
                   fire risk, demanding a significant availability of fire service provisions for efficient and
                   reliable fire safety management [12]. As the urban growth develops, the provision of
                   fire service facilities becomes a priority to cope up with the alarming demand for fire
                   safety [13] and has to be strengthened by comprehensive and accurate information for
                   balanced decision making with an emergent response [14]. Therefore, understanding
                   the fire incidence pattern with its severity, particularly structure fires in the context of
                   sustainable urban development, is of great significance for the implementation through
                   systematic risk assessment by mitigating measures [15]. The planning of preparedness
                   of fire service on the basis of risk assessment can improve the emergency response and
                   thus enhance the efficiency of fire service. It is, therefore, recognized as an essential part of
                   fire prevention and signs to assess the fire risk zones, delineating hotspots based on the
                   historical fire incidences to understand the fire incidence pattern at the specific geographical
                   location, as the geographical characteristics vary globally.
                         Geospatial tools comprising Geographic Information Systems (GIS) and Remote Sens-
                   ing (RS) are powerful tools to evaluate the spatial fire distribution patterns integrating
                   the temporal data [16] and are widely adopted as an analysis system for urban infrastruc-
                   tures [17]. The spatial and temporal patterns of structure fires are of interest, integrating
                   the potential dimensions of space and time [15–21]. The fire distribution often has a
                   wide variation over space and time, and it is critical to categorize fire distributing under
                   uniform or random patterns with the changing challenges of the urban agglomerating
                   space [22,23]. The fire distribution pattern has a close association with human activities
                   and the surrounding built environment, as well as the demographic and socioeconomic
                   factors [11,24]. Built environments with high population densities reflect high human
                   activities with an increased risk of structure fires [15,20]. Fire risk has been researched
                   in residential fires associated with varied socioeconomic aspects [25–28]. The impact of
                   fire incidences was revealed with high risk to very young children and very old residents
                   of Canada [29]. Structure fire studies have analyzed the various causes of fire incidents,
                   integrating time in months and hours [30]. The temporal data analyses of fire incidences of
                   previous studies in Australia revealed maximum fire incidence frequencies on weekdays
                   and school holidays, establishing the close association between fire incidences and the
                   socioeconomic conditions of the urban areas [20,28], with an increased rate over the pace
                   of time [11]. RS integrated with GIS has many applications in the various fields of weather,
                   forestry, agriculture, surface changes, biodiversity, and many more [30]. In the urban
                   planning context for fire services, RS technologies can be used for detecting land use and
                   land cover (LULC) with active fires (hotspots) determining the physical properties of land
                   with accuracy and precision [11,31,32], quantifying the built-up land for allocation of fire
                   service resources and enhancing the efficiency of emergency responses with sustainability.
                         Previous studies quantified the fire risk correlating the various aspects of the socioeco-
                   nomic characteristics of neighborhoods in developed countries at macro-level spatial units
                   such as countries, states, and census tracks [15–18,33]. In South Asia, Indian cities have
                   undergone a rapid decadal transformation of the built environment, changing the urban
                   landscape with social structures accommodating the increasing population and resulting
                   in the urban agglomeration of a developing country [34,35], which are comparatively less
                   researched. The fire incidence pattern in urban areas at the micro-level of urban agglom-
                   eration in developed countries is a research topic of great interest and an emergent need
Hotspot Analysis of Structure Fires in Urban Agglomeration: A Case of Nagpur City, India - MDPI
Fire 2021, 4, 38                                                                                            3 of 25

                   as well [24,36]. Research on fire severity quantifying the losses to assess the impacts of
                   fire and identifying the fire risk areas for strategic interventions has become increasingly
                   popular in recent years [37]. Population density as well can be the final output and target
                   for resource allocation.
                         Hotspot analysis determines the dense concentration of events within a limited geo-
                   graphical area. Numerous statistical models such as descriptive statistics, Poisson regres-
                   sion, binomial regression, and Bayesian network models for hotspot analysis were adopted
                   in varied disciplines, dealing with the randomness of events in space and time [38–40].
                   Being statistical, these methods do not consider the spatial characteristics of the events.
                   GIS tools have advanced techniques to estimate and quantify hotspots identifying the high
                   concentration of events to detect areas with active fires inferring as high fire risk zones, re-
                   ferred to as a hotspot, represented by cartographic maps for visualization [41]. In addition,
                   Kernel Density Estimation (KDE) and Hotspot Analysis (Getis-Ord Gi*) HA(GOG*) with
                   Inverse Distance Weighted (IDW) interpolation are widely applied in varied disciplines of
                   geography, traffic safety management, and crime [42–44].
                         In India, a developing country, cities have undergone fundamental transformations in
                   an urban landscape and social structures, and the process of urbanization has increased fire
                   incidences and intensified consequences [2,35]. Fire service is a part of the responsibilities
                   of Urban Local Bodies (ULB) to provide fire safety of urban areas [45] and plays a significant
                   role in the success of all schemes by the Government of India carried out for the betterment
                   of citizen’s life and infrastructures integrating sustainable urbanization in the cities such
                   Atal Mission for Rejuvenation and Urban Transformation (AMRUT) [46], Pradhan Mantri
                   Awas Yojna (PMAY) [47], Urban Livelihood Mission, and Heritage City Development
                   and Augmentation Yojna (HRIDAY) [48]. The National Disaster Management Authority
                   (NDMA) has listed above 95% deficiencies in fire services throughout the country in
                   2012, with updating requirements of later date, which is still awaiting [49]. The spatial
                   accessibility of fire vehicles for emergency response was a major consideration for assessing
                   the deficiencies. Thus, the questions raised for considering the fire incidence pattern of
                   urban areas for updating and strengthening the deficiencies are as follows:
                   •    Are fire incidences evenly distributed?
                   •    Are the fire risk areas identified and quantified?
                   •    Are the fire occurrences analyzed on the temporal scale?
                   •    Are the causes of fire incidences assessed for the identified fire risk areas?
                   •    Are urban and human activities responsible for fire occurrences? How so?
                         Therefore, to address the research questions, the objective of the study is hotspot
                   analysis delineating the fire risk zones to understand the fire pattern on a spatial and
                   temporal scale with cause-wise analysis on historical fire incidences. The results of the
                   study are to be integrated in the reassessment and restructuring of the fire service building
                   community in order to achieve a resilient and sustainable built environment. The continual
                   reassessment and restructuring of fire service provisions are essential in reducing fire
                   severity in terms of fire deaths, injuries, and property damage [50]. Resource allocations
                   for fire service involve a heavy budget investment and hence a long-term peak period
                   has to be assessed when updating the requirements. The study aims to assess structure
                   fire patterns in the urban agglomeration for a decadal period of historical fire incidences
                   from 2011 to 2020, delineating the hotspot areas with the quantification of the built-up
                   areas and population density under significant fire risk zones for effective and efficient
                   mitigation with proactive planning during the peak period. The study has the potential
                   to inform policy makers of other ULBs of similar cities to reassess and restructure fire
                   services, integrating Smart City Mission, assuring sustainability [51], overlapping with
                   the Sustainable Development Goals (SDG-11) [52] to develop a sustainable city, state,
                   and nation.
Hotspot Analysis of Structure Fires in Urban Agglomeration: A Case of Nagpur City, India - MDPI
21, 4, x FOR PEER REVIEW                                                                                                            4 of 27

                           policy makers of other ULBs of similar cities to reassess and restructure fire services, inte-
        Fire 2021, 4, 38   grating Smart City Mission, assuring sustainability [51], overlapping with the Sustainable                                 4 of 25
                           Development Goals (SDG-11) [52] to develop a sustainable city, state, and nation.

                           2. Materials and Methods
                                          2. Materials and Methods
                           2.1. Study Area
                                          2.1. Study Area
                                 The urban agglomeration of Nagpur city of Maharashtra state is centrally located in
                                                The urban agglomeration of Nagpur city of Maharashtra state is centrally located
                           India with a zero-mile location at 21°9′ N and 79°5′ E◦ coordinates.                    The population of the
                                          in India with a zero-mile location at 21 90 N and 79◦ 50 E coordinates. The population of
                           city is 2.45 million as per     the  2011 census     and  is ranked    as
                                          the city is 2.45 million as per the 2011 census and is rankedthe  third  most  populated     urban
                                                                                                                             as the third   most populated
                           centre in the state  and    thirteenth     in the   country,    with   an    average    population
                                          urban centre in the state and thirteenth in the country, with an average population     density    of        density
                           10,873 persons ofper   km persons
                                              10,873
                                                       2 , covering perankmarea    of 225.08ankm
                                                                             2 , covering           2
                                                                                                 area , merging
                                                                                                          of 225.08twokmcensus      towns
                                                                                                                          2 , merging    twoofcensus towns
                           Narsala and Hudkeshwar
                                          of Narsala and     [53],Hudkeshwar
                                                                   and subdivided  [53],into
                                                                                          and138   wards as shown
                                                                                                subdivided       into 138inwards
                                                                                                                              Figureas1. Nag-
                                                                                                                                         shown in Figure 1.
                           pur has a tropical   savannah        climate  (Aw     in Koppen     climate     classification)
                                          Nagpur has a tropical savannah climate (Aw in Koppen climate classification)         with  dry  con-       with dry
                           ditions throughout    the   year,    where   summer      temperatures        intensify   up to  47.8
                                          conditions throughout the year, where summer temperatures intensify up to 47.8 ◦ C,    °C,  making
                           it the hottest place
                                          making in it
                                                    India      [54] and
                                                        the hottest       suitable
                                                                       place         for [54]
                                                                              in India    the escalation
                                                                                               and suitable   of for
                                                                                                                  thethe
                                                                                                                      fireescalation
                                                                                                                             frequency.of The
                                                                                                                                           the fire frequency.
                           winter temperature     declines
                                          The winter            to 10° to 12declines
                                                            temperature       °C and to  has10thetoaverage
                                                                                               ◦          ◦
                                                                                                      12 C and annual
                                                                                                                    hasrainfall   of 1161.54
                                                                                                                         the average      annual rainfall of
                           mm [55].       1161.54 mm [55].

                                  1. The geographical location of the
                           Figure 1.                              the study
                                                                      study area
                                                                            area with
                                                                                 with structure
                                                                                      structure fires
                                                                                                 firesacross
                                                                                                      acrossthe
                                                                                                             thestudy
                                                                                                                 studyperiod.
                                                                                                                      period.

                                              Structures
                                Structures refer            referfunctional
                                                 to the urban     to the urban   functional
                                                                             confined         confined
                                                                                         spaces          spaces
                                                                                                 that have        that haveimpact
                                                                                                             a significant   a significant impact
                                         on  human    life and   daily activities  [56].  According   to  the  Census
                           on human life and daily activities [56]. According to the Census 2011, 594,272 buildings     2011,  594,272 buildings
                                         were  housed     for  various    purposes    covering   52%   of  the  built
                           were housed for various purposes covering 52% of the built up land area of the city, ex-    up  land  area of the city,
                                         expanding    to 73%   in 2020.  Out  of these  buildings,  82.24%   are  used
                           panding to 73% in 2020. Out of these buildings, 82.24% are used as a residence; 2.79% for    as a residence;  2.79% for
                                         residence-cum-other
                           residence-cum-other    use; 8.60% for  use;shops
                                                                        8.60%and
                                                                               for shops
                                                                                   offices;and  offices;
                                                                                             0.31%   for0.31%
                                                                                                          schoolsfor and
                                                                                                                     schools  and colleges, 0.26%
                                                                                                                          colleges,
                           0.26% for hotels, lodges, guest houses, etc.; 0.48% as hospital, dispensary, etc.; 0.90%0.90%
                                         for hotels, lodges,    guest  houses,   etc.; 0.48%  as hospital,   dispensary,   etc.; as     as factory,
                                         workshop,    work   shed,  etc.; 0.58%  as a  place of worship;    and  3.85%
                           factory, workshop, work shed, etc.; 0.58% as a place of worship; and 3.85% as other non-     as  other non-residential
                                         use.
                           residential use.
                                              Census 2011 has accounted for the structures of the residences and residence-cum-
                                Census 2011 has accounted for the structures of the residences and residence-cum-
                                         other by proportional building materials listed under roof, walls, and floors. The material
                           other by proportional building materials listed under roof, walls, and floors. The material
                                         of walls comprised a maximum of burnt bricks with 65.5%, followed with concrete—11.2%,
                                         Mud/unburnt—10.6, stoned packed—4.3%, stone not packed—3%, grass/thatch—2.2%,
                                         wood—1.3%, plastic/polythene—0.5%, and any other—0.2%. Material of roofs comprised a
                                         maximum of concrete with 62.6%, followed with galvanized iron/metals/asbestos—12.9%,
Hotspot Analysis of Structure Fires in Urban Agglomeration: A Case of Nagpur City, India - MDPI
of walls comprised a maximum of burnt bricks with 65.5%, followed with concrete—
                   11.2%, Mud/unburnt—10.6, stoned packed—4.3%, stone not packed—3%, grass/thatch—
Fire 2021, 4, 38   2.2%, wood—1.3%, plastic/polythene—0.5%, and any other—0.2%. Material of roofs 5com-
                                                                                                    of 25
                   prised a maximum of concrete with 62.6%, followed with galvanized iron/metals/asbes-
                   tos—12.9%, machine-made 11.8%, hand-made—5.7%, stone/slate—2.5%, grass/thatch—
                   2%, burnt brick—1.1%, plastic/polythene—1%, and any other—0.3%. Material of floors
                   machine-made
                   comprised      11.8%, hand-made—5.7%,
                              a maximum                     stone/slate—2.5%,
                                           of cement with 42.5%,              grass/thatch—2%,
                                                                 followed by mosaic/floor         burnt
                                                                                           tiles—40.3%,
                   brick—1.1%,  plastic/polythene—1%,  and any other—0.3%. Material of floors comprised
                   mud—8.6%, stone—6%, burnt brick—1.5%, any other material—0.9%, and wood/bam-
                   a maximum of cement with 42.5%, followed by mosaic/floor tiles—40.3%, mud—8.6%,
                   boo—0.2%.
                   stone—6%, burnt brick—1.5%, any other material—0.9%, and wood/bamboo—0.2%.
                   2.1.1. Data and Sources
                   2.1.1. Data and Sources
                         Nagpur Municipal Corporation (NMC) administers the urban centre of Nagpur, and
                          Nagpur Municipal Corporation (NMC) administers the urban centre of Nagpur, and
                   the administrative data with regard to ward limits and the population was provided by
                   the administrative data with regard to ward limits and the population was provided
                   NMC in kml format. The decadal population growth rate for 2011 was 19.3% and a growth
                   by NMC in kml format. The decadal population growth rate for 2011 was 19.3% and
                   of 20.9% isof
                   a growth       projected
                                    20.9% isfor 2021, 21.2%
                                             projected         for 2031,
                                                          for 2021,      andfor
                                                                      21.2%   20.7%
                                                                                  2031,forand204120.7%
                                                                                                    [55]. The   yearly
                                                                                                          for 2041       popula-
                                                                                                                      [55].    The
                   tion  size  from  2011 to 2020   was  procured   from   World   Urbanization        Prospects
                   yearly population size from 2011 to 2020 was procured from World Urbanization Prospects          2018   [57] to
                   analyze
                   2018 [57]on  toaanalyze
                                    yearly basis.
                                           on a yearly basis.
                         Fire   incidence data  forthe
                          Fire incidence data for    theperiod
                                                         periodofofa adecade
                                                                       decade   from
                                                                             from      2011
                                                                                     2011   to to 2020
                                                                                               2020   waswas    procured
                                                                                                            procured    from from
                                                                                                                                the
                   the
                   Fire Service Department of NMC on a yearly, monthly, and daily basis, revealing the risethe
                        Fire  Service  Department     of NMC    on  a yearly, monthly,      and   daily   basis,  revealing      of
                   rise of fire incidents
                   fire incidents          with
                                    with the     the population
                                              population    growth.growth.  The maximum
                                                                      The maximum                incidences
                                                                                         incidences             were observed
                                                                                                        were observed       in the
                   in the hottest
                   hottest   monthmonth
                                     of Mayofwith
                                               Maya with   a highest
                                                      highest z-scorez-score
                                                                       value ofvalue
                                                                                 2.01 >of1.96
                                                                                           2.01at> a1.96
                                                                                                     95%atconfidence
                                                                                                             a 95% confidence
                                                                                                                          level as
                   level  as  shown   in Figure   2, indicating  the  impact  of  climatic    conditions
                   shown in Figure 2, indicating the impact of climatic conditions on fire incidence         on fire frequency.
                                                                                                                      incidence
                   frequency.
                   Therefore, Therefore,
                                  the datasetthe
                                               fordataset  for the
                                                    the hottest    hottest
                                                                 month    ofmonth
                                                                            May with  of May    with maximum
                                                                                           maximum                   fire occur-
                                                                                                           fire occurrences       is
                   rences   is researched
                   researched              cumulatively
                                  cumulatively   from 2011from    2011for
                                                              to 2020   to hotspot
                                                                           2020 foranalysis
                                                                                      hotspot analysis
                                                                                                 of structureof structure
                                                                                                                 fires.      fires.

                   Figure 2.
                   Figure    Monthly fire
                          2. Monthly fire incidences.
                                          incidences.

                         Structure fire
                         Structure  fire incident
                                          incidentdata
                                                   dataof
                                                        ofthe
                                                           thecity
                                                               citywere
                                                                    wereconsidered
                                                                         consideredforfor
                                                                                        the study,
                                                                                          the      with
                                                                                              study,     a cumulative
                                                                                                      with  a cumula-
                   count   of 570 fire events  for the hottest month  of May  with  maximum      fire frequency
                   tive count of 570 fire events for the hottest month of May with maximum fire frequency        from
                   2011 to 2020. The daily fire incidence data was in regional language in the daily call register,
                   from 2011 to 2020. The daily fire incidence data was in regional language in the daily call
                   including the addresses, date, call time, cause of the fire, and brief of occupancy type for
                   register, including the addresses, date, call time, cause of the fire, and brief of occupancy
                   each fire event (such as house fire, shop fire, hospital fire, etc., for structure fires). For the
                   type for each fire event (such as house fire, shop fire, hospital fire, etc., for structure fires).
                   study, structure fires are grouped and classified by occupancy type based on the National
                   For the study, structure fires are grouped and classified by occupancy type based on the
                   Building Code of India (NBCI), 2016 [58] and the proportion of each structure fire reveals
                   National Building Code of India (NBCI), 2016 [58] and the proportion of each structure
                   that the Residential fires have the highest proportion of 48% with next mercantile with 32%,
                   fire reveals that the Residential fires have the highest proportion of 48% with next mer-
                   while industrial of 7%, business of 4%, assembly of 3%, storage of 3%, educational of 2%,
                   cantile with 32%, while industrial of 7%, business of 4%, assembly of 3%, storage of 3%,
                   and institutional of 2%. The material of construction was not mentioned in the register and
                   hence the Census 2011 building material data is considered with the maximum of framed
                   structures with concrete and masonry.

                   2.1.2. Land Cover Data
                        Landsat-5 and Landsat-8 satellite images from the USGS Earth Explorer website were
                   procured with a minimum cloud cover of less than 5% (details described in Table 1) for
                   the years 2011 and 2020 to understand the urban expansion with built infrastructure
Hotspot Analysis of Structure Fires in Urban Agglomeration: A Case of Nagpur City, India - MDPI
tioned in the register and hence the Census 2011 building material data is considered
                                    the maximum of framed structures with concrete and masonry.

                                    2.1.2. Land Cover Data
Fire 2021, 4, 38                        Landsat-5 and Landsat-8 satellite images from the USGS Earth Explorer      6 of 25 website
                                   procured with a minimum cloud cover of less than 5% (details described in Table
                                   the years 2011 and 2020 to understand the urban expansion with built infrastructu
                   accommodating   commodating
                                      the increasedthe   increased The
                                                      population.   population.  The classified
                                                                        images were  images wereusing classified  using the false
                                                                                                         the false-color
                                   bands   of 7, 6, and 4 to develop the LULC    maps of the city, and  the  land
                   bands of 7, 6, and 4 to develop the LULC maps of the city, and the land cover was classified    cover was clas
                                   as built-up   area, vegetation, fallow  land, and water  body.   For  analysis,
                   as built-up area, vegetation, fallow land, and water body. For analysis, only built-up areas     only built-up
                                   were  delineated    comprising   the structures and other  land
                   were delineated comprising the structures and other land covers were excluded.    covers   were  excluded.

                                   Table 1. Details of Landsat-8 satellite imaginary used in the study.
                   Table 1. Details of Landsat-8 satellite imaginary used in the study.
                                      Landsat                                                                              Acquisit
                        Landsat                                                                               Acquisition
                                          Sensor Sensor Scene ID
                                      Satellite
                                                                      Scene ID
                                                                             Path/Row                         Path/Row
                                                                                                                              Date
                        Satellite                                                                                 Date
                       Landsat-5
                                     Landsat-5
                                            TM
                                                   TM          LT51440452011162KHC04
                                                    LT51440452011162KHC04     144/45
                                                                                                                144/45
                                                                                                              11 June 2011
                                                                                                                           11/06/20
                       Landsat-8     Landsat-8
                                         OLI_TIRSOLI_TIRS      LC81440452020139LGN00
                                                    LC81440452020139LGN00     144/45                          18144/45
                                                                                                                 May 2020 18/05/20

                   2.2. Methods 2.2. Methods
                                         The hotspot
                        The hotspot analysis              analysis
                                                 of structure    firesofis structure
                                                                           performedfireswithistwo
                                                                                                 performed     with two
                                                                                                    spatial analyst       spatial analyst
                                                                                                                     techniques
                                   niques  of  KDE     and  HA(GOG*)         with  IDW    interpolation
                   of KDE and HA(GOG*) with IDW interpolation to arrive at fire risk zones. Administrativeto arrive at fire risk zones. Ad
                                   istrative data    with   population       density   are  joined   with  the
                   data with population density are joined with the ward areas, and furthermore, the results   ward   areas,  and further
                   from these twothe   results are
                                     methods    from     these two
                                                      compared      tomethods
                                                                       assess theare    compared
                                                                                     significant     torisk
                                                                                                  fire  assess  the significant
                                                                                                            zones.  The RS toolfire risk z
                                   The  RS  tool   is  used  to  acquire     the built-up    areas  to quantify
                   is used to acquire the built-up areas to quantify the fire risk zones. Furthermore, population the fire risk zones. Fu
                                   more,  population      density    is  estimated    for each  fire
                   density is estimated for each fire risk zones and ranked to reveal the fire risk  risk zones   and ranked
                                                                                                                         due toto reveal th
                                   risk due   to  structure    fires   in  the  city  for  implications.   The
                   structure fires in the city for implications. The temporal analysis on yearly, weekdays, and  temporal   analysis  on y
                                   weekdays,     and    time, along     with   cause-wise    analysis   was
                   time, along with cause-wise analysis was also performed to reveal the association of urbanalso  performed    to reveal t
                                   sociation
                   and human activities       of urban
                                           with            and
                                                    the fire     human activities
                                                             occurrences.               withisthe
                                                                                The study          fire occurrences.
                                                                                                performed              The study
                                                                                                             as represented    in is perfo
                   Figure 3.       as represented in Figure 3.

                   Figure 3. Methodological flow chart
                                          Figure       of the study. flow chart of the study.
                                                 3. Methodological

                   2.2.1. Data Pre-Processing
                       The fire incidences were tagged in Google Earth Pro after acquiring the coordinates
                   physically using Epicollect5 and imported in ArcGIS for analysis. Before performing the
                   hotspot analysis, the data are combined using the ‘collect event’ tool to combine all the
                   events in the same geographical location with the new point feature class of ‘ICOUNT’ and
                   used as input for both methods.

                   2.2.2. Kernel Density Estimation (KDE)
                        The KDE identifies the dense areas based on the total count of the geographical events
                   over time and is helpful to rectify the spatial pattern with classified intensities of density
                   estimate values [56,59]. The KDE technique was adopted in the developed countries to
Hotspot Analysis of Structure Fires in Urban Agglomeration: A Case of Nagpur City, India - MDPI
Fire 2021, 4, 38                                                                                              7 of 25

                   reveal the occurrence of fire foci under different land uses in the State of Amazonas during
                   2005 [60] and to explore the spatial and temporal dynamics of fire incidents in South Wales,
                   UK [18]. The KDE method statistically represents the spatial smooth continuous surface
                   for intensities of the geographical event points over the space of the study area [61]. The
                   kernel is the circular area of the defined bandwidth radius around each event, indicating
                   the surrounding area under influence with a statistical value indicating the density per unit
                   area, and adding of all the values at all places gives a surface of density estimates. ArcGIS
                   10.6 is used for evaluation considering the default search radius (bandwidth) based on the
                   spatial configuration and number of input points [30]. The kernel density tool calculates
                   a magnitude per unit area from a point using a kernel function to fit a smoothly tapered
                   surface to each point. The surface value is highest at the location and diminishes at the
                   edge of the surface radius considering the distance decay effect [62]. KDE is performed by
                   the mathematical formula as in Equation (1) [61] as follows:

                                                   ˆ                    n  s − sj
                                                                                          
                                                              1
                                                   f (s, b) = 2
                                                             nb       ∑K b                                       (1)
                                                                      i =1

                   where n = total number of observations; b = smoothing parameter (bandwidth); s = coor-
                   dinate vector that indicates where the function is being estimated; sj = coordinate vector
                   representing each event point; and K = density function that satisfies the following condi-
                   tion given by Equation (2):           Z
                                                                 K (s)ds = 1                                     (2)

                   2.2.3. Hotspot Analysis (Getis-Ord Gi*)–HA(GOG*)
                         A hotspot analysis by Gi* statistics was introduced by Getis and Ord for identifying
                   statistically significant spatial clusters of each area at the local level with clusters of high
                   values as Hotspots and low values as cold spots [41,63,64]. The HA(GOG*) technique
                   is widely adopted in varied disciplines of geography, traffic safety management, and
                   crime [56,64,65]. The vulnerable areas associated with high crime rate along with fire were
                   revealed for targeted fire prevention in the city of Surrey, British Columbia, Canada [27].
                   The Gi∗ statistic is a z-score at a local level, calculated by the mathematical formula as
                   expressed in Equation (3) [41,66]. A high positive GiZ score indicates hotspots while
                   negative low GiZ scores indicate cold spots and values near to zero indicates a random
                   distribution of clusters with significance, as follows:

                                                         ∑nj=1 wi,j x j − X ∑nj=1 wi,j
                                                 Gi∗ =   rh                       i                            (3)
                                                              n ∑nj=1 wi,j
                                                                       2 −
                                                                              ∑nj=1 wi,j   2
                                                         S                 n −1

                   where x j is the attribute value for event j, wi,j is the spatial weight between event i and j, n
                   is the total number of events, X = mean is calculated by Equation (4), and S = standard
                   deviation is calculated by Equation (5).

                                                                    ∑nj=1 x j
                                                             X=                                                  (4)
                                                                        n
                                                             s
                                                                 ∑nj=1 x2j         2
                                                       S=                    − X                                 (5)
                                                                    n
                         Hotspot analysis technique in ArcGIS is used to conduct a Gi* statistical significance
                   test identifying the clusters with high concentration values surrounded by high concen-
                   tration values indicating the clusters to be a hotspot and the low concentration values are
                   surrounded by low concentration values indicating the clusters to be a cold spot [67,68].
Hotspot Analysis of Structure Fires in Urban Agglomeration: A Case of Nagpur City, India - MDPI
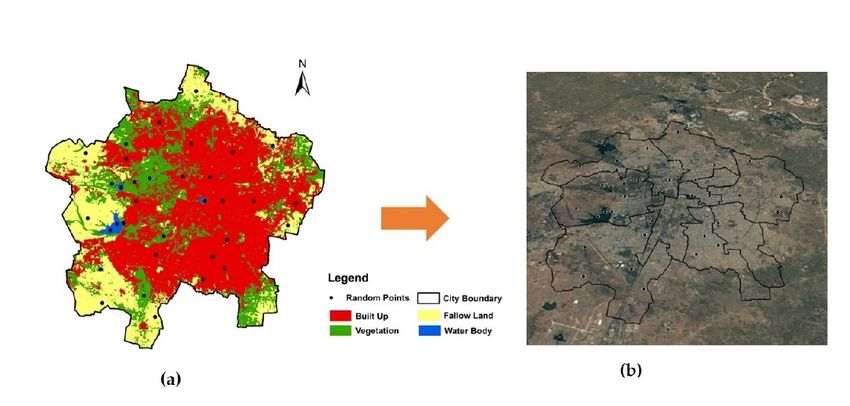
Fire 2021, 4, 38                                                                                             8 of 25

                   Identification of hotspots is of particular operational interest, and with this goal in mind,
                   the count itself was an appropriate measure [44,65,69,70].

                   2.2.4. Inverse Distance Weighted (IDW)
                        The IDW interpolation method estimates the measured values by hotspot analysis
                   surrounding the prediction location [30]. The measured values closest to the prediction
                   location have more influence on the predicted value than those farther away. IDW assumes
                   that each measured point has a local influence that diminishes with distance. It gives
                   greater weights to points closest to the prediction location, and the weights diminish as a
                   function of distance, hence the name inverse distance weighted [30,42].
                        The IDW interpolation method is employed for demarcation of significant fire risk
                   areas representing the spatial distribution in the study area. The IDW interpolation output
                   was spatially joined with the census ward level of the city using a zonal spatial analyst
                   tool to estimate the significant fire risk zonal areas and population under the risk areas.
                   Furthermore, the IDW interpolation is used for predicting the high fire risk zonal areas
                   with the population under risk integrating urbanization for implications.

                   2.2.5. Built-Up Area Estimation from LULC
                        Land cover has been conducted in ArcGIS 10.6 employing maximum likelihood
                   with an image classification tool to measure the built-up area [71]. The land cover was
                   classified into four major classes of built-up area (structures, roads, and small open spaces),
                   vegetation (trees in forest areas, large open spaces, and wetland vegetations), fallow land
                   (remaining open or unutilized land), and water bodies (lakes and ponds) [72]. An accuracy
                   assessment was conducted for each classified image with ground truth data from Google
                   Earth Pro using overall accuracy (OA) and kappa coefficient (K) as shown in Equations (6)
                   and (7) [73]:
                                                                  CD
                                                          OA =        × 100                                   (6)
                                                                  TP
                                                                P(o) − P(e)
                                                           K=                                                 (7)
                                                                  1 − P(e)
                   where CD = a total number of reference samples chosen; TP = total number of correctly
                   classified samples; P(o) is the observed proportion of agreement; and P(e) is the proportion
                   expected by chance [74].
                        The LULC map was used to assess the actual built-up areas for quantification of
                   population density under the risk of GiZ-score fire types. The built-up density is calculated
                   by using Equation (8), and population density by Equation (9) as follows:

                                                                   ∑in=1 TBi
                                                         BUD =                                                  (8)
                                                                   ∑in=1 TAi

                                                                  ∑in=1 TPi
                                                          PD =                                                  (9)
                                                                  ∑in=1 TBi
                   where BUD = Built-up Density; TB = Sum of the total built-up area of all wards; TA = sum
                   of the total area of all wards; PD = Population Density; and TP = sum of the total urban
                   population of the wards.

                   2.2.6. Temporal and Cause-Wise Analysis
                        Temporal data statistical analysis significantly evaluates the association with the
                   correlated variables responsible for fire incidences through the period of years, months,
                   weekdays, and hourly events [36]. The statistical methodology helps in the interpretation
                   of the parameters and, due to its simple application, is extensively applied at urban scale by
                   the decision makers for econometrics, financial inferences, and planning disciplines [75,76].
                   Temporal analysis on a yearly basis for the selected month is performed statistically, fire
                   index for the time series of the year is calculated using Equation (10), z-score for each year is
Hotspot Analysis of Structure Fires in Urban Agglomeration: A Case of Nagpur City, India - MDPI
Fire 2021, 4, 38                                                                                            9 of 25

                   calculated by using Equation (11), and the probability evaluation is performed using z-score
                   value to reveal the highest fire incidences. The ratio between fire incidences and population
                   size of the year is evaluated to understand the impact of urban activities with population
                   growth on fire incidences. Furthermore, the fire incidences are segregated on basis of
                   weekdays and hours to arrive at the maximum frequency by circular statistics represented
                   in radar charts. Pearson’s correlation is evaluated for the hourly fire frequencies using
                   Equation (12) and the sensitivity analysis is performed by Durbin–Watson (DW) statistic
                   using Equation (13) [77]:
                                                                  ∑n X
                                                            FI = i=1                                        (10)
                                                                     X
                                                                  x−µ
                                                             Z=                                             (11)
                                                                     σ
                                                            ∑( x − x )(y − y)
                                                   R= q                                                      (12)
                                                                      2            2
                                                            ∑( x − x ) ∑(y − y)
                                                                               2
                                                            ∑tT=2 (et − et−1 )
                                                       d=                                                    (13)
                                                                 ∑tT=1 e2t
                   where FI is the fire index for the time series of a year, X is the number of fire incidents for
                   the time series of a year, and X is the mean value of the time series of a year. Z = standard
                   score, x = observed value, µ = mean of sample, and σ = standard deviation of the sample.
                   R = Pearson’s correlation coefficient and x and y are variables. T= Number of observations,
                   et = residual given by et = ρet −1 + vt , and ρ = null hypothesis.
                         Human and urban activities causing fire incidences on a yearly temporal scale were
                   investigated to relate with the fire severity [36,78,79]. Cause-wise categorization of the fire
                   incidences is performed, and percentage calculation helps to understand the fire cause
                   pattern due to urban and human activities in the identified fire risk zones for implications.

                   3. Results
                   3.1. Hotspot Spatial Analysis
                   3.1.1. Kernel Density Estimation Result
                        The KDE analysis is performed by applying a spatial analyst tool. The maps generated
                   are spatially joined with the ward map as represented in Figure 4. The output is classified
                   into four groups at the geometric interval as listed in Table 2. The intense area in red
                   color is the identified hotspot area categorized with a very high fire risk zone, with the
                   highest value comprising 9% of the total area and with the highest population density
                   located in the central core and extending towards the northern part of the city with high
                   rise development. The ranking of population density reveals the very high fire risk zone
                   with a maximum population under threat on the least percentage area, while the high fire
                   risk zone has the lowest population density covering the maximum of 54% of the city area
                   with a maximum of 33% of population size, spreading majorly towards the fringe area of
                   the city with low rise development
Hotspot Analysis of Structure Fires in Urban Agglomeration: A Case of Nagpur City, India - MDPI
the highest value comprising 9% of the total area and with the highest population density
                             located in the central core and extending towards the northern part of the city with high
                             rise development. The ranking of population density reveals the very high fire risk zone
                             with a maximum population under threat on the least percentage area, while the high fire
Fire 2021, 4, 38             risk zone has the lowest population density covering the maximum of 54% of the city  area
                                                                                                               10 of 25
                             with a maximum of 33% of population size, spreading majorly towards the fringe area of
                             the city with low rise development

                             Figure4.4.Hotspot
                            Figure     Hotspotfrom
                                               fromthe
                                                    theKernel
                                                       KernelDensity
                                                              DensityEstimation.
                                                                      Estimation.

                             TableTable
                                   2. Fire2.risk
                                             Firezone  classification
                                                  risk zone           for KDE
                                                             classification     outputs.
                                                                            for KDE outputs.

                                                                                           Population           Ranking
     Geometric                Geometric       Number of     Percentage      Percentage         PopulationRanking Based
   Interval Values
                     Fire Risk Zones          Fire Risk
                                               Wards     NumberArea  Percentage    Percentage
                                                                            Population
                                                                                           Density per          Based   on
                                                                                                            on Population
                               Interval                                                        Density
                                                                                              km  2       per Density
                                              Zones      of Wards       Area       Population                  Population
                       Very HighValues                                                       29,860 km
                                                                                                        2
     3.43–24.48                                 34               9              20                                1
                                                                                                                Density
     −0.50–3.42          High                   43              54              33            8339                4
    −1.23–−0.51         Medium3.43–24.48 Very25High          34 21        9     22     20    14,26829,860         3 1
    −5.17–−1.24          Low −0.50–3.42         36
                                              High           43 17       54     26     33    21,078  8339         2 4
                             −1.23–−0.51 Medium              25          21            22           14,268          3
                           3.1.2. Hotspot Analysis
                             −5.17–−1.24       Low (Getis-Ord36 Gi*)–HA(GOG*)
                                                                         17         Result
                                                                                       26           21,078          2
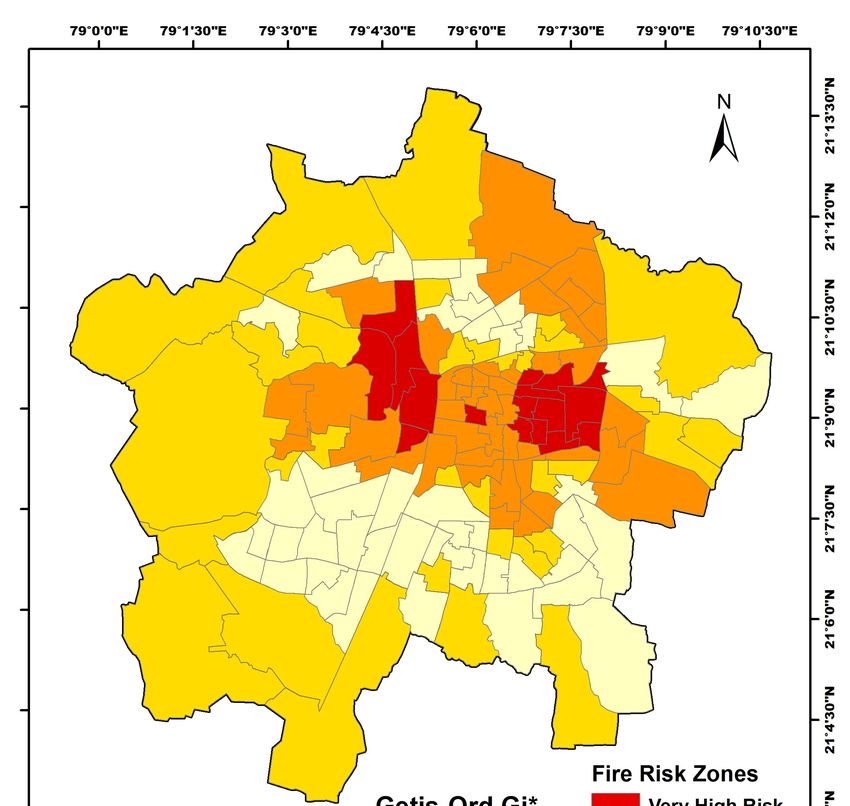
                                 The local level HA(GOG*) was performed to identify the statistical spatial distribution
                           pattern after the process of collected events in ArcGIS to include all overlapping events, and
                           the evaluated GiZ-score varies from 3.07216 to −1.07437 as represented in Figure 5. The
                           results reveal that the hotspots with higher values of 3.07216 exceed the critical value of 1.96
                           at a 95% confidence level, indicating clusters with high fire event values are surrounded by
                           high fire event values. The lower value of −1.07437 > −1.96 is within the 95% confidence
                           level, indicating no cold spots in the spatial distribution pattern.
tion pattern after the process of collected events in ArcGIS to include all overlapping
                                   events, and the evaluated GiZ-score varies from 3.07216 to −1.07437 as represented in Fig-
                                   ure 5. The results reveal that the hotspots with higher values of 3.07216 exceed the critical
                                   value of 1.96 at a 95% confidence level, indicating clusters with high fire event values are
 Fire 2021, 4, 38                  surrounded by high fire event values. The lower value of −1.07437 > −1.96 is within  11 ofthe
                                                                                                                              25
                                   95% confidence level, indicating no cold spots in the spatial distribution pattern.

                                   Figure 5. Hotspot (Getis-Ord Gi*) results.
                                   Figure 5.

                                   3.1.3. Inverse Distance Weighted (IDW) Interpolation Result
                                   3.1.3. Inverse Distance Weighted (IDW) Interpolation Result
                                         The IDW Interpolation techniques are extensively performed for the generation of
                                         The IDW Interpolation techniques are extensively performed for the generation of
                                   HA(GOG*) outputs on spatial dimensions [30,42]. The hotspot analysis results were
                                   HA(GOG*) outputs on spatial dimensions [30,42]. The hotspot analysis results were spa-
                                   spatially joined by a zonal statistics tool to the census ward map after IDW interpolation to
                                   tially joined by a zonal statistics tool to the census ward map after IDW interpolation to
                                   identify administrative areas for estimation and implications, as represented in Figure 6.
                                   identify administrative areas for estimation and implications, as represented in Figure 6.
                                   Fire disasters are not planned events and any fire incidence can be disastrous with heavy
                                   Fire disasters are not planned events and any fire incidence can be disastrous with heavy
Fire 2021, 4, x FOR PEER REVIEW    losses. Therefore, every fire event has to be considered with significant risk. Therefore,
                                                                                                                           12 of 27all
                                   losses. Therefore, every fire event has to be considered with significant risk. Therefore, all
                                   GiZ scores at 95% confidence level are categorized under the four fire risk types as listed in
                                   GiZ scores
                                   Table  3 andat 95% the
                                                reveal confidence
                                                           highest level  are categorized
                                                                    population    density inunder  the four
                                                                                             the hotspot    fire risk types as listed
                                                                                                         zones.
                                   in Table 3 and reveal the highest population density in the hotspot zones.

                                               IDWInterpolation
                                   Figure6.6.IDW
                                  Figure            Interpolationofofhotspot
                                                                      hotspotanalysis
                                                                              analysis(Getis-Ord
                                                                                       (Getis-OrdGi*)
                                                                                                  Gi*)joined
                                                                                                        joinedtotothe
                                                                                                                    thecensus
                                                                                                                        censusward
                                                                                                                               wardmap.
                                                                                                                                    map.

                                  Table 3. Fire risk zone classification for hotspot analysis (Getis-Ord Gi*) of census wards.

                                                                                                              Ranking
                                                                                                 Population
                                                                 Number of Percentage Percentage              Based on
                                     Z-Score          Type                                       Density per
                                                                  Wards       Area    Population             Population
                                                                                                    km2
Fire 2021, 4, 38                                                                                                                 12 of 25

                       Table 3. Fire risk zone classification for hotspot analysis (Getis-Ord Gi*) of census wards.

                                                                                                                      Ranking Based
                                                                                    Percentage     Population
       Z-Score        Type         Number of Wards        Percentage Area                                             on Population
                                                                                    Population   Density per km2
                                                                                                                         Density
       >1.96        Very High              17                     5                     10           25,526                 1
    1.96 to 0.65      High                 43                    19                     28           20,313                 2
   0.65 to −0.65     Medium                34                    52                     29            7655                  4
   −0.65 to −1.96     Low                  44                    24                     33           18,857                 3

                                   3.1.4. Built-Up Area Estimation from LULC
                                        The Landsat Satellite images from the USGS Earth Explorer website were classified
                                   through the maximum likelihood supervised classification tool in ArcGIS 10.3 to assess the
                                   urban built environment of 2011 and 2020 to then estimate the significant fire risk areas.
                                   Figure 7 represents the built-up areas of the city with structure fires from 2011 to 2020,
                                   comprising 52% in 2011 and increasing to 73% in 2020, which is an increase of 21%. The
                                   accuracy assessment of both the LULC maps has been performed using the ground truth
Fire 2021, 4, x FOR PEER REVIEW    data marked in Figures A2 and A1 and as per the findings listed in Tables A1 and 13A2.ofThe
                                                                                                                            27
                                   overall accuracy for both years is 91%, and the Kappa coefficient is 85% in 2011 and 86% in
                                   2020, satisfying the 85% limit for minimum accuracy [74].

                                              Built-upareas
                                   Figure7.7.Built-up
                                  Figure               areasfrom
                                                              from2011
                                                                   2011toto2020.
                                                                            2020.

                                        Thequantification
                                       The   quantificationofofthe
                                                                 thebuilt
                                                                     builtenvironment
                                                                            environmentwithwithclassified
                                                                                                classifiedfire
                                                                                                            firetypes
                                                                                                                 typesisisperformed,
                                                                                                                            performed,
                                   and the results are listed in Table  4. The spatial distribution for visualization    is represented
                                  and the results are listed in Table 4. The spatial distribution for visualization is repre-
                                   in Figure
                                  sented      8, which
                                         in Figure      reveals
                                                    8, which      that the
                                                              reveals  thathighest  percentage
                                                                             the highest         of actual
                                                                                         percentage          built-up
                                                                                                      of actual         areas
                                                                                                                 built-up       is in
                                                                                                                             areas  is the
                                                                                                                                       in
                                   Medium    category   with  46%,  the  highest  built-up  density percentage     is in  high
                                  the Medium category with 46%, the highest built-up density percentage is in high fire risk     fire risk
                                   category with 91%, revealing the highest development in the built environment and the
                                  category with 91%, revealing the highest development in the built environment and the
                                  highest population density in very high fire risk category, while the lowest are in the low
                                  category, indicating the impact of urbanization.
Fire 2021, 4, 38                                                                                                                 13 of 25

                                    highest population density in very high fire risk category, while the lowest are in the low
                                    category, indicating the impact of urbanization.

                                        Table 4. Estimation of fire risk zones with significant z-scores.

                                                  Actual                                          Population
                                                                       Built-Up Density                             Ranking Based on
      Z-Score           Type                   Built-Up Area                                   Density per km2 of
                                                                         Percentage                                 Population Density
                                                Percentage                                       Built-Up Area
       >1.96            Very High                     7                       91                     27,994                 1
    1.96 to 0.65          High                       22                       86                     23,659                 2
   0.65 to −0.65         Medium                      42                       60                     12,750                 4
  −0.65
 Fire 2021, −1.96
         to 4,            Low
               x FOR PEER REVIEW                     29                       90                     20,904                 3    14 of 27
                               Total                                          73                     18,508

                                    Figure8.8.Built-up
                                    Figure    Built-upareas
                                                       areaswith
                                                            withstructure
                                                                 structurefire
                                                                           firerisk
                                                                                riskzones.
                                                                                     zones.

                                       Table 4. Estimation
                                           Table  5 has theofclassified
                                                              fire risk zones with significant
                                                                          structures           z-scores.
                                                                                      as per the  NBCI, representing the percentage of
                                    fires to understand the human activity from occupancy fires. The hotspot area with a very
                                                                      Actual                                           Ranking
                                    high-risk zone in the central part of the cityBuilt-Up
                                                                                   has a maximum     Population
                                                                                                        of 39% fires in mercantile
                                                                     Built-Up                                          Based on
                                    occupancy,
                                         Z-Score35% in residential,
                                                        Type        12% in industrial, and 8% in
                                                                                  Density           the business
                                                                                                 Density   per kmoccupancy.
                                                                                                                  2          While
                                                                       Area                                           Population
                                    other risk zones have maximum fires in residential    class following  with
                                                                                 Percentage of Built-Up Area    mercantile class of
                                    structures.                     Percentage                                          Density
                                           >1.96      Very High          7             91              27,994              1
                                       1.96 to 0.65      High           22             86              23,659              2
                                       0.65 to −0.65   Medium           42             60              12,750              4
                                      −0.65 to −1.96     Low            29             90              20,904              3
                                                       Total                           73              18,508

                                             Table 5 has the classified structures as per the NBCI, representing the percentage of
                                       fires to understand the human activity from occupancy fires. The hotspot area with a very
                                       high-risk zone in the central part of the city has a maximum of 39% fires in mercantile
                                       occupancy, 35% in residential, 12% in industrial, and 8% in the business occupancy. While
Fire 2021, 4, x FOR PEER REVIEW                                                                                                        15 of 27
Fire 2021, 4, 38                                                                                                                         14 of 25

                                  Table 5. Percentage of fires based on occupancy types in classified fire risk zones.
                                  Table 5. Percentage
                                  Occupancy    Type of fires
                                                         Verybased
                                                               Highon occupancy types in classified
                                                                              High                  fire risk zones.
                                                                                                  Medium                          Low
                                     Residential
                                              Occupancy Type 35             Very43High       High 59 Medium                        53Low
                                    Educational               1                   1                    3                           2
                                                 Residential                    35             43              59                     53
                                    InstitutionalEducational 0                   11             1      1        3                  3 2
                                     AssemblyInstitutional 0                     03             1      3        1                  5 3
                                      Business Assembly 8                        05             3      3        3                  3 5
                                     Mercantile   Business   39                 8
                                                                                34              5     30        3                  27 3
                                                 Mercantile                     39             34              30                     27
                                     Industrial Industrial 12                   11
                                                                                12             11
                                                                                                       1        1
                                                                                                                                   3 3
                                       Storage Storage        5                  52             2      1        1                  3 3

                                  3.1.5.
                                   3.1.5.Predictive
                                          PredictiveProbable
                                                      ProbableFire FireRisk
                                                                        RiskEvaluation
                                                                              EvaluationResults
                                                                                             Results
                                        IDW    interpolation     techniques     are   extensively
                                         IDW interpolation techniques are extensively performed       performed      forgeneration
                                                                                                               for the    the generation      of
                                                                                                                                     of hotspot
                                  hotspot   analysis  outputs    on  spatial  dimensions     [30,42].   Figure  9 represents
                                   analysis outputs on spatial dimensions [30,42]. Figure 9 represents the predictive continu-  the predictive
                                  continuous
                                   ous smoothsmooth
                                                 surfacessurfaces    classified
                                                            classified  into fiveinto  five different
                                                                                   different            classeson
                                                                                              classes based      based   on the quantile
                                                                                                                   the quantile            clas-
                                                                                                                                  classification
                                  sification  method    at  the  extreme    limits  considering     the  raising  population
                                   method at the extreme limits considering the raising population due to rapid urbaniza-        due  to  rapid
                                  urbanization
                                   tion with thewith     the predictive
                                                   predictive     decadal decadal     population
                                                                             population     growth growth
                                                                                                      rate for rate
                                                                                                                2031foras 2031
                                                                                                                           21.2%asand
                                                                                                                                    21.2%
                                                                                                                                        2041and
                                                                                                                                              as
                                  2041   as 20.7%  [55]. The   very   high  fire risk  zone  is represented     in  red  color
                                   20.7% [55]. The very high fire risk zone is represented in red color with high values. The   with high   val-
                                  ues. Therepresented
                                   results   results represented     the part
                                                           the central    central   partcity
                                                                                of the   of the  city extending
                                                                                             extending     towardstowards
                                                                                                                      the lowertheeastern
                                                                                                                                   lower east-
                                                                                                                                            part
                                  ern  part  under  predictive    very   high  fire risk  covering   19.20%    area
                                   under predictive very high fire risk covering 19.20% area of the city as shown in of the  city as shown
                                                                                                                                        Tablein6,
                                  Table
                                   and the6, higher
                                             and thethree
                                                      higher    three
                                                            classes    classes
                                                                     cover       cover
                                                                             58.69%   of 58.69%
                                                                                         the city of   theindicating
                                                                                                   area,    city area,proactive
                                                                                                                        indicating   proactive
                                                                                                                                   planning   by
                                  planning    by the
                                   the resource      resource
                                                  allocation   ofallocation   of fire
                                                                  fire services        services
                                                                                  for the  futurefor  the future decades.
                                                                                                   decades.

                                  Figure
                                   Figure9.9.Predictive
                                              Predictiveprobable
                                                         probablefire
                                                                  firerisk
                                                                       riskzones
                                                                            zonesof
                                                                                 ofthe
                                                                                    thecity.
                                                                                        city.
Fire 2021, 4, 38                                                                                                                                       15 of 25

                                                   Table 6. Predictive probable fire risk zones.

                                                                                         Percentage               Population            Ranking Based
                                              Number of             Percentage
      Z-Score              Type                                                          Population             Density for 2031        on Population
                                               Wards                   Area
                                                                                            2031                   per km2                 Density
      >1.96             Very High                34                      15                     21                  22,350                         1
   1.96 to 0.65           High                   34                      20                     22                  18,258                         3
  0.65 to −0.65          Medium                  35                      47                     30                  10,138                         4
  −0.65 to −1.96          Low                    35                      18                     26                  23,726                         2

                                       3.2. Temporal Analysis
                                             Fire incidences and the population growth across the study period for the hottest
                                       month are evaluated statistically and the output is listed in Table 7 revealing the highest
                                       fire incidence frequency in 2019 with the highest Fire Index, z-score, and probability values,
                                       while least is in the years 2013 and 2020. The urban activities were restricted in 2020 due to
                                       the COVID-19 pandemic lockdown, resulting in a reduced fire incidence frequency. The
                                       population growth has the rising trend as per the UN population projection in lacks [57]
                                       and the ratio of fire incidences is revealed to be the highest in 2019 and lowest in 2020,
                                       as shown in Figure 10. The output reveals the impact of urban and human activities on
                                       fire incidences in a rising pattern during the normal conditions, but during the pandemic,
                                       the ratio lowers down to the least throughout the decadal period, and furthermore, the
                                       trendline of ratio is in a declining pattern with R square value 0.0024.

                                       Table 7. Fire incidences and population matrices.

                                                           Fire Incidence Matrices                          Population Matrices
                                         Year                                                                                                          Ratio
                                                  Fire Index       Z-Score      Probability PopulationIndex         Z-Score          Probability
                                         2011           1.14        0.68          0.75               0.93            −1.54              0.06        2.59
                                         2012           0.93        −0.34         0.37               0.95            −1.21              0.11        2.08
                                         2013           0.70        −1.44         0.08               0.96            −0.88              0.19        1.54
                                         2014           0.88        −0.59         0.28               0.98            −0.54              0.29        1.90
                                         2015           1.04        0.17          0.57               0.99            −0.19              0.42        2.20
                                         2016           0.93        −0.34         0.37               1.01            0.16               0.56        1.95
                                         2017           1.23        1.10          0.86               1.02            0.52               0.70        2.53
                                         2018           1.07        0.34          0.63               1.04            0.88               0.81        2.17
                                         2019           1.39        1.86          0.97               1.06            1.22               0.89        2.77
     Fire 2021, 4, x FOR PEER REVIEW                                                                                                       17 of 27
                                         2020           0.70        −1.44         0.08               1.07            1.58               0.94        1.38

                                         90                                                                                          3.00
                                         80
                                                                                                                                   2.50
                                         70                                                                               R² = 0.0024
                                         60                                                                                          2.00
                                         50
                                                                                                                                     1.50
                                         40
                                         30                                                                                          1.00
                                         20
                                                                                                                                     0.50
                                         10
                                          0                                                                                          0.00
                                                2011     2012    2013    2014     2015   2016        2017   2018   2019   2020

                                                       Structure Fires        UN Population             Ratio       Linear (Ratio)

                                       Figure 10. Yearly fire incidences, UN population, and ratio.
                                       Figure 10. Yearly fire incidences, UN population, and ratio.
                                            Figure 11a depicts the waterfall chart of the evaluated z-score of the fire incidence
                                       pattern, as listed in Table 3, revealing the maximum increase in 2019 with a 1.86 z-score
                                       and decreasing in 2020 for a pandemic reason. Figure 11b depicts the evaluated propor-
                                       tion of the fire indexes reiterating the fact of maximum rise in 2019 with 39% above the
                                       mean value with the trend line of R square value of 0.00292 indicating a very slow but
                                       rising pattern.
0                                                                                            0.00
                                              2011     2012    2013     2014     2015     2016     2017     2018     2019     2020

                                                     Structure Fires         UN Population             Ratio          Linear (Ratio)

 Fire 2021, 4, 38                                                                                                                               16 of 25
                                    Figure 10. Yearly fire incidences, UN population, and ratio.

                                         Figure 11a depicts the waterfall chart of the evaluated z-score of the fire incidence
                                   pattern,  as listed
                                        Figure           in Table
                                                  11a depicts    the3,waterfall
                                                                        revealingchart
                                                                                    the maximum      increase
                                                                                         of the evaluated       in 2019
                                                                                                             z-score   of with a 1.86
                                                                                                                          the fire     z-score
                                                                                                                                   incidence
                                   and decreasing
                                   pattern,  as listedinin2020
                                                            Tablefor
                                                                   3, arevealing
                                                                         pandemic    reason.
                                                                                   the maximumFigure   11b depicts
                                                                                                    increase         thewith
                                                                                                               in 2019    evaluated   propor-
                                                                                                                              a 1.86 z-score
                                   tiondecreasing
                                   and  of the fire inindexes
                                                         2020 forreiterating
                                                                   a pandemic  thereason.
                                                                                    fact of Figure
                                                                                            maximum      rise in 2019
                                                                                                   11b depicts          with 39%proportion
                                                                                                                  the evaluated     above the
                                   of the fire
                                   mean        indexes
                                           value          reiterating
                                                   with the             the of
                                                               trend line   factR of maximum
                                                                                  square   valuerise  in 2019 indicating
                                                                                                  of 0.00292    with 39% above
                                                                                                                            a verythe   mean
                                                                                                                                     slow   but
                                   value  with   the
                                   rising pattern.   trend    line of  R  square   value  of 0.00292   indicating   a very  slow   but  rising
                                   pattern.

Fire 2021, 4, x FOR PEER REVIEW     (a)                                                                        (b)                            18 of 27

                    Figure11.
                    Figure 11. Temporal
                               Temporalfire
                                        fireincidence
                                             incidencepattern:
                                                       pattern:(a)
                                                                (a)Z-score
                                                                   Z-scorewaterfall
                                                                           waterfallchart;
                                                                                     chart;(b)
                                                                                            (b)proportional
                                                                                                proportionalfire
                                                                                                             fireindex.
                                                                                                                  index.

                                           Figurehave
                                          Figure
                                  frequencies        12 depicts
                                                    12   depicts    thetemporal
                                                                  the
                                                         no relation    temporal
                                                                        with          dataof
                                                                                    data
                                                                               the hour     ofofthe
                                                                                                  weekdays
                                                                                                 weekdays      andhourly
                                                                                                              and
                                                                                                    day at which     hourly
                                                                                                                    they      fireincidences.
                                                                                                                            fire
                                                                                                                          occur.    incidences.
                                                                                                                                   The   DW value   The
                                                                                                                                                  The
                                    weekdays       dataset   (as  in  Figure    12a)  has   the   maximum      fire frequencies
                                  ranges from 0 to 4 and the 0 to 2 value indicates a positive correlation and from 2 to 4at
                                   weekdays       dataset   (as  in  Figure    12a)  has   the   maximum      fire frequencies      on
                                                                                                                                   on   Thursday
                                                                                                                                       Thursday       at
                                   17%
                                    17% and
                                  indicates     aaminimum
                                           andnegative
                                                    minimum     on
                                                                 onMonday
                                                           relation.   The DWatatvalue
                                                                      Monday        12%,    then
                                                                                             thenthe
                                                                                      12%,nearer      to weekends.
                                                                                                     the  weekends.
                                                                                                         zero         The   hourly
                                                                                                                       Thestrong
                                                                                                               indicates     hourly   dataset   (as
                                                                                                                                                 (asin
                                                                                                                                       datasetauto-
                                                                                                                                    positive          in
                                   Figure
                                    Figure12b)
                                  correlation 12b) has
                                                 and hasthe maximum
                                                          the
                                                       nearer  maximum    firefire
                                                                to 2 indicates  events
                                                                                   eventsduring
                                                                                             duringthe hot
                                                                                   no autocorrelation.  theafternoon
                                                                                                            hot    DWhours
                                                                                                              Theafternoon     from
                                                                                                                              hours
                                                                                                                        statistic     12:00
                                                                                                                                       from
                                                                                                                                    test     to  17:00
                                                                                                                                              12:00
                                                                                                                                         evaluated    to
                                   with
                                    17:00
                                  the     awith
                                       valuemaximum        of 7%
                                                of admaximum
                                                      = 0.35       indicating
                                                                    of 7%
                                                              (nearer            theatimpact
                                                                         to indicating
                                                                             zero)               of
Fire 2021, 4, 38                                                                                                                      17 of 25

                                      to 2 indicates no autocorrelation. The DW statistic test evaluated the value of d = 0.35
                                      (nearer to zero) at p-value < 0.05, which rejects the null hypothesis indicating the positive
                                      autocorrelation between the hour of the day and fire frequencies.

                                      3.3. Cause-Wise Analysis to Understand Urban and Human Activities
                                            Table 8 represents the causes of the fire in the fire risk zones across the study period,
                                      classified in five types as gas cylinder leakage (14%), electric short circuits (31%), adjacent
                                      garbage fire (2%), other causes (6%) including lamps, cooking, mechanical failure, and
                                      electric press, and highest cause being unknown with 48% of total structure fires. All fire
                                      risk zones have a maximum of unknown causes followed by electric short circuits and gas
                                      cylinder leakages. The electric short circuit cause is generally due to increased load on
                                      electricity causing voltage fluctuation due to the operation of electrical cooling devices for
                                      comforting the confined spaces during the scorching hot May month, indicating the impact
                                      of climatic conditions.

                                      Table 8. Cause-wise percetage of structure fires in the fire risk zones.

                                          Type        Gas Cylinder Leakage        Electric Short Circuit   Garbage Fire   Unknown    Other
                                        Very High               13                         33                   2           41        11
                                          High                  10                         30                   2           54        3
                                         Medium                 16                         28                   2           51        4
                                          Low                   17                         31                   2           42        8
                                          Total                 14                         31                   2           48         6

                                           Figure 13 depicts the yearly cause-wise fires with the trendlines of the unknown
                                      and electric short circuit causes showing a rise with an R2 value of 0.083 and 0.0333,
                                      respectively, indicating a gradual rise, and the gas leakage cause has a declining trendline
    Fire 2021, 4, x FOR PEER REVIEW
                                      with an R2 value of 0.0332. The unknown cause has to be studied in depth 19  forofidentifying
                                                                                                                         27

                                      the actual causes for intervention and implications.

                                      Figure     Cause-wise
                                             13.Cause-wise
                                      Figure 13.             yearly
                                                           yearly    structure
                                                                  structure fires.fires.

                                      4. Discussion
                                           The geospatial analyses approach connects the data to a spatial visualization map,
                                      integrating location data with all types of statistical and descriptive information, provid-
                                      ing a foundation for mapping, and an analysis for urban planning, particularly for fire
                                      service provision. The quantification of the built-up areas and populations under risk is
Fire 2021, 4, 38                                                                                           18 of 25

                   4. Discussion
                         The geospatial analyses approach connects the data to a spatial visualization map,
                   integrating location data with all types of statistical and descriptive information, providing
                   a foundation for mapping, and an analysis for urban planning, particularly for fire service
                   provision. The quantification of the built-up areas and populations under risk is essential
                   for efficient and effective mitigation. The historical fire incidence data of a decadal period
                   for the hottest month of May with maximum fire frequencies are analyzed with the spatial
                   analyst and statistics tools to identify the spatial variation of fire risk zones across the
                   study area with an increasing population under persistent threat. The fire risk zone
                   hotspot analysis through the KDE and HA(GOG*) is performed, compared, and estimated
                   statistically.

                   4.1. Result Overview
                         The detection by KDE identifies one hotspot area through the entire city area, in the
                   central core part of the city under a very high fire risk zone revealing the highest population
                   under persistent threat. The high population size indicates the rapid growth of urbanization
                   due to the prominent commercial and administrative activities associated with increased
                   urban and human activities, resulting in the development of high rises and compact
                   development that challenges the management of fire services. The KDE is a nonparametric
                   technique identifying the probability density estimate of event hotspots, revealing the
                   concentration of the fire events across the study period to identify the influenced areas.
                         The HA(GOG*) technique evaluates the fire risk zones statistically for the same data set
                   and helps to understand results with statistically significant z-scores in the study. The very
                   high fire risk class is the hotspot area above the critical value of 1.96 at a 95% confidence
                   level, identifying three hotspot areas within the single identified hotspot area of the KDE
                   analysis. The hotspot area comprises a total of 17 wards out of 34 wards of the KDE over
                   an area of 5% out of 9% of the KDE, with a population density of 25,526 persons per km2
                   out of 29,860 persons per km2 . The high and medium fire risk classes have wide variations
                   influencing the varied population densities under respective threats. The results from
                   both techniques have wide variation, and the results of HA(GOG*) are more accurate with
                   statistical analysis than the KDE technique, helping decision makers to optimally and
                   sustainably utilize resources.
                         The built-up areas under the significant fire risk zones are estimated to quantify
                   the actual area and population size under persistent fire threats. The built-up density
                   reveals the development pattern with the influenced population density. The very high
                   fire risk zone has the highest population density at 27,994 persons per km2 , whereas, at
                   the ward level, the population density is 25,526 persons per km2 , indicating the compact
                   development. Meanwhile, the low fire risk zone has the second-highest built-up density,
                   revealing the compactness but comparatively with less population density of the third rank.
                         Structure fires are most frequent in mercantile occupancy structures followed by resi-
                   dential and industrial within the identified hotspot areas, while residential structure fires
                   are prominent in other fire risk areas followed with the mercantile class. The population
                   density indicates that human activities contribute to the fire incidences, integrating the
                   urbanization trend from the cause-wise analysis with the most common cause being the
                   unknown cause, followed by electric short circuits and gas cylinder leakages. The temporal
                   data analysis reveals that the maximum fire incidences occur on Thursday afternoons
                   during the hot hours rather than the early morning and sleeping night hours. The re-
                   sult indicates the impact of human activities of daytime and hot climatic conditions with
                   increased electrical load for cooling the confined spaces of structures.

                   4.2. Planning Implications
                        The geospatial analysis approaches are significantly useful for enhancing the efficiency
                   of the fundamental fire services. The outcomes are helpful to the decision makers for fire
                   disaster management purposes, both in terms of risk estimation [16,80,81] and impacts on
You can also read