Habitat-specific densities of urban brushtail possums
←
→
Page content transcription
If your browser does not render page correctly, please read the page content below
Patterson
New Zealand
 et al.:
 Journal
 Urbanofpossum
 Ecologydensity
 (2021)estimates
 45(2): 3450 © 2021 New Zealand Ecological Society. 1

 RESEARCH

Habitat-specific densities of urban brushtail possums

Charlotte R. Patterson1* , Philip J. Seddon1 , Deborah J. Wilson2 and Yolanda van Heezik1
1
 Department of Zoology, University of Otago, PO Box 56, Dunedin 9016, New Zealand
2
 Manaaki Whenua – Landcare Research, Private Bag 1930, Dunedin 9054, New Zealand
*Author for correspondence (Email: crpattrsn@gmail.com)

Published online: 24 July 2021

 Abstract: Invasive mammalian pests threaten biodiversity globally across a diverse range of habitats. The
 unique combination of resource subsidies and disturbance in cities can provide favourable conditions for
 invasion. Recent interest in urban biodiversity enhancement has increased the demand for effective urban pest
 control, but efforts are often hampered by a lack of understanding of the ecology of urban invasive mammals.
 The Australian common brushtail possum (Trichosurus vulpecula) has invaded most New Zealand landscapes,
 including urban areas, and is a nationally significant pest species. Recent shifts in national pest control and
 conservation priorities demand an assessment of the capacity for urban areas to harbour possum populations.
 We estimated the density of possums across three representative habitat types within the city of Dunedin,
 New Zealand: an urban forest fragment and two residential areas of varying vegetation quality. Possums were
 live-trapped and camera-trapped over eight days at each site in late summer to early autumn. Spatially explicit
 capture-recapture methods were used to estimate density at each site, and “minimum number alive” estimates
 were also calculated. Our estimate suggests that the forest fragment supported possums at a density (3.1 ha−1)
 capable of inflicting harm on resident native wildlife, but this density was low compared with non-urban
 estimates in the same forest type, suggesting a possible influence of disturbance from human activity in and
 around the fragment. Few possums were caught at the two residential sites (0.1 ha−1 at each), and behavioural
 avoidance may have reduced capture success there. Our estimates confirm that urban areas are an important
 habitat for possums, and our study provides the first rigorous estimates of urban possum density, which can be
 incorporated into predictive modelling and other methods of control planning.
 Keywords: capture-recapture, density, invasive species, possum, Trichosurus vulpecula, urban ecology

Introduction Efforts to control invasive species in urban areas are therefore
 crucial for protecting and restoring important urban wildlife.
Urban areas are unique and challenging environments for However, research is needed to understand the behaviour and
wildlife, characterised by high levels of disturbance, habitat population processes of invasive species in cities (Gallo et al.
fragmentation and patchy resource distribution (Harper 2005; 2017; Russell & Stanley 2018), as it cannot be assumed that
Lowry et al. 2013). As a consequence, cities tend to support these processes will be consistent with those in other habitats.
wildlife communities that are less biodiverse and abundant The common brushtail possum (Trichosurus vulpecula;
than other habitats (Chace & Walsh 2006; Aronson et al. 2014). ‘possum’ herein), an arboreal marsupial of the family
Nevertheless, urban areas can sustain native biodiversity, Phalangeridae, is a significant pest species in New Zealand
including threatened species (Angold et al. 2006; Aronson et (Clout 2006). Introduced from Australia in the 1800s, possums
al. 2014; Gallo et al. 2017; Woolley et al. 2019), and urban are now present across most of the country (Cowan 2005).
biodiversity provides opportunities for people to experience and Possums are highly destructive folivores that have complex
connect with nature at a time when human-nature interactions impacts on trees in all New Zealand forest types (Payton
are declining (Dearborn & Kark 2010; Soga & Gaston 2016). 2000). They also prey on and compete with native birds and
The unique conditions of cities also favour traits common invertebrates (Sadlier 2000; Clout 2006). Possums occupy
to invasive species – namely, behavioural flexibility and a urban areas in Australia and New Zealand (Matthews et al. 2004;
tolerance of disturbance (Lowry et al. 2013). As such, species Adams et al. 2013; Eymann et al. 2013), and although possum
that thrive in cities are frequently invasive (McKinney 2006). densities have generally declined across their native range,
Artificial food sources and shelter enable some invasive possums can be abundant in Australian cities (Matthews et al.
species to exist at high densities in cities (McKinney 2006) 2004; Eymann et al. 2013; Carthew et al. 2015). Characteristics
where they impact native wildlife through predation and enabling this success include behavioural flexibility, which
competition (Chace & Walsh 2006; Shochat et al. 2010). allows possums to exploit novel resources, and a high tolerance

DOI: https://dx.doi.org/10.20418/nzjecol.45.27
2 New Zealand Journal of Ecology, Vol. 45, No. 2, 2021

of disturbance (Adams et al. 2014; Carthew et al. 2015). areas with greater than one third of the property comprised of
The use of novel den sites (buildings), and human-provided less structurally complex gardens dominated by lawns. Green
supplementary food resources (compost heaps, fruit trees), cover in Residential I totals about 70%, and in Residential II
are examples of this adaptive behaviour (Statham & Statham it ranges between 42% and 50% (Freeman & Buck 2003).
1997; Harper 2005; Carthew et al. 2015). The forest fragment site Jubilee Park (9 ha) is an amenity
 Population density is an important metric of possum area managed by the Dunedin City Council, situated close to
impact, as their interactions with, and impacts on native and the centre of the city (Fig. 1). The park is bordered by roads
non-native fauna tend to increase with density (Efford 2000; and residential housing, and is part of the Dunedin Town Belt, a
Duncan et al. 2011; Holland et al. 2013). Possum home range 200 ha green belt spanning the central suburbs. The vegetation
size, productivity, dispersal distance, and other population of Jubilee Park is a mix of regenerating native broadleaved
characteristics also change with density (Isaac & Johnson and fern species, particularly Pittosporum spp., Griselinia
2003; Whyte et al. 2013; Richardson et al. 2017). Possum littoralis and Fuchsia excorticata, which comprise the mid
density in New Zealand tends to be habitat-specific, reflecting and lower layers of undergrowth, along with an emergent
the availability of key resources, including food, den sites, and canopy of exotic tree species (Pinus spp. and Salix spp.).
tree cover (Efford 2000). Habitat-specific possum densities The last possum control implemented at Jubilee Park by the
across New Zealand have been estimated to range from < 1 Dunedin City Council was eight months prior to this study; the
ha−1 to > 20 ha−1 (Efford 2000; Rouco et al. 2013). However, park was subject to periodic control before then. Jubilee Park
there are no urban possum density estimates for New Zealand, was deemed representative of a typical New Zealand urban
despite the potential for possums to impact urban-based native forest fragment, as these often have a history of intermittent
biodiversity and increasing interest in urban mammalian pest possum control.
control (Russell et al. 2015). Urban possums appear to distribute At Maori Hill, the Residential I site (7 ha), and Wakari,
themselves according to food and den site availability, leading the Residential II site (7 ha), traps were placed in private
most to occupy home ranges that intersect forest fragments backyards (Fig. 1). The suburb of Maori Hill has a low
(Statham & Statham 1997; Harper 2005; Harper et al. 2008; housing density and the typical section size is moderate to
Adams et al. 2014). However, possums are also capable large (700–1000 m2). Many houses have fruiting trees and
of living within vegetated urban residential areas, entirely open or closed compost heaps. The average distance from traps
independent of urban forest fragments (Adams et al. 2014). to the nearest point of the Dunedin Town Belt, calculated in
Residential areas and urban forest fragments therefore both QGIS v 3.6.2 (QGIS Development Team 2019), was 231 m
represent habitat for possums. (SD 75 m). Close proximity to a forested area is positively
 Here, we estimate the density of possums across three associated with possum occupancy, and most likely to be a
urban habitat types in the city of Dunedin, New Zealand, using feature of Residential I habitat (Adams et al. 2013). At the
spatially explicit capture-recapture methods. We aimed to Wakari site, gardens were of a moderate size (500–800 m2).
explore distinct habitat types that represent the heterogeneity Some backyards at both residential sites had compost heaps,
of conditions and resources in cities. These habitat types were vegetable gardens and fruit trees.
an urban forest fragment and two residential areas, one with
high and one with moderate vegetation cover and structural Trapping protocol
complexity. We expected that possums would be present in Trapping was conducted under University of Otago Animal
each habitat at low to moderate densities that reflected the Ethics Committee approval AUP-18-201, and with permission
availability of foliage, their primary food item, although it was from the Dunedin City Council and affected property owners.
also hypothesised that human disturbance such as pedestrians The trapping grid at each site comprised Grieve Wrought
and vehicles might play a role in limiting densities at each site. Iron wire live-capture cage traps, each with a folding door
This research was conducted with the aim of gathering baseline triggered by a pendulum hook, placed at roughly 30 m spacing
data of urban possums in New Zealand in order to effectively (Efford 2004; Efford & Cowan 2004; Nugent et al. 2011). At
plan and achieve future possum control and biodiversity Jubilee Park traps (n = 70) were placed according to locations
outcomes. These data would also improve predictive possum determined using a Garmin GPS unit (Fig. 1). At Maori Hill
models, which to date have made the unsupported assumption (n = 64) and Wakari (n = 65) a trapping grid was constructed
that possum density in urban areas is zero (Warburton et al. based on property locations aligning with a grid created in
2009; Shepherd et al. 2018; Lustig et al. 2019). Google Earth Pro (https://www.google.com/earth/). The final
 grid at these residential sites avoided roads and other obstacles
 and was in part determined by access permission from property
Methods owners (Fig. 1).
 Each site was trapped for eight consecutive nights.
Study sites Possums are likely to visit all parts of their home range over
Capture-recapture trapping took place between 1 February and such a period, increasing the likelihood of detection (Adams
15 April 2019 across three sites within the city of Dunedin, et al. 2013). Traps were baited with cinnamon-coated apple
New Zealand (45°52′S, 170°30′E) (Fig. 1). The three sites and lured with a 50:50 flour and icing sugar blaze extending
represented three urban habitat types, as defined by a Dunedin 30 cm from the mouth of the trap. Traps were checked each
habitat map shapefile (Freeman & Buck 2003; Mathieu et morning and re-baited when the bait had been removed by
al. 2007): (1) “Forest fragment”, a closed-canopy native possums or other animals, or every three days. Captured
and exotic tree stand surrounded by an urban landscape, (2) possums were photographed and then anaesthetised with 5%
“Residential I”, residential areas with greater than one third isoflurane gas and 1.5% oxygen using a SHOOF Portable
of the property comprised of mature, structurally complex Anaesthetic Machine (SHOOF International). Individuals were
gardens containing an assortment of lawns, hedges, shrubs, given two ear tags with unique identifier codes (National Band
and large established trees, and (3) “Residential II”, residential and Tag Co., Kentucky, USA, size 1005-3, style 893) before
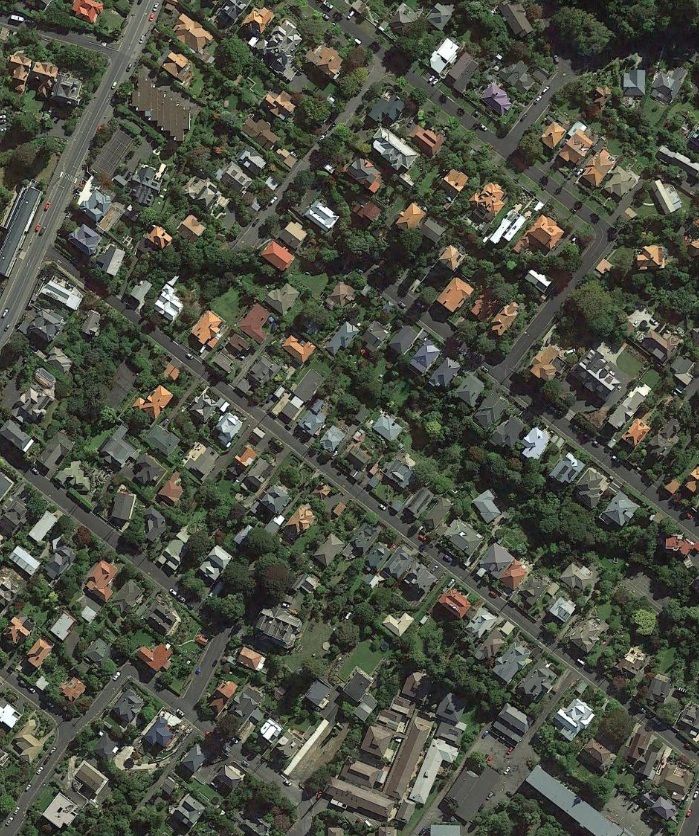
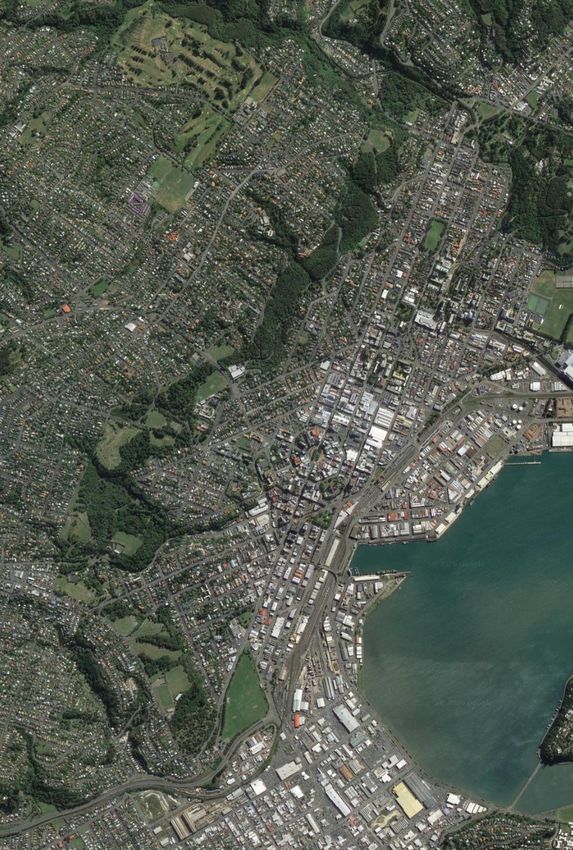
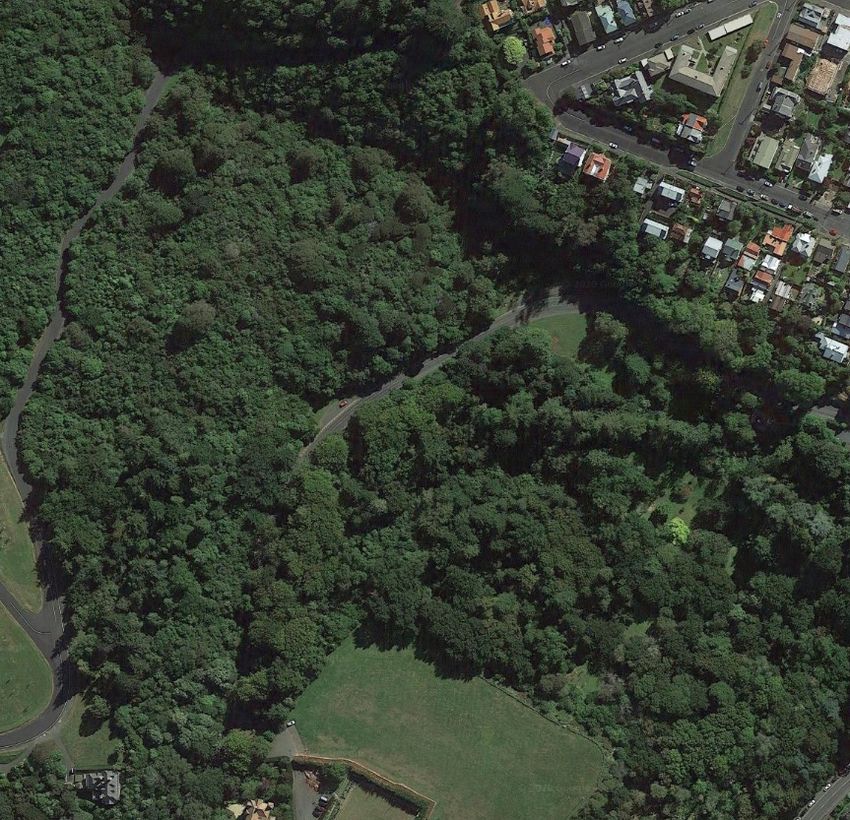
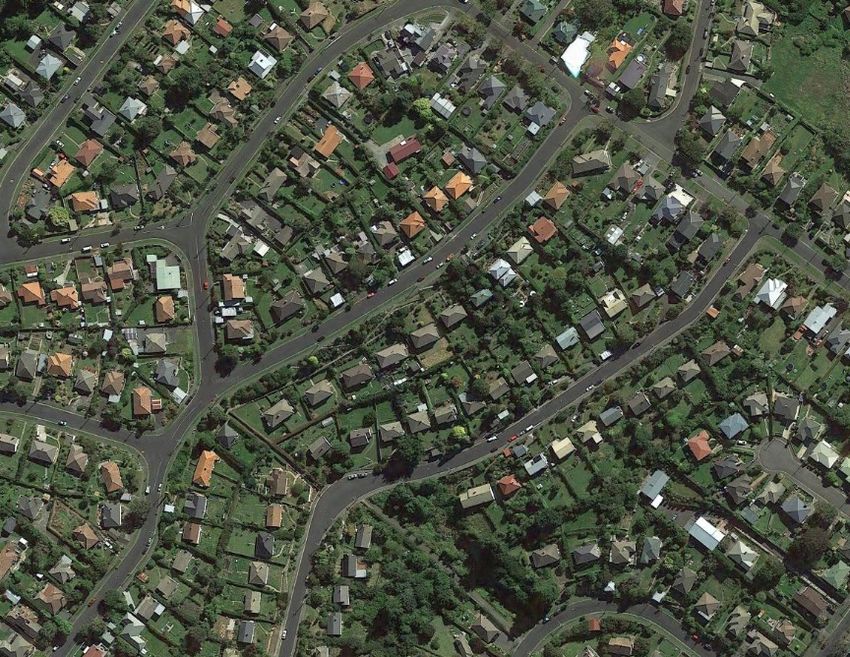
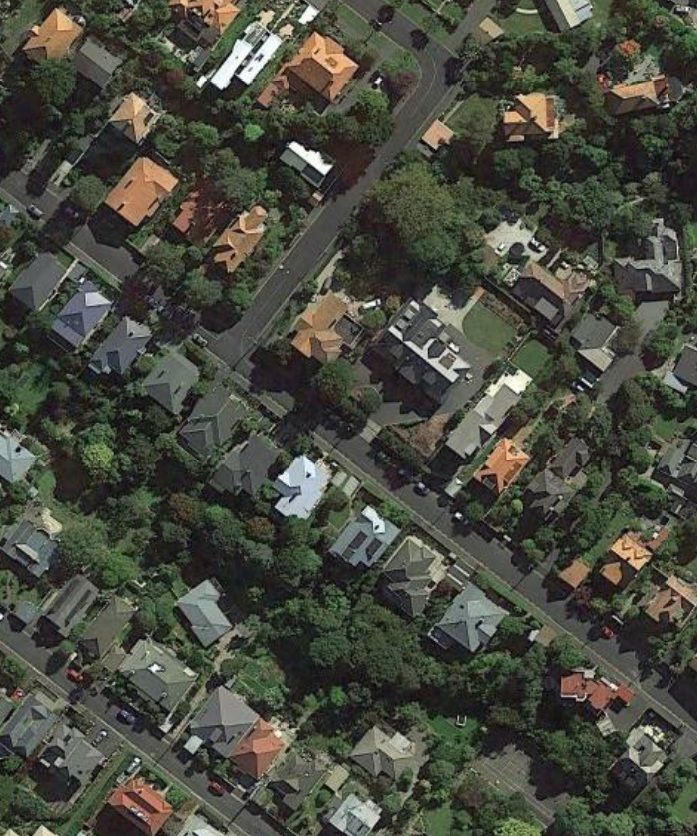
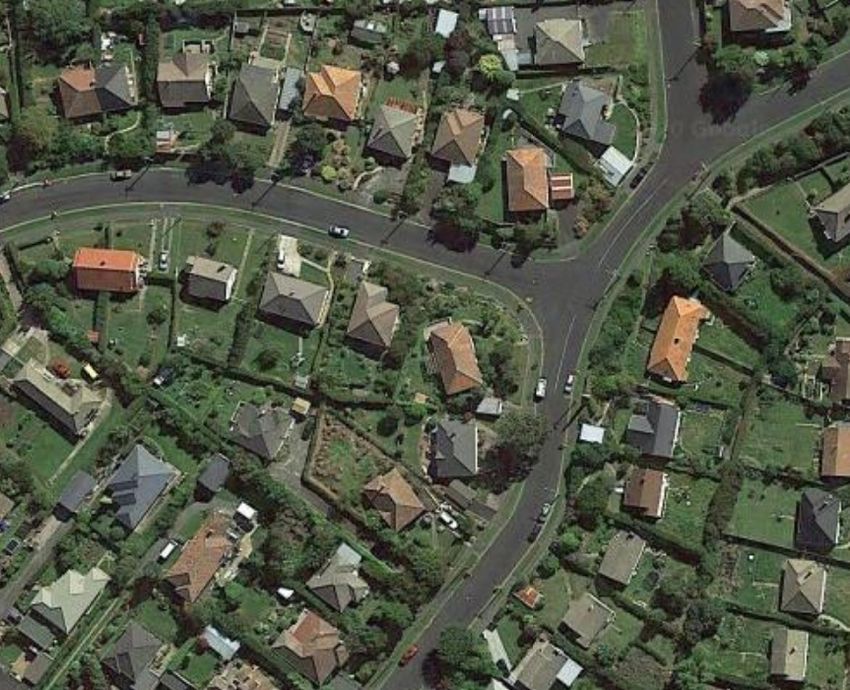
Patterson et al.: Urban possum density estimates 3

 (a) (f)

 WA

 MH

 Wakari
 n = 65
 (b)
 JP

(c) (d) (e)

 Jubilee Park Maori Hill
 n = 70 n = 64
Figure 1. The location of three trapping grids in the city of Dunedin, representing three urban habitat types, where capture-recapture of
possums took place. Traps were spaced c. 30 m apart, with locations determined by study area and access constraints. The three sites
were: (1) Wakari (WA), a residential area with properties dominated by lawns and small shrubs (a) (b); (2) Jubilee Park (JP), an urban
forest fragment (c); and (3) Maori Hill (MH), a residential area with well-vegetated properties dominated by trees and shrubs (d) (e). The
location of the grids in Dunedin is shown in (f).

being released near their capture location. On two occasions at fifth trap location, except where there were no appropriate
Jubilee Park possums escaped untagged, but re-sight by photo attachment surfaces. Cameras were placed 30–60 cm above
identification was deemed sufficient as a recapture method for the ground, 2–7 m from the trap, and were set to video 30 s
these individuals as both had unique scarring on their face of footage when motion sensors were activated, with 10 s
and ears that was visible on images. Recaptured animals were intervals between videos. Cameras were activated at 18:00
recorded and released; twice an individual had lost both ear each day and checked the following morning.
tags, but could be identified by unique physical traits such as
ear shape, colouration pattern and visible scarring. SECR analysis
 Due to low capture rates at Maori Hill and Wakari, camera The density of possums at the three sites was estimated via
traps were added for the last four and three nights at these likelihood-based spatially explicit capture-recapture (SECR;
sites respectively. Cameras (Bushnell Trophy Camera model Borchers & Efford 2008) with the secr package v. 4.3.0 (Efford
119836, brown; n = 12 at each site) were placed at every 2019) for R v. 3.5.2 (R Core Team 2018). Because there were
4 New Zealand Journal of Ecology, Vol. 45, No. 2, 2021

no recaptures in the cage traps at Maori Hill and Wakari, the Model selection
SECR model parameters were not identifiable when these We used the half-normal detection function to depict the
data were analysed independently. Instead, the Maori Hill probability of capture of an individual possum, following
and Wakari data were fitted to a multi-session model with the precedent from prior possum SECR analyses (Efford 2004;
Jubilee Park data. Each site’s population was assumed to be Rouco et al. 2013; Richardson et al. 2017). Several models with
closed (no births, deaths, immigration or emigration) during varying spatial detection parameter values were compared, to
the short trapping periods (Otis et al. 1978). SECR models represent possible alternative behaviours affecting the trapping
require a definition of the “area of integration”: the region process, including “trap-shy” or “trap-happy” behaviour
across which the activity of target animals can be centred, (Borchers & Efford 2008; Rouco et al. 2013). Variation was
and across which integrals in the likelihood function are applied only to the parameter g0 – the one-night probability
approximated by summations. This means non-habitat can be of capture of an individual in a trap at the centre of its home
excluded in fragmented landscapes, minimising the potential range. The parameter , which determines the spatial decay
for underestimation of habitat-specific densities (Borchers & of the half-normal home range kernel, was kept constant. The
Efford 2008). The area of integration must be large enough multi-session model assumed that these detection parameters
to encompass all individuals with non-negligible detection were the same for all sites, whereas density was allowed to
probabilities (Efford 2004; Royle & Young 2008). Because vary. The models considered were:
Jubilee Park was located within a heterogeneous urban
 (1) a null model, where g0 was constant;
landscape, it was necessary to specify areas of forest fragment
 (2) model b which simulated a permanent step-change
habitat and non-habitat by creating a “habitat mask” object in
 behavioural response to capture, where animals that had
QGIS using the National Landcover Database v. 4.1 shapefile
 been captured had an altered detection probability for the
(https://lris.scinfo.org.nz/layer/48423-lcdb-v41-land-cover-
 remainder of the trapping period (Otis et al. 1978; Borchers
database-version41-mainland-new-zealand/) (Hooker et al.
 & Efford 2008);
2015; Braczkowski et al. 2016). A buffer width of 300 m was
 (3) model bk, a permanent behavioural response to capture
chosen based on pre and post model-fitting assessment (secr
 that was specific to trap location;
functions “suggest.buffer” and “mask.check”), and resulted
 (4) model B, a transient behavioural response to capture that
in a total mask area of 29 ha (Fig. 2). A 300 m buffer was also
 affected only the next trapping occasion;
used for the trap locations at Maori Hill (mask area = 64 ha)
 (5) model Bk, a location-specific transient behavioural response
and Wakari (mask area = 64 ha).
 to capture.

 Trap Locations
 300m Buffer
 Mask Area
 Exotic / Indigenous Forest
 Built-up Area (Settlement)
 Urban Parkland / Open Space

Figure 2. The polygon shapefile created in QGIS describing the habitat types of Jubilee Park, an urban forest fragment in the centre of
Dunedin, and the surrounding area. A 300 m buffer around the trap locations was used to delineate a habitat mask, within which computation
of density was undertaken via Spatially Explicit Capture-Recapture (SECR). This habitat mask excluded non-forest-fragment habitat to
reduce the risk of underestimating habitat-specific density at this site.
Patterson et al.: Urban possum density estimates 5

 Model fitting was carried out by maximising the likelihood, were classified as having an uninformative parameter (Burnham
assuming a multi-catch estimator which has been shown to & Anderson 2002; Arnold 2010). Models with uninformative
be appropriate for single-catch traps when trap saturation is parameters were not considered further, and the possum density
low (< 60% each night) (Distiller & Borchers 2015). Models (± SE) at Jubilee Park derived by model-averaging the null
were compared via Akaike’s Corrected Information Criterion and b models was 3.1 ha-1 (± 0.6).
(AICc) (Hurvich & Tsai 1989). However, if a model included Only two individual possums were identified at Maori
an additional parameter, and increased AICc by about 2, the Hill, and five at Wakari. One individual at Maori Hill was re-
model was classified as having an “uninformative parameter” sighted by camera trap on two separate nights. At Wakari, one
(Burnham & Anderson 2002; Arnold 2010) and was not individual was re-sighted by camera trap on two consecutive
considered further. Possum density was calculated by model- nights, while another was seen by camera trap at two different
averaging (Burnham & Anderson 2002) the estimated densities traps on the same night. Model-averaged possum densities
from the remaining models. (± SE) were 0.1 ha−1 (± 0.1) at Maori Hill and 0.1 ha−1
 (± 0.1) at Wakari.
Minimum density based on minimum number alive Due to the final trap spacing, the ETA was smaller at
To provide another type of estimate for comparison that Maori Hill (19.4 ha) than at Wakari (23.4 ha) and Jubilee Park
incorporated data from the camera traps at Maori Hill and (24.4 ha). Estimated minimum possum density was 2.1 ha−1
Wakari, live-capture and camera trap information were at Jubilee Park, 0.1 ha−1 at Maori Hill and 0.2 ha−1 at Wakari
combined to calculate a “minimum number alive” (MNA) (Table 1).
estimate for possums at each site (Pickett et al. 2005). At Jubilee
Park only live-capture data were used. We considered effective
trapping areas (ETA) for each site to include the trapped Discussion
area plus a boundary strip equivalent to home range radius
(Dice 1938; Wilson et al. 2007). Minimum convex polygons The estimated density of possums varied across three urban sites,
were calculated around the trap locations in QGIS. Because highlighting the importance of fine-scale habitat differentiation
accurate movement patterns were unlikely to be revealed by in determining the relative densities of geographically-close
the few captured individuals at the Maori Hill and Wakari sites urban possum populations. The value we obtained at Jubilee
(Parmenter et al. 2003; Foster & Harmsen 2012), we based the Park using MNA as opposed to SECR was lower, as expected,
boundary strip width on mean (± SE) home range of possums since undetected individuals are not accounted for in MNA.
(3.54 ± 0.45 ha) estimated from GPS tracking in residential The SECR and MNA values were similar at the residential
Dunedin gardens in 2010–2011 (Adams et al. 2014). Assuming sites, due to the very low number of captures and recaptures
a circular home range area, the buffer width of the average there. As predicted, the forest fragment supported possums
home range radius was added to the trapping area to create the at a moderate density, although the density was lower than
final ETA for each site (Foster & Harmsen 2012). Minimum expected for a mix of native broadleaved and exotic species.
density was then calculated as the MNA divided by the ETA. Previous studies in exotic (oak Quercus robur and sycamore
 Acer pseudoplatanus) and mixed broadleaved forests estimated
 densities of 7 and 10 individuals ha−1, respectively (Nugent et
Results al. 2010; Whyte et al. 2013). Our SECR estimate of 3.1 ha−1
 is more similar to estimates for radiata pine (Pinus radiata)
In total 52 individual possums were captured at the Jubilee forest (1–2.5 ha−1) (Efford et al. 2005; Whyte et al. 2013) and
Park site (Table 1). We recorded 42 recaptures, with most native southern beech (Nothofagus spp.) forest (2–5.6 ha−1)
individuals being re-captured once or twice. The b model was (Sweetapple 2008; Pech et al. 2010). Urban forest fragments are
the top-ranking model based on AICc scores; all other models subject to conditions that are likely to reduce their habitability,
were within 2–3 AICc units of the b model and had moderate including disturbance from humans and domesticated animals,
AICc weights (Table 2), but all except the null and b models noise and light pollution, and edge effects extending from the

Table 1. The summarised results of density estimates of possums at three sites of varying vegetation quality and residential
influence within the city of Dunedin, including the total number of individual possums caught and recaptured (in traps,
and also considering re-sightings via camera trap as recaptures), and estimates of the spatial parameters g0,the one-night
probability of an individual being caught in a trap at the centre of its home range, and σ, a measure of home range size.
Methods used were spatially explicit capture-recapture (SECR) or minimum number alive (MNA) within an effective
trapping area (ETA). In the MNA method, minimum density was calculated as MNA divided by ETA.
__________________________________________________________________________________________________________________________________________________________________

Site Total indiv. Total recap. Method Density (ha-1) g0 σ̂
 (± SE) (± SE) (± SE)
__________________________________________________________________________________________________________________________________________________________________

Jubilee Park 52 42 SECR 3.1 (0.56) 0.02 (0.008) 80.35 (8.188)
 MNA 2.1
Maori Hill 2 3 SECR 0.1 (0.09) 0.02 (0.008) 80.35 (8.188)
 MNA 0.2
Wakari 5 2 SECR 0.1 (0.05) 0.02 (0.008) 80.35 (8.188)
 MNA 0.1
__________________________________________________________________________________________________________________________________________________________________
6 New Zealand Journal of Ecology, Vol. 45, No. 2, 2021

Table 2. AICc comparison of secr models of possum density at three sites (JP = Jubilee Park, MH = Maori Hill, WA = Wakari)
in Dunedin. Models b, bk, Bk and B represent alternative behavioural responses to capture (see Methods for descriptions).
~1 indicates a parameter was kept constant. D̂ is a density estimate, ĝ 0 is the one-night probability of an individual being
caught in a trap at the centre of its home range, σ̂ is a measure of home range size, and ΔAICc is the change in AICc score
relative to the best-performing model. The models with the lowest AICc and no uninformative parameters were chosen as
the top-performing models, and possum density was estimated by model averaging.
_________________________________________________________________________________________________
Model Parameters Site D ̂ g0̂ σ̂ Log likelihood AICc ΔAICc Model weight
__________________________________________________________________________________________________________________________________________________________________

b g0~1 σ~1 JP 2.91 0.03 80.04 −461.86 935.72 0.00 0.38
 MH 0.10
 WA 0.10
null g0~b σ~1 JP 3.40 0.02 80.72 −463.26 936.52 0.29 0.33
 MH 0.12
 WA 0.12
bk g0~bk σ~1 JP 3.43 0.02 81.83 −463.09 938.19 2.46 0.11
 MH 0.12
 WA 0.12
Bk g0~Bk σ~1 JP 3.41 0.02 80.99 −463.21 938.43 2.71 0.10
 MH 0.12
 WA 0.12
B g0~B σ~1 JP 3.38 0.02 80.70 −463.25 938.50 2.78 0.09
 MH 0.12
 WA 0.12
__________________________________________________________________________________________________________________________________________________________________

corresponding urban matrix (Mörtberg 2001; McDonnell et estimates in Nothofagus spp. southern beech forest (0.5 ha−1)
al. 2008; Caryl et al. 2013). These conditions may limit the (Clout 1977; Clout & Gaze 1984). In Australia, comparably low
density of possums in Jubilee Park. Nevertheless, our estimate densities have been recorded at locations primarily comprised
of possum density there reinforces the importance of urban of Eucalyptus spp., including sites around Canberra (0.49 ha−1)
forest fragments as habitat for possums. (Dunnet 1964), Tasmania (0.31 ha−1 and 0.04 ha−1) (Hocking
 Our findings support the conclusion of Adams et al. (2013), 1981; le Mar & McArthur 2005), New South Wales (0.44 ha−1)
that possums in Dunedin frequent urban habitats that also (How 1972), and South-Western Australia (0.28–2.84 ha−1)
act as refugia for taxa such as native birds (van Heezik et al. (How and Hillcox 2000). Some of these low densities can be
2008). As well as the risk of predation of native birds’ eggs and attributed to anthropogenic habitat degradation, disturbance,
chicks, possums at Jubilee Park may be sufficiently abundant or predation, while others simply indicate poor natural habitat
to trigger die-back of native vegetation. Holland et al. (2013) quality for possums (le Mar and McArthur 2005).
demonstrated that possums can cause browsing damage that The low capture rates at the residential sites suggest that
exceeds a tree’s “damage threshold”, at which point irreversible relatively few possums live in these habitats. Challenges
damage has occurred, generally resulting in the death of the associated with residential areas such as disturbance from
tree. At some sites this threshold was reached at densities of human activity might limit possum occupation to individuals
3–4 individuals ha−1 (Holland et al. 2013). At their observed that are particularly tolerant or behaviourally flexible.
density in Jubilee Park, possums might cause this damage Individuals of a range of species living in urban areas often
threshold to be crossed for plant species in Dunedin forest display distinct behavioural differences to their counterparts
fragments, leading to die-back (Rose et al. 1992; Holland et in other habitats, with more bold or explorative individuals
al. 2013), despite semi-regular possum control operations by representing the majority of individuals in urban populations
the Dunedin City Council. (Lowry et al. 2011; Lowry et al. 2013). Conversely, there could
 We expected that possums would be more abundant in be more possums at these sites than trapping suggests, due
Residential I habitat than in Residential II. Residential I habitat to individual avoidance of trapping devices. Some evidence
tends to include gardens with vegetation that is structurally supports this. Some prior observations indicate that urban
more complex than Residential II habitat, and is more likely possums were difficult to recapture (< 5% success rate) and
to include mature trees, hedges, and shrubs (Freeman & were trap-shy (Statham & Statham 1997; Adams et al. 2014).
Buck 2003). These features potentially provide more browse Householders in this study claimed that evidence of possums
for possums, as well as refuges from predators such as dogs, was routinely seen in their backyard, or that possums denned in
and den sites. Being closer to nearby forest fragments, which their house roof, and we saw physical evidence (scat, browsing
are frequently occupied by possums in Dunedin (Adams et damage) and film footage of recent possum presence at sites
al. 2014), also led us to expect higher possum densities in where we captured none. Nevertheless, while possum densities
Residential I habitat. However, contrary to our predictions, appeared to be lower in the residential areas than in the forest
the two residential sites had similarly low capture rates. The fragment, these areas represent important habitat within the
SECR-derived possum densities at the two residential sites home range of at least some individuals. Although we were
were lower than any recorded densities in New Zealand, but unable to estimate separate detection functions for our three
were most similar to the grassland/shrubland estimates of study sites due to low trapping rates in residential areas, future
Rouco et al. (2013) and Glen et al. (2012) (0.4–0.7 ha−1 and studies may be able to distinguish differences in detection
1.7 ha−1 respectively), as well as some of the lower density between residential environments and urban forest fragments.
Patterson et al.: Urban possum density estimates 7

 resource selection of invasive common brushtail possums
 The data we present here confirm the capacity for parts (Trichosurus vulpecula) in urban environments. Biological
of urban habitats to harbour significant possum populations, Invasions 16: 1791–1804.
but this study is only a snapshot density estimate of single Angold PG, Sadler JP, Hill MO, Pullin A, Rushton S, Austin K,
populations at three sites in one season (late summer–early Small E, Wood B, Wadsworth R, Sanderson R, Thompson
autumn). Possum density fluctuates seasonally with the K 2006. Biodiversity in urban habitat patches. Science of
availability of food resources and timing of breeding periods the Total Environment 360: 196–204.
(Efford 2000; Efford & Cowan 2004). Extrapolation of our Arnold TW 2010. Uninformative parameters and model
results to other similar habitat types should be done with selection using Akaike’s Information Criterion. The
caution. Ideally, long-term density estimates should be made Journal of Wildlife Management 74: 1175–1178.
for urban habitats across a range of sites, as our findings suggest Aronson, MFJ, La Sorte FA, Nilon CH, Katti M, Goddard
the potential for important differences among urban habitats MA, Lepczyk CA, Warren PS, Williams NSG, Cilliers
and between urban habitats and other ecosystems. S, Clarkson B, Dobbs C, Dolan R, Hedblom M, Klotz S,
 We have shown that urban habitats of differing vegetation Kooijmans JL, Kühn I, MacGregor-Fors I, McDonnell
cover and residential character harbour possums at varying M, Mörtberg U, Pyšek P, Siebert S, Sushinsky J, Werner
densities. As in other habitats, vegetation cover may be the P, Winter M 2014. A global analysis of the impacts of
most important factor determining possum occupation, with urbanization on bird and plant diversity reveals key
moderately high possum density in a forest fragment and low anthropogenic drivers. Proceedings of the Royal Society
densities at residential sites. The forest fragment supported B: Biological Sciences 281: 20133330.
possums at a density capable of harming vegetation and Borchers DL, Efford MG 2008. Spatially explicit maximum
resident native wildlife, but in the lower range of expected likelihood methods for capture– recapture studies.
density for the habitat type, suggesting a possible influence of Biometrics 64: 377–385.
anthropogenic disturbance. Possums were at low numbers in Braczkowski AR, Balme GA, Dickman A, Fattebert J, Johnson
two residential sites, but trap avoidance could have resulted P, Dickerson T, Macdonald DW, Hunter L 2016. Scent lure
in under-estimates of density in these highly modified and effect on camera-trap based leopard density estimates.
disturbed areas. The density estimates we have derived here PLOS ONE 11: e0151033.
can be used to inform predictive possum models, so as to Burnham KP, Anderson DR 2002. Model selection and
better represent urban areas as habitat for possums and plan multimodel inference: A practical information-theoretic
control accordingly. approach. 2nd ed. New York, Springer. 512 p.
 Caryl FM, Thomson K, van der Ree R 2013. Permeability of the
 urban matrix to arboreal gliding mammals: Sugar gliders
Acknowledgements in Melbourne, Australia. Austral Ecology 38: 609–616.
 Carthew SM, Yáñez BM, Ruykys L 2015. Straddling the divide:
We thank Aalbert Rebergen from DCC for providing den use by brushtail possums (Trichosurus vulpecula) in
contracting help, and Dave McPhee for advice in the field urban parklands. Urban Ecosystems 18: 525–538.
on the first day of trap set-up. Thanks to Murray Efford and Chace JF, Walsh JJ 2006. Urban effects on native avifauna: a
others in the SECR community for helpful comments during review. Landscape and Urban Planning 74: 46–69.
the analysis stage, and Stephanie Godfrey who provided us Clout MN 1977. The ecology of the possum (Trichosurus
with anaesthesia equipment. Thanks to all who assisted with vulpecula Kerr) in Pinus radiata plantations. Unpublished
fieldwork, particularly Scott Forrest, Tim Plaisted, Taylor PhD Thesis, University of Auckland, Auckland, New
Hamlin and John Ward, and those Dunedin residents who Zealand.
allowed access to their properties. CRP was supported in this Clout MN 2006. Keystone aliens? The multiple impacts of
work by a University of Otago Master’s Research Scholarship brushtail possums. In: Allen RB, Lee WG eds. Biological
and an Otago Council Inc Scholarship in Science. DJW Invasions in New Zealand. Berlin, Springer. Pp. 265–279.
received funding from the Ministry of Business, Innovation Clout MN, Gaze PD 1984. Brushtail possums (Trichosurus
and Employment’s Strategic Science Investment Fund for vulpecula Kerr) in a New Zealand beech (Nothofagus)
Crown Research Institutes. forest. New Zealand Journal of Ecology 7: 147–155.
 Cowan PE 2005. Brushtail possum. In: King CM ed. The
 Handbook of New Zealand Mammals. Melbourne, Oxford
 University Press. Pp. 56–80.
Author contributions Dearborn DC, Kark S 2010. Motivations for conserving urban
 biodiversity. Conservation Biology 24: 432–440.
CP, YvH, PS & DW conceptualised the research. CP collected Dice LR 1938. Some census methods for mammals. The
the data, carried out the analyses and produced a first draft. Journal of Wildlife Management 2: 119– 130.
All authors contributed to editing and revisions. Distiller G, Borchers DL 2015. A spatially explicit capture-
 recapture estimator for single-catch traps. Ecology and
 Evolution 5: 5075–5087.
References Duncan RP, Holland EP, Pech RP, Barron M, Nugent G, Parkes
 JP 2011. The relationship between possum density and
Adams AL, Dickinson KJM, Robertson BC, van Heezik Y 2013. browse damage on kamahi in New Zealand forests. Austral
 Predicting summer site occupancy for an invasive species, Ecology 36: 858–869.
 the common brushtail possum (Trichosurus vulpecula), in Dunnet GM 1964. A field study of local populations of the
 an urban environment. PLOS ONE 8: e58422. brush-tailed possum Trichosurus vulpecula in eastern
Adams AL, Recio MR, Robertson BC, Dickinson KJM, van Australia. Proceedings of the Zoological Society of
 Heezik Y 2014. Understanding home range behaviour and London 142: 665–695.
8 New Zealand Journal of Ecology, Vol. 45, No. 2, 2021

Efford MG 2000. Possum density, population structure, and Hurvich CM, Tsai CL 1989. Regression and time series model
 dynamics. In Montague TL ed. The brushtail possum: selection in small samples. Biometrika 76: 297–307.
 Biology, impact and management of an introduced Isaac JL, Johnson CN 2003. Sexual dimorphism and synchrony
 marsupial. Lincoln, Manaaki Whenua Press. Pp. 47–61. of breeding: variation in polygyny potential among
Efford MG 2004. Density estimation in live-trapping studies. populations in the common brushtail possum, Trichosurus
 Oikos 106: 598–610. vulpecula. Behavioral Ecology 14: 818–822.
Efford MG 2019. secr: spatially explicit capture-recapture Lowry H, Lill A, Wong BBM 2011. Tolerance of auditory
 models. R package version 3.5.2. disturbance by an avian urban adapter, the noisy miner.
Efford MG, Cowan PE 2004. Long-term population trend Ethology 117: 490–497.
 of the brushtail possums Trichosurus vulpecula in the Lowry H, Lill A, Wong BBM 2013. Behavioural responses
 Orongorongo Valley, New Zealand. In: Goldingay RL, of wildlife to urban environments. Biological Reviews
 Jackson SM eds. The biology of Australian possums and 88: 537–549.
 gliders. Chipping Norton, Surrey Beatty & Sons. Pp. Lustig A, James A, Anderson D, Plank M 2019. Pest control at
 471–483. a regional scale: identifying key criteria using a spatially
Efford MG, Warburton B, Coleman MC, Barker RJ 2005. A explicit, agent-based model. Journal of Applied Ecology
 field test of two methods for density estimation. Wildlife 56: 1515–1527.
 Society Bulletin 33: 731–738. le Mar K, McArthur C 2005. Habitat selection by common
Eymann, JD, Cooper W, Herbert CA 2013. Brushtail brushtail possums in a patchy eucalypt-forestry
 possums (Trichosurus vulpecula) in metropolitan environment. Australian Mammalogy 27: 119–127.
 Sydney: population biology and response to Suprelorin Mathieu R, Freeman C, Aryal J 2007. Mapping private gardens
 contraceptive implants. Australian Journal of Zoology in urban areas using object-oriented techniques and very
 61 :78–86. high-resolution satellite imagery. Landscape and Urban
Foster RJ, Harmsen BJ 2012. A critique of density estimation Planning 81: 179–192.
 from camera-trap data. The Journal of Wildlife Matthews A, Lunney D, Waples K, Hardy J 2004. Brushtail
 Management 76: 224–236. possums: “champion of the suburbs” or “Our tormentors”.
Freeman C, Buck O 2003. Development of an ecological In: Lunney D, Burgin S eds. Urban Wildlife: More than
 mapping methodology for urban areas in New Zealand. meets the eye. Mosman NSW, Royal Zoological Society
 Landscape and Urban Planning 63: 161–173. of New South Wales. Pp. 159–168.
Gallo T, Fidino M, Lehrer EW, Magle SB 2017. Mammal McDonnell MJ, Pickett ST, Groffman P, Bohlen P, Pouyat
 diversity and metacommunity dynamics in urban green RV, Zipperer WC, Parmelee RW, Carreiro MM, Medley
 spaces: implications for urban wildlife conservation. K 2008. Ecosystem processes along an urban-to-rural
 Ecological Applications 27: 2330–2341. gradient. In: Marzluff JM, Shulenberger E, Endlicher W,
Glen AS, Byrom AE, Pech RP, Cruz J, Schwab A, Sweetapple Alberti M, Bradley G, Ryan C, Simon U, ZumBrunnen
 PJ, Yockney I, Nugent G, Coleman M, and Whitford J 2012. C eds. Urban ecology. Boston, Springer. Pp. 299-313.
 Ecology of brushtail possums in a New Zealand dryland McKinney ML 2006. Urbanization as a major cause of biotic
 ecosystem. New Zealand Journal of Ecology 36: 29–37. homogenization. Biological Conservation 127: 247–260.
Harper MJ 2005. Home range and den use of common brushtail Montague T, Warburton B 2000. Non-toxic techniques for
 possums (Trichosurus vulpecula) in urban forest remnants. possum control. In: Montague TL ed. The brushtail
 Wildlife Research 32: 681–687. possum: Biology, impact and management of an introduced
Harper MJ, McCarthy MA, Ree RVD 2008. Resources at the marsupial. Lincoln, Manaaki Whenua Press. Pp. 164–174.
 landscape scale influence possum abundance. Austral Mörtberg UM 2001. Resident bird species in urban forest
 Ecology 33: 243–252. remnants; landscape and habitat perspectives. Landscape
van Heezik Y, Smyth A, Mathieu R 2008. Diversity of native Ecology 16: 193–203.
 and exotic birds across an urban gradient in a New Zealand Nugent G, Whitford J, Sweetapple P, Duncan R, Holland P
 city. Landscape and Urban Planning 87: 223–232. 2010. Effect of one-hit control on the density of possums
Hocking GJ 1981. The population ecology of the brush-tailed (Trichosurus vulpecula) and their impacts on native forest.
 possum, Trichosurus vulpecula (Kerr) in Tasmania. Science for Conservation 304. Wellington, Department of
 Unpublished MSc thesis, University of Tasmania, Conservation. 68 p.
 Tasmania, Australia. Nugent G, Warburton B, Thomson C, Sweetapple P, Ruscoe WA
Holland EP, Pech RP, Ruscoe WA, Parkes JP, Nugent G, Duncan 2011. Effect of prefeeding, sowing rate and sowing pattern
 RP 2013. Thresholds in plant–herbivore interactions: on efficacy of aerial 1080 poisoning of small mammal
 predicting plant mortality due to herbivore browse damage. pests in New Zealand. Wildlife Research 38: 249–259.
 Oecologia 172: 751–766. Otis DL, Burnham KP, White GC, Anderson DR 1978.
Hooker MJ, Laufenberg JS, Ashley AK, Sylvest JT, Statistical inference from capture data on closed animal
 Chamberlain MJ 2015. Abundance and density estimation populations. Wildlife Monographs 62: 3–135.
 of the American black bear population in central Georgia. Parmenter RR, Yates TL, Anderson DR, Burnham KP, Dunnum
 Ursus 26: 107–115. JL, Franklin AB, Friggens MT, Lubow BC, Miller M,
How RA 1972. The ecology and management of Trichosurus Olson GS, Parmenter CA, Pollard J, Rexstad E, Shenk
 species (Marsupialia) in New South Wales. Unpublished TM, Stanley TR, White GC 2003. Small-mammal density
 PhD thesis, University of New England, NSW, Australia. estimation: a field comparison of grid-based vs. web-based
How RA, Hillcox SJ 2000. Brushtail possum, Trichosurus density estimators. Ecological Monographs 73: 1–26.
 vulpecula, populations in southwestern Australia: Payton IJ 2000. Damage to native forests. In: Montague TL ed.
 demography, diet and conservation status. Wildlife The brushtail possum: Biology, impact and management
 Research 27: 81–89. of an introduced marsupial. Lincoln, Manaaki Whenua
Patterson et al.: Urban possum density estimates 9

 Press. Pp. 111–125. habitat and population density. Wildlife Research 40:
Pech R, Byrom A, Anderson D, Thomson C, Coleman M 537–544.
 2010. The effect of poisoned and notional vaccinated Wilson DJ, Efford MG, Brown SJ, Williamson JF, McElrea
 buffers on possum (Trichosurus vulpecula) movements: GJ 2007. Estimating density of ship rats in New Zealand
 minimising the risk of bovine tuberculosis spread from forests by capture-mark-recapture trapping. New Zealand
 forest to farmland. Wildlife Research 37: 283–292. Journal of Ecology 31: 47–59.
Pickett KN, Hik DS, Newsome AE, Pech RP 2005. The Woolley CK, Hartley S, Hitchmough RA, Innes JG, van
 influence of predation risk on foraging behaviour of Heezik Y, Wilson DJ, Nelson NJ 2019. Reviewing the
 brushtail possums in Australian woodlands. Wildlife past, present and potential lizard faunas of New Zealand
 Research 32: 121– 130. cities. Landscape and Urban Planning 192: 103647.
QGIS Development Team 2019. QGIS Geographic Information
 System. Open Source Geospatial Foundation Project. Received: 17 June 2020; accepted: 11 February 2021
R Core Team 2018. R: a language and environment for statistical Editorial board member: Tom Etherington
 computing. R Foundation for Statistical Computing.
 Vienna, Austria.
Richardson KS, Rouco C, Jewell C, French NP, Buddle BM,
 Tompkins DM 2017. Investigating brushtail possum
 (Trichosurus vulpecula) home-range size determinants in a
 New Zealand native forest. Wildlife Research 44: 316–323.
Rouco C, Norbury GL, Smith J, Byrom AE, Petch RP 2013.
 Population density estimates of brushtail possums
 (Trichosurus vulpecula) in dry grassland in New Zealand.
 New Zealand Journal of Ecology 37: 12–17.
Rose AB, Pekelharing CJ, Platt KH 1992. Magnitude of canopy
 dieback and implications for conservation of southern rata-
 kamahi (Metrosideros umbellata-Weinmannia racemosa)
 forests, central Westland, New Zealand. New Zealand
 Journal of Ecology 16: 23–32.
Royle JA, Young KV 2008. A hierarchical model for spatial
 capture–recapture data. Ecology 89: 2281–2289.
Russell JC, Innes JG, Brown PH, Byrom AE 2015. Predator-
 free New Zealand: conservation country. BioScience 65:
 520–525.
Russell JC, Stanley MC 2018. An overview of introduced
 predator management in inhabited landscapes. Pacific
 Conservation Biology 24: 371–378.
Sadlier R 2000. Evidence of possums as predators of native
 animals. In: Montague TL ed. The brushtail possum:
 Biology, impact and management of an introduced
 marsupial. Lincoln, Manaaki Whenua Press. Pp. 126–131.
Shochat E, Lerman SB, Anderies JM, Warren PS, Faeth SH,
 Nilon CH 2010. Invasion, competition, and biodiversity
 loss in urban ecosystems. BioScience 60: 199–208.
Shepherd JD, Gillingham S, Heuer T, Barron MC, Byrom
 AE, Pech RP 2018. Multiscale dynamic maps for the
 management of invading and established wildlife
 populations: brushtail possums in New Zealand. Wildlife
 Research 45: 336–343.
Soga M, Gaston KJ 2016. Extinction of experience: the loss
 of human–nature interactions. Frontiers in Ecology and
 the Environment 14: 94–101.
Statham M, Statham H 1997. Movements and habits of brushtail
 possums (Trichosurus vulpecula Kerr) in an urban area.
 Wildlife Research 24: 715–726.
Sweetapple PJ 2008. Spatial variation in impacts of brushtail
 possums on two Loranthaceous mistletoe species. New
 Zealand Journal of Ecology 32: 177–185.
Warburton BP, Cowan P, Shepherd J 2009. How many
 possums are now in New Zealand following control and
 how many would there be without it? Manaaki Whenua
 Contract Report LC0910/060. Lincoln, Manaaki Whenua
 – Landcare Research. 23 p.
Whyte BI, Ross JG, Blackie HM 2013. Differences in brushtail
 possum home-range characteristics among sites of varying
You can also read