Grouptron: Dynamic Multi-Scale Graph Convolutional Networks for Group-Aware Dense Crowd Trajectory Forecasting - arXiv
←
→
Page content transcription
If your browser does not render page correctly, please read the page content below
Grouptron: Dynamic Multi-Scale Graph Convolutional Networks for
                                                   Group-Aware Dense Crowd Trajectory Forecasting
                                                  Rui Zhou1 , Hongyu Zhou2 , Huidong Gao3 , Masayoshi Tomizuka3 , Jiachen Li4,∗ , and Zhuo Xu3,∗

                                           Abstract— Accurate, long-term forecasting of pedestrian tra-
                                        jectories in highly dynamic and interactive scenes is a long-
                                        standing challenge. Recent advances in using data-driven ap-
                                        proaches have achieved significant improvements in terms
                                        of prediction accuracy. However, the lack of group-aware
arXiv:2109.14128v3 [cs.CV] 4 Mar 2022

                                        analysis has limited the performance of forecasting models.
                                        This is especially nonnegligible in highly crowded scenes, where
                                        pedestrians are moving in groups and the interactions between
                                        groups are extremely complex and dynamic. In this paper, we
                                        present Grouptron, a multi-scale dynamic forecasting frame-
                                        work that leverages pedestrian group detection and utilizes
                                        individual-level, group-level and scene-level information for
                                        better understanding and representation of the scenes. Our
                                        approach employs spatio-temporal clustering algorithms to
                                        identify pedestrian groups, creates spatio-temporal graphs at
                                        the individual, group, and scene levels. It then uses graph neural
                                        networks to encode dynamics at different scales and aggregate
                                        the embeddings for trajectory prediction. We conducted ex-
                                        tensive comparisons and ablation experiments to demonstrate              Fig. 1. Grouptron models the pedestrian behaviors in a multi-scale fashion
                                        the effectiveness of our approach. Our method achieves 9.3%              and constructs spatio-temporal graphs for different scales.
                                        decrease in final displacement error (FDE) compared with
                                        state-of-the-art methods on ETH/UCY benchmark datasets, and
                                        16.1% decrease in FDE in more crowded scenes where extensive
                                        human group interactions are more frequently present.                    state-of-the-art performance on trajectory prediction [1], [2],
                                                                                                                 [3], [4], [5], [6]. However, most state-of-the-art methods
                                                               I. I NTRODUCTION                                  fail to consider the densely populated scenarios, which are
                                           Generating long-term and accurate predictions of hu-                  extremely challenging due to the immensely dynamic and
                                        man pedestrian trajectories is of enormous significance for              complex interactions. Moreover, in such highly crowded
                                        developing reliable autonomous systems (e.g. autonomous                  scenarios, groups of pedestrians are common. [7] estimates
                                        vehicles, mobile robots), which are often required to safely             that 50% to 70% of pedestrians walk in groups, which exhibit
                                        navigate in crowded scenarios with many human pedestrians                dramatically distinct behaviors from individuals. However,
                                        present, such as in crowded open traffic or in warehouses.               existing methods lack the mechanism of representing such
                                        Therefore, the capability of understanding and predicting                group dynamics, which limits their performance in highly
                                        the dense crowd behavior is instrumental in order to avoid               crowded situations.
                                        collisions with the highly dynamic crowds and to behave in                  In this paper, we seek to resolve this challenge by lever-
                                        a socially-aware way.                                                    aging group detection and dynamic spatio-temporal graph
                                           Through daily interactions, humans are able to develop                representations at different scales as visualized in Fig. 1.
                                        the remarkable capability of understanding crowded and                   Concretely, we construct a dynamic multi-scale graph con-
                                        interactive environments and inferring the potential future              volutional neural network that uses pedestrian group infor-
                                        movements of all other traffic participants. Similarly, recent           mation to better learn and model the extremely complex
                                        advances using machine learning techniques leverage the                  dynamics at different scales and between different scales.
                                        massive human interaction data are capable of achieving                     The contributions of this paper are summarized as follows:
                                          ∗ Theseauthors contributed equally to this paper
                                                                                                                    • We propose to leverage spatio-temporal clustering algo-
                                          1 RuiZhou is with the Department of Electrical Engineering and              rithms to detect pedestrians in groups.
                                        Computer Science, University of California, Berkeley, CA 94720 USA          • We design a hierarchical prediction framework using
                                        ruizhouzr@berkeley.edu                                                        spatio-temporal graph neural networks which encode
                                           2 Hongyu Zhou is with the Department of Aerospace Engineering, Uni-
                                        versity of Michigan, Ann Arbor, MI 48109 USA zhouhy@umich.edu
                                                                                                                      the scene at three levels:
                                           3 Huidong Gao, Masayoshi Tomizuka, and Zhuo Xu are with the Depart-
                                                                                                                     1) The individual level encodes the historical trajectory
                                        ment of Mechanical Engineering, University of California, Berkeley, CA           of the predicted pedestrian.
                                        94720 USA {hgao9, tomizuka, zhuoxu}@berkeley.edu
                                           4 Jiachen Li is with the Department of Aeronautics & Astronautics,        2) The group level encodes the dynamics and trajectory
                                        Stanford University, CA 94305 USA jiachen_li@stanford.edu                        information within each pedestrian group.
3) The scene level encodes the dynamics and interac- to spatio-temporal GCN for skeleton-based action recogni-
tions between pedestrian groups. tion [28]. STGCN is adapted by Social-STGNN [29] for tra-
• The proposed multi-scale spatio-temporal architecture jectory forecasting, where trajectories are modeled by graphs
outperforms existing methods by 9.3% in terms of final with edges representing social interactions and weighted by
displacement errors. In particular, for densely crowded the distances between pedestrians. A development related
scenarios, the performance improvement can be as sig- to our paper is dynamic multi-scale GNN (DMGNN) [30],
nificant as 16.1%. which proposes a multi-scale graph to model human body
relations and extract features at multiple scales for motion
II. R ELATED W ORK prediction. There are two kinds of sub-graphs in the multi-
A. Human Trajectory Forecasting scale graph: (i) single-scale graphs, which connect body
One of the pioneering works of human trajectory forecast- components at the same scales, and (ii) cross-scale graphs,
ing is the Social Force model [8], which applies Newtonian which form cross-scale connections among body compo-
forces to model human motion. Similar methods with strong nents. Based on the multi-scale graphs, a multi-scale graph
priors have also been proposed [9]; yet, most of them rely computational unit is proposed to extract and fuse features
on hand-crafted energy potential, such as relative distances across multiple scales. Motivated by this work, we adopt
and rules, to model human motion. the multi-scale graph strategy for dense crowd forecasting
Recently, machine learning methods have been applied to which includes scene-level graphs, group-level graphs, and
the problem of human trajectory forecasting to obtain models individual-level graphs.
with better performance. One line of work is to formulate this
problem as a deterministic time-series regression problem C. Group-aware Prediction
and then solve it using, e.g., Gaussian Process Regression People moving in groups (such as friends, family mem-
(GPR) [10], inverse reinforcement learning (IRL) [11], and bers, etc.) is a common phenomenon and people in each
recurrent neural networks (RNNs) [1], [12], [13]. group tend to exhibit similar motion patterns. Motivated by
However, the issue of these deterministic regressors is this phenomenon, group-aware methods [31] consider the
that human behavior is rarely deterministic or unimodal. possibility of human agents being in groups or formations to
Hence, generative approaches have become the state-of- have more correlated motions than independent ones. They
the-art trajectory forecasting methods, due to recent ad- therefore can also model reactions of agents to the moving
vancements in deep generative models [14], [15] and their groups. Human agents can be assigned to different groups
ability of generating distributions of potential future trajec- by clustering trajectories with similar motion patterns based
tories (instead of a single future trajectory). Most of these on methods such as k-means clustering [32], support vector
methods use a recurrent neural network architecture with clustering [33], coherent filtering [34], and spectral clustering
a latent variable model, such as a conditional variational methods [35].
auto-encoder (CVAE) [2], [16], [17], [18], or a generative
adversarial network (GAN) [19], [20], [21], [22], [23] to III. G ROUPTRON
encode multi-modality. Compared to previous work, we not A. Problem Formulation
only consider multi-modality from the perspective of a single
We aim to predict the trajectory distributions of a time-
agent, but also from the group level; we take into account the
varying N (t) number of pedestrians PN (t) . At time step
phenomenon that people usually move in groups. We show
t, given the 2-D position s ∈ R2 of each pedestrian and
that our group-aware prediction has better understanding of
their previous trajectories of T time steps T ∈ RT ×2 , our
the scenes and achieves better forecasting performance.
goal is to predict the distributions of their trajectories in the
B. Graph Convolutional Networks next F future time steps, y = Tt:t+F 1,..,N (t) ∈ R
N (t)×F ×2
.
Of the methods mentioned above, RNN-based methods We denote the distributions as p(y | x). The performance
have achieved better performance. However, recurrent archi- of the predictions is evaluated by standard distance-based
tectures are parameter inefficient and expensive in training metrics on benchmark datasets: the average displacement
[24]. Besides, to handle spatial context, RNN-based methods error (ADE) and the final displacement error (FDE).
need additional structures. Most of them use graph models
to encode neighboring pedestrians’ information since the B. Model Overview
topology of graphs is a natural way to represent interactions Rooted in the CVAE architecture in Trajectron++ [2],
between pedestrians. Graph convolutional networks (GCN) we design a more expressive multi-scale scene encoding
introduced in [25] is more suitable for dealing with non- structure, which actively takes into consideration the group-
Euclidean data. The Social-BiGAT [20] introduces a graph level and scene-level information for better representation
attention network [26] to model social interactions. Graph- of crowded scenes where groups of pedestrians are present.
SAGE [27] aggregates nodes and fuses adjacent nodes in Concretely, we leverage spatio-temporal graphs for each level
different orders to extract node embeddings. To capture both to model information and interactions at the corresponding
the spatial and temporal information, Spatio-Temporal Graph level. We refer to our model as Grouptron. Our model is il-
Convolutional Networks (STGCN) extends the spatial GCN lustrated in Fig. 2. In this subsection, we provide an overviewFig. 2. The diagram of the Grouptron model, which creates spatio-temporal graphs for different levels and encodes these graphs using different networks.
Combining encodings for the individual level, the group level, and the scene level, Grouptron then uses a GRU decoder to output the predictions.
of the architecture, and in Section III-C, we elaborate on the network which is an LSTM network with hidden dimension
details of the Grouptron model. 8. In this way, we obtain two vectors: a vector encoding the
At the individual level, we construct spatio-temporal trajectory history of the current node and a vector encoding
graphs for individual pedestrians. The graph is centered the representation of all the neighbors of the current node.
at the node whose trajectory we want to predict. We call 2) Pedestrian Group Clustering: To cluster nodes into
it the “current node”. Long short term memory (LSTM) groups based on trajectories, we propose to leverage the
networks [36] are used to encode this graph. We group agglomerative clustering algorithm [35], which uses similar-
the pedestrians with the agglomerative clustering algorithm ity scores based on Hausdorff distances between trajectories.
based on Hausdorff distances [35]. STGCN is used to encode The number of clusters (groups) to create for each scene is
dynamics within the groups. determined by:
At the scene level, spatio-temporal graphs are created to
model dynamics among pedestrian groups and are encoded C(N ) = (N + 1)/2, (1)
using a different STGCN. Lastly, the information across
different scales is combined. A decoder is then used to obtain where C is the number of clusters and N is the total number
trajectory predictions and the model can output the most of nodes to be clustered.
possible trajectory or the predicted trajectory distributions. Furthermore, We only include nodes with an edge to or
from the current node. This is because we only want to
C. Multi-Scale Scene Encoder include nodes that can potentially influence the current node
1) Individual-Level Encoder: The first level of encoding to avoid unhelpful information from nodes that are too far
is for the individual pedestrians. We represent information away from the current node.
at the individual level using a spatio-temporal graph for the 3) Group-Level Encoder: For each group, we create a
current node. The nodes include the current node and all spatio-temporal graph consisting of Gg,t = (Vg,t , Eg,t ),
other nodes that are in the perception range of the current where t is the time step and g is the group id. Vg,t = {vi,t |
node and nodes whose perception range covers the current ∀i ∈ {1, ..., Ng }} are all the nodes in the group g. The
node. The node states are the trajectories of the nodes. The node states are the trajectories of the represented pedestrians.
edges are directional and there is an edge ei,j if pedestrian Eg,t = {ei,jt | ∀i, j ∈ {1, ..., Ng } are the set of edges
i is in the perception range of pedestrian j. To encode the between the nodes in the current group such that ei,j t = 1
current node’s history trajectory, we use an LSTM network to allow maximum interaction modeling within pedestrian
with hidden dimension 32. To encode the edges, we first groups.
perform an element-wise sum on the states of all neighboring After forming the aforementioned graphs for each group,
nodes to form a single vector that represents all neighbors of they are then passed to the group-level trajectory encoder
the current node. This vector is then fed into the edge LSTM to obtain the encoded vectors for nodes in each group. Thegroup-level trajectory encoder is an STGCN proposed in [28] IV. E XPERIMENTS
and used in [29]. We set the convolution filter size to 3 and A. Datasets
use the same weight parameters for all the groups.
The model is trained on two publicly available datasets
We then average the encoded vectors of all nodes in each
that are benchmarks in the field: The ETH [39], with subsets
group to obtain the representations for the corresponding
PNg named ETH and HOTEL, and the UCY [40] datasets, with
groups. That is, Eg = N1g i=1 Ei , where Eg is the encoded
subsets named ZARA1, ZARA2, and UNIV. The trajectories
vector for group g, Ei is the encoded vector for node i in
are sampled at 0.4 seconds intervals. The model observes 8
the output from the group-level trajectory encoder, and Ng
time steps, which corresponds to 3.2 seconds, and predicts
is the number of nodes in group g.
the next 12 time steps, which corresponds to 4.8 seconds.
4) Scene-Level Encoder: After obtaining the encoded vec- To further evaluate and demonstrate Grouptron’s perfor-
tors for each group, a scene-level spatio-temporal graph with mance in densely populated scenarios, we create UNIV-N
nodes representing groups is created. That is, Gscene,t = test sets, where N is the minimum number of people present
(Vscene,t , Escene,t ). Vscene,t = {vg,t | ∀ g ∈ {1, ..., G}}, simultaneously at each time step in the test sets. Each UNIV-
where G is the total number of groups and t is the timestep. N test set contains all time steps that have at least N people
The state for each node is Eg from the group-level trajectory in the scene simultaneously from the original UNIV test set.
encoder. Escene,t = {ei,j t | ∀i, j ∈ {1, ..., G} are the set of In this way, we created test sets UNIV-40, UNIV-45, and
edges between the groups in the scene. Each ei,j is set to 1 UNIV-50 and, at each time step, there are at least 40, 45, and
to allow maximum message passing between group nodes. 50 people in the scene at the same time. These test sets are
We then select the encoded vector corresponding to the far more challenging than the original UNIV test set because
last timestep and the group id of the current node as the of the more complex and dynamic interactions at different
scene-level encoding: Escene = Eg,T , where g is the group scales. We train the models on the original UNIV training
id of the current node we are encoding for and T is the total set and evaluate the models on the UNIV-40, UNIV-45, and
number of time steps. UNIV-50 test sets.
5) Multi-Scale Encoder Output: The output of the multi-
scale scene encoder is the concatenation of the following B. Evaluation Metrics
level encoded vectors: the output from the node history As in prior work [1], [2], [41] and more, we used the
encoder, the output from individual-level edge encoder, and following metrics to evaluate our model:
the output from the scene-Level encoder. That is, Emulti = 1) Final Displacement Error:
[Ehis ; Eedge ; Escene ], where Ehis is the encoded vector for
||Tˆi − TTi F ||2
P
the current node’s history trajectory, Eedge is the vector rep- F DE = i∈N TF , (3)
resenting individual-level neighbors, Escene is the encoded N
vector from the scene-level encoder. which is the l2 distance between the predicted final position
and the ground truth final position with prediction horizon
D. Decoder Network TF .
2) Average Displacement Error:
Together with the latent variable z, Emulti is passed to P P ˆi i
the decoder that is a Gated Recurrent Unit (GRU) [37] with i∈N t∈TF ||Tt − Tt ||2
ADE = , (4)
128 dimensions. The output from the GRU decoder is then N × TF
fed into dynamics integration modules as control actions to where N is the total number of pedestrians, TF is the number
output the predicted trajectory distributions, or the single
of future timesteps we want to predict for, Tˆti is the predicted
most-likley trajectory, depending on the task.
trajectory for pedestrian i at timestep t. ADE is the mean l2
distance between the ground truth and predicted trajectories.
E. Loss Functions
C. Experiment settings
We adopt the following objective function for the overall The Grouptron model is implemented using PyTorch. The
CVAE model: model is trained using an Intel I7 CPU and NVIDIA GTX
N
X 1080 Ti GPUs for 100 epochs. The batch size is 256. For
max Ez∼qφ (·|xi ,yi ) [log pψ (yi |xi , z)] the HOTEL, UNIV, ZARA1, and ZARA2 datasets, the output
φ,θ,ψ
i=1 dimension for the group-level and scene level encoders are
− βDKL (qφ (z|xi , yi ) ||pθ (z|xi )) + αIq (x|z), 16. For the ETH dataset, we set the output dimension of
(2) the group-level and scene-level encoders to be 8. This is
where Iq is the mutual information between x and z under because the ETH test set contains only 2 timesteps with at
the distribution qφ (x|z). We follow the process given in [38] least 5 people in the scene, out of the total 1161 timesteps. In
to compute Iq . We approximate qφ (z|xi , yi ) with pθ (z|xi ), comparison, the training set contains 1910 timesteps, out of
and obtain the unconditioned latent distribution by summing 4976 in total, with at least 5 people. Thus, to help the model
out xi over the batch. learn generalizable representations in this case, we decreaseTABLE I
FDE/ADE (m) VALUES FOR BASELINE METHODS AND G ROUPTRON ON ETH AND UCY DATASETS . L OWER IS BETTER . B OLD INDICATES BEST.
Method ETH HOTEL UNIV ZARA1 ZARA2 AVG
Social-LSTM 2.35/1.09 1.76/0.79 1.40/0.67 1.00/0.47 1.17/0.56 1.54/0.72
Social-GAN 1.52/0.81 1.61/0.72 1.26/0.60 0.69/0.34 1.84/0.42 1.18/0.58
SoPhie 1.43/0.70 1.67/0.76 1.24/0.54 0.63/0.34 0.78/0.38 1.15/0.54
Trajectron++ 1.68/0.71 0.46/0.22 1.07/0.41 0.77/0.30 0.59/0.23 0.91/0.37
Grouptron 1.56/0.70 0.46/0.21 0.97/0.38 0.76/0.30 0.56/0.22 0.86/0.36
TABLE II
FDE/ADE (m) VALUES FOR BASELINE METHODS AND G ROUPTRON ON UNIV-N DATASETS . L OWER IS BETTER . B OLD INDICATES BEST.
Method UNIV UNIV-40 UNIV-45 UNIV-50
Trajectron++ 1.07/0.41 1.17/0.436 1.24/0.46 1.25/0.47
Grouptron 0.97/0.38 1.00/0.39 1.04/0.40 1.07/0.42
efficient between human-generated and algorithm-generated
groups. That is, we use
1 X 1 X 2 × |Gh,t ∩ Ga,t |
DSC = , (5)
T H |Gh,t | + |Ga,t |
t∈T h∈H
where T is the number of timesteps, H is the total num-
ber of human annotators, Ga,t is the grouping created by
the agglomerative clustering method for time step t, Gh,t
is the grouping created by humans for time step t, and
|Gh ∩ Ga | measures how many of the groups by humans
and the algorithm are exactly the same. The Average Dice
coefficient between human annotators and the algorithm is
0.72. The higher the Dice coefficient, the more similar are
the groups created by the agglomerative clustering method
and human annotators. Thus, The average Dice Coefficient of
Fig. 3. An example of pedestrian group clustering. Pedestrians are divided 0.72 indicates the groups output by agglomerative clustering
into five groups. Different colors indicate different groups. method are really similar to human-generated ones.
the output dimension of the STGCNs to 8. The learning E. Quantitative Results
rate is set to 0.001 initially and decayed exponentially every We compare Grouptron’s performance with state-of-the-
epoch with a decay rate of 0.9999. The model is trained using art methods and common baselines in the field in terms of
Adam gradient descent and gradients are clipped at 1.0. the FDE and ADE metrics, and the results are shown in
Table I. Overall, Grouptron outperforms all state-of-the-art
D. Evaluation of the Group Clustering Algorithm methods with considerable decrease in displacement errors.
In Fig. 3, it is shown that the groups created by the Since Grouptron is built on Trajectron++, we also compare
agglomerative clustering method are very close to the natural the FDE and ADE values of Grouptron and Trajectron++.
definition of pedestrian groups. We can see that pedestrians We find that Grouptron outperforms Trajectron++ on all 5
5 and 6 are travelling in a highly correlated fashion and datasets by considerable margins. Particularly, on the ETH
pedestrians 1, 2, 3, and 4’s trajectories are highly similar dataset, Grouptron achieves an FDE of 1.56m, which is
as well. In both cases, the clustering algorithm is able to 7.1% better than the FDE value of 1.68m by Trajectron++.
correctly cluster these pedestrians into their corresponding Furthermore, Grouptron achieves an FDE of 0.97m on the
groups. This shows that by using agglomerative clustering UNIV dataset. This is 9.3% reduction in FDE error when
based on Hausdorff distances, Grouptron is able to suc- compared with the FDE value of 1.07m by Trajectron++ on
cessfully generate naturally defined groups. To quantitatively the same dataset.
evaluate the groups generated by the algorithm, we selected Moreover, we compare Grouptron’s performance with
10 random time steps from the ETH training dataset. We Trajectron++’s in dense crowds with the UNIV-N datasets
invited 10 human volunteers to label groups for the time in Table II. Overall, Grouptron outperforms Trajectron++ on
steps and used the agglomerative clustering method described all the UNIV-N test sets by enormous margins. In particular,
in Section III-C to generate group clusters, respectively. Grouptron achieves an FDE of 1.04m and ADE of 0.40m on
For both human-generated groups and algorithm-generated the UNIV-45 test set, which contains all timesteps from the
groups, the number of groups to be formed is computed using original UNIV test set that have at least 45 pedestrians in the
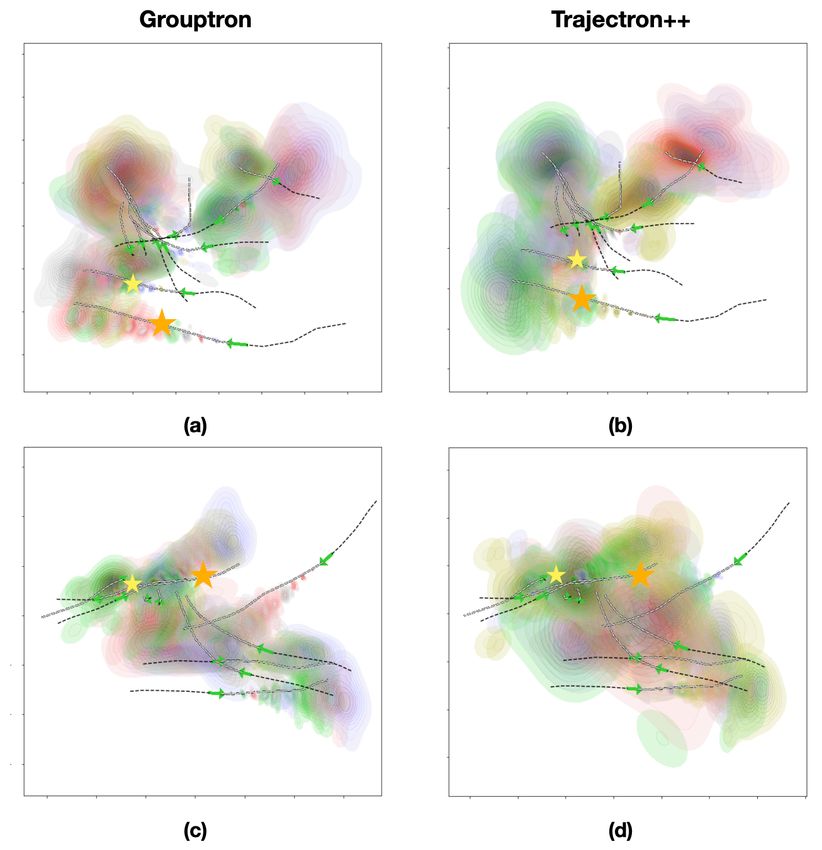
Equation 1. We then compute the average Sørensen–Dice co- scene at the same time. This is 16.1% in FDE improvementFig. 4. Examples of Grouptron’s predictions on the UNIV dataset. The Fig. 5. Comparisons of Grouptron’s and Trajectron++’s distributions of
predictions are the most likely trajectory predictions of the model. Green 20 most likely future trajectories on examples of the UNIV dataset. Rows
arrows indicate pedestrians’ current positions and directions. Black dashed indicate different examples and columns represent different methods. Orange
lines indicate trajectory histories. Grey dashed lines indicate ground truth stars indicate pedestrians of interest. Yellow stars indicate their companions
future trajectories. Green lines are Grouptron’s predicted future trajectories. in the same pedestrian groups. Green arrows indicate pedestrians’ current
positions and directions. Black dashed lines indicate trajectory histories.
Grey dashed lines indicate ground truth future trajectories. The comparisons
when compared with the FDE value of Trajectron++ and show that Grouptron is able to produce predictions with higher quality and
13.0% in ADE improvement when compared with the ADE with better confidence levels.
value of Trajectron++ on the same test set.
Furthermore, we notice that the state-of-the-art method, In Fig. 5, we compare Grouptron’s distributions of 20 most
Trajectron++, performs substantially worse as the number likely predictions with those of Trajectron++’s. Comparing
of pedestrians in the scene increases. Specifically, Trajec- Fig. 5a with 5b and 5c with 5d shows that Grouptron’s
tron++’s FDE increases from 1.07m to 1.25m as the min- predictions for the pedestrians of interest reflect the in-
imum number of pedestrians in the scene increases from teractions within pedestrian groups more accurately. Fur-
1 to 50. In contrast, Grouptron’s FDE remains relatively thermore, Grouptron’s prediction distributions have much
stable as the number of pedestrians increases. This shows smaller ranges, indicating that it is much more confident with
that Grouptron performs much better and is more robust in prediction outcomes.
densely populated scenarios. V. C ONCLUSIONS
In this paper, we present Grouptron, a multi-scale graph
F. Qualitative Analysis
neural network for pedestrian trajectory forecasting. The
Fig. 4 shows Grouptron’s most likely predictions for some spatio-temporal graphs model complex and highly dynamic
examples of the UNIV dataset. Fig. 4a shows two pedestrian pedestrian interactions at three scales: the individual level,
groups crossing paths. We can see that Grouptron’s predic- the group level, and the scene level. Grouptron detects
tions are consistent with the groups. Furthermore, it accu- pedestrian groups using agglomerative clustering based on
rately predicts when and where the two groups’ trajectories Hausdorff distances, uses GCNs and LSTM-based networks
intersect. Fig. 4b shows a case where pedestrians are forming to encode information at different scales, and combines
groups and merging paths. Grouptron again successfully the embeddings across scales. With these novel designs,
predicts the formation of this group. Fig. 4c and Fig. 4d Grouptron achieves high performance even in situations that
show Grouptron’s performance in densely populated scenes are tough for state-of-the-art methods. Through extensive
with more than 40 pedestrians. Even in these extremely experiments, we show that Grouptron outperforms state-of-
challenging scenarios for state-of-the-art methods, Grouptron art methods on ETH and UCY datasets, which are standard
still produces predictions of high quality and the predictions benchmarks in the field. Furthermore, through qualitative
are consistent with pedestrian groups. Furthermore, we can comparisons and experiments run on densely populated
see that even when pedestrian groups are crossing paths or UNIV-N test sets, we show that Grouptron outperforms state-
influencing each other, Grouptron successfully predicts these of-art methods by even larger margins and is robust to the
highly dynamic and complex scenarios. change in the number of pedestrians in the scene.R EFERENCES [21] A. Sadeghian, V. Kosaraju, A. Sadeghian, N. Hirose, H. Rezatofighi,
and S. Savarese, “Sophie: An attentive gan for predicting paths
[1] A. Alahi, K. Goel, V. Ramanathan, A. Robicquet, L. Fei-Fei, and compliant to social and physical constraints,” in Proceedings of the
S. Savarese, “Social lstm: Human trajectory prediction in crowded IEEE/CVF Conference on Computer Vision and Pattern Recognition,
spaces,” in Proceedings of the IEEE conference on computer vision 2019, pp. 1349–1358.
and pattern recognition, 2016, pp. 961–971. [22] T. Zhao, Y. Xu, M. Monfort, W. Choi, C. Baker, Y. Zhao, Y. Wang,
and Y. N. Wu, “Multi-agent tensor fusion for contextual trajectory
[2] T. Salzmann, B. Ivanovic, P. Chakravarty, and M. Pavone, “Tra-
prediction,” in Proceedings of the IEEE/CVF Conference on Computer
jectron++: Dynamically-feasible trajectory forecasting with heteroge-
Vision and Pattern Recognition, 2019, pp. 12 126–12 134.
neous data,” in Computer Vision–ECCV 2020: 16th European Confer-
[23] J. Li, H. Ma, and M. Tomizuka, “Conditional generative neural system
ence, Glasgow, UK, August 23–28, 2020, Proceedings, Part XVIII 16.
for probabilistic trajectory prediction,” in 2019 IEEE/RSJ International
Springer, 2020, pp. 683–700.
Conference on Intelligent Robots and Systems (IROS). IEEE, 2019,
[3] J. Li, F. Yang, M. Tomizuka, and C. Choi, “Evolvegraph: Multi-agent
pp. 6150–6156.
trajectory prediction with dynamic relational reasoning,” Advances in
[24] S. Bai, J. Z. Kolter, and V. Koltun, “An empirical evaluation of generic
neural information processing systems, vol. 33, pp. 19 783–19 794,
convolutional and recurrent networks for sequence modeling,” arXiv
2020.
preprint arXiv:1803.01271, 2018.
[4] J. Li, F. Yang, H. Ma, S. Malla, M. Tomizuka, and C. Choi, “Rain: Re- [25] T. N. Kipf and M. Welling, “Semi-supervised classification with graph
inforced hybrid attention inference network for motion forecasting,” in convolutional networks,” arXiv preprint arXiv:1609.02907, 2016.
Proceedings of the IEEE/CVF International Conference on Computer [26] P. Veličković, G. Cucurull, A. Casanova, A. Romero, P. Lio,
Vision, 2021, pp. 16 096–16 106. and Y. Bengio, “Graph attention networks,” arXiv preprint
[5] C. Choi, J. H. Choi, J. Li, and S. Malla, “Shared cross-modal trajectory arXiv:1710.10903, 2017.
prediction for autonomous driving,” in Proceedings of the IEEE/CVF [27] W. L. Hamilton, R. Ying, and J. Leskovec, “Inductive representation
Conference on Computer Vision and Pattern Recognition, 2021, pp. learning on large graphs,” in Proceedings of the 31st International
244–253. Conference on Neural Information Processing Systems, 2017, pp.
[6] H. Ma, Y. Sun, J. Li, M. Tomizuka, and C. Choi, “Continual multi- 1025–1035.
agent interaction behavior prediction with conditional generative mem- [28] S. Yan, Y. Xiong, and D. Lin, “Spatial temporal graph convolutional
ory,” IEEE Robotics and Automation Letters, vol. 6, no. 4, pp. 8410– networks for skeleton-based action recognition,” in Thirty-second
8417, 2021. AAAI conference on artificial intelligence, 2018.
[7] J. Sochman and D. C. Hogg, “Who knows who - inverting the social [29] A. Mohamed, K. Qian, M. Elhoseiny, and C. Claudel, “Social-
force model for finding groups,” 2011 IEEE International Conference stgcnn: A social spatio-temporal graph convolutional neural network
on Computer Vision Workshops (ICCV Workshops), pp. 830–837, for human trajectory prediction,” in Proceedings of the IEEE/CVF
2011. Conference on Computer Vision and Pattern Recognition, 2020, pp.
[8] D. Helbing and P. Molnar, “Social force model for pedestrian dynam- 14 424–14 432.
ics,” Physical review E, vol. 51, no. 5, p. 4282, 1995. [30] M. Li, S. Chen, Y. Zhao, Y. Zhang, Y. Wang, and Q. Tian, “Dynamic
[9] G. Antonini, M. Bierlaire, and M. Weber, “Discrete choice models multiscale graph neural networks for 3d skeleton based human motion
of pedestrian walking behavior,” Transportation Research Part B: prediction,” in Proceedings of the IEEE/CVF Conference on Computer
Methodological, vol. 40, no. 8, pp. 667–687, 2006. Vision and Pattern Recognition, 2020, pp. 214–223.
[10] J. M. Wang, D. J. Fleet, and A. Hertzmann, “Gaussian process [31] A. Rudenko, L. Palmieri, M. Herman, K. M. Kitani, D. M. Gavrila,
dynamical models for human motion,” IEEE transactions on pattern and K. O. Arras, “Human motion trajectory prediction: A survey,”
analysis and machine intelligence, vol. 30, no. 2, pp. 283–298, 2007. The International Journal of Robotics Research, vol. 39, no. 8, pp.
[11] N. Lee and K. M. Kitani, “Predicting wide receiver trajectories in 895–935, 2020.
american football,” in 2016 IEEE Winter Conference on Applications [32] J. Zhong, W. Cai, L. Luo, and H. Yin, “Learning behavior pat-
of Computer Vision (WACV). IEEE, 2016, pp. 1–9. terns from video: A data-driven framework for agent-based crowd
[12] A. Jain, A. R. Zamir, S. Savarese, and A. Saxena, “Structural-rnn: modeling,” in Proceedings of the 2015 International Conference on
Deep learning on spatio-temporal graphs,” in Proceedings of the ieee Autonomous Agents and Multiagent Systems, 2015, pp. 801–809.
conference on computer vision and pattern recognition, 2016, pp. [33] I. A. Lawal, F. Poiesi, D. Anguita, and A. Cavallaro, “Support vector
5308–5317. motion clustering,” IEEE Transactions on Circuits and Systems for
[13] A. Vemula, K. Muelling, and J. Oh, “Social attention: Modeling Video Technology, vol. 27, no. 11, pp. 2395–2408, 2016.
attention in human crowds,” in 2018 IEEE international Conference [34] N. Bisagno, B. Zhang, and N. Conci, “Group lstm: Group trajectory
on Robotics and Automation (ICRA). IEEE, 2018, pp. 4601–4607. prediction in crowded scenarios,” in Proceedings of the European
[14] K. Sohn, H. Lee, and X. Yan, “Learning structured output represen- Conference on Computer Vision (ECCV) Workshops, 2018, pp. 0–0.
tation using deep conditional generative models,” Advances in neural [35] S. Atev, G. Miller, and N. P. Papanikolopoulos, “Clustering of vehicle
information processing systems, vol. 28, pp. 3483–3491, 2015. trajectories,” IEEE transactions on intelligent transportation systems,
[15] I. Goodfellow, J. Pouget-Abadie, M. Mirza, B. Xu, D. Warde-Farley, vol. 11, no. 3, pp. 647–657, 2010.
S. Ozair, A. Courville, and Y. Bengio, “Generative adversarial nets,” [36] S. Hochreiter and J. Schmidhuber, “Long short-term memory,” Neural
Advances in neural information processing systems, vol. 27, 2014. computation, vol. 9, no. 8, pp. 1735–1780, 1997.
[16] N. Lee, W. Choi, P. Vernaza, C. B. Choy, P. H. Torr, and M. Chan- [37] J. Chung, C. Gulcehre, K. Cho, and Y. Bengio, “Empirical evaluation
draker, “Desire: Distant future prediction in dynamic scenes with in- of gated recurrent neural networks on sequence modeling,” arXiv
teracting agents,” in Proceedings of the IEEE Conference on Computer preprint arXiv:1412.3555, 2014.
Vision and Pattern Recognition, 2017, pp. 336–345. [38] S. Zhao, J. Song, and S. Ermon, “Infovae: Balancing learning and
inference in variational autoencoders,” in Proceedings of the aaai
[17] H. Ma, J. Li, W. Zhan, and M. Tomizuka, “Wasserstein generative
conference on artificial intelligence, vol. 33, no. 01, 2019, pp. 5885–
learning with kinematic constraints for probabilistic interactive driving
5892.
behavior prediction,” in 2019 IEEE Intelligent Vehicles Symposium
[39] S. Pellegrini, A. Ess, K. Schindler, and L. Van Gool, “You’ll never
(IV). IEEE, 2019, pp. 2477–2483.
walk alone: Modeling social behavior for multi-target tracking,” in
[18] J. Li, H. Ma, Z. Zhang, J. Li, and M. Tomizuka, “Spatio-temporal
2009 IEEE 12th International Conference on Computer Vision. IEEE,
graph dual-attention network for multi-agent prediction and tracking,”
2009, pp. 261–268.
IEEE Transactions on Intelligent Transportation Systems, 2021.
[40] A. Lerner, Y. Chrysanthou, and D. Lischinski, “Crowds by example,”
[19] A. Gupta, J. Johnson, L. Fei-Fei, S. Savarese, and A. Alahi, “Social in Computer graphics forum, vol. 26, no. 3. Wiley Online Library,
gan: Socially acceptable trajectories with generative adversarial net- 2007, pp. 655–664.
works,” in Proceedings of the IEEE Conference on Computer Vision [41] B. Ivanovic and M. Pavone, “The trajectron: Probabilistic multi-
and Pattern Recognition, 2018, pp. 2255–2264. agent trajectory modeling with dynamic spatiotemporal graphs,” in
[20] V. Kosaraju, A. Sadeghian, R. Martín-Martín, I. Reid, S. H. Proceedings of the IEEE/CVF International Conference on Computer
Rezatofighi, and S. Savarese, “Social-bigat: Multimodal trajectory Vision, 2019, pp. 2375–2384.
forecasting using bicycle-gan and graph attention networks,” arXiv
preprint arXiv:1907.03395, 2019.You can also read