GREATER MANCHESTER AIR QUALITY ACTION PLAN 2016-2021
←
→
Page content transcription
If your browser does not render page correctly, please read the page content below

GREATER MANCHESTER
AIR QUALITY ACTION PLAN
2016–2021

CONTENTS

Executive Summary         5
Memorial to Ged Steadman  8
Acknowledgments9
Glossary10
1    Introduction        11
     1.1    Action Plan Objectives                                                             11
     1.2    Consultation                                                                       11
     1.3    The Existing Greater Manchester Air Quality Strategy and Air Quality Action Plan   12
     1.4    Low-Emission Strategy for Greater Manchester                                       12
     1.5    Greater Manchester Spatial Framework (GMSF)                                        12
     1.6    2040 Transport Strategy                                                            13
2    Air Quality Legislation                                                                   14
     2.1    European Air Quality Directives                                                    14
     2.2    National Air Quality Legislation                                                   14
     2.3    2015 Supreme Court Ruling                                                          15
     2.4    Air Quality Action Plans                                                           15
3    Understanding the Problem                                                                 16
     3.1    Air Quality Management Area                                                        16
     3.2    Monitored Concentrations                                                           17
     3.3    Modelled Areas of Exceedance                                                       18
     3.4    Traffic Emissions                                                                  19
     3.5    Areas with High Bus and HGV Flows                                                  23
     3.6    Key Priority Areas for Air Quality Action Planning                                 24
4    Current Air Quality Improvement Initiatives                                               28
     4.1    Greater Manchester Air Quality Strategy and Air Quality Action Plan                28
5    Additional Considerations in Drawing up this AQAP                                         30
     5.1    Key Performance Indicators                                                         30
     5.2    Existing Programmes                                                                31
     5.3    Responsibility and Resources                                                       31
     5.4    Structure of Actions                                                               31
     5.5    Measuring Effects                                                                  31
     5.6    Timescales                                                                         32
     5.7    Priority Actions                                                                   32
     5.8    Complementary Effects                                                              32
     5.9    Strategic Road Network                                                             33
     5.10 Industrial Emission Sources                                                          33
     5.11   Manchester Airport and Network Rail                                                33
6    Actions for Managing New Development                                                      34
     6.1    Construction Management Guidance                                                   34
     6.2    Development Planning Guidance                                                      34
     6.3    Cumulative Development Database                                                    35
     6.4    Clean Air Zones                                                                    36
     6.5    20mph Zones                                                                        37

2   GREATER MANCHESTER AIR QUALITY ACTION PLAN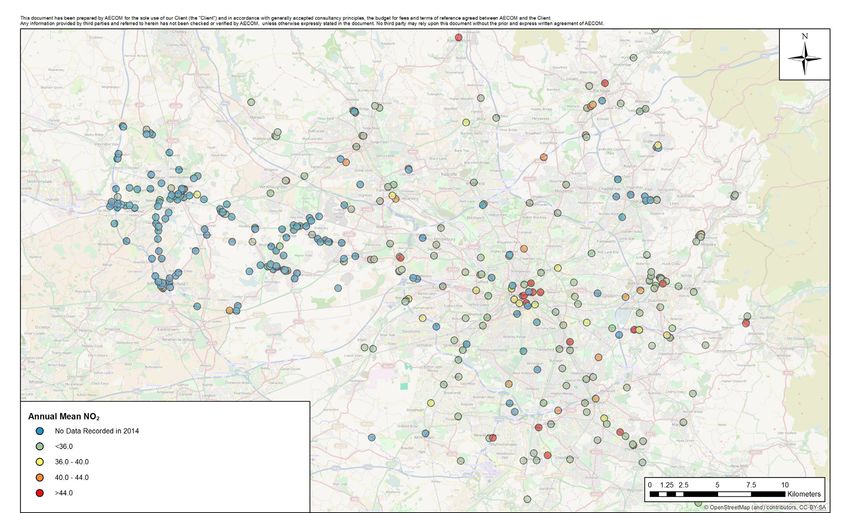
6.6    Encouraging Travel Planning                                                      38
     6.7    Taxi and Private Hire Quality Controls to Prioritise Low-Emission Vehicles       39
     6.8    Green Infrastructure                                                             39
7    Actions for Freight and Goods Vehicles                                                  40
     7.1    Delivery and Servicing Plan Toolkit                                              40
     7.2    Urban Distribution Centres                                                       41
     7.3    Urban Consolidation                                                              42
     7.4    Access for Freight to Key Economic Centres and Sub-regional Freight Facilities   43
     7.5    Freight Information Channels                                                     43
     7.6    Diesel transport refrigeration units (TRUs)                                      44
     7.7    Engine Idling                                                                    44
     7.8    Alternative Fuels                                                                45
8    Actions for Buses                                                                       46
     8.1    Bus Priority Programmes                                                          46
     8.2    Bus Improvements                                                                 47
     8.3    Hybrid Bus Improvements                                                          48
     8.4    Trial of Low-Emission Vehicles                                                   48
9    Actions for Cycling                                                                     49
     9.1    Minor Cycle Infrastructure Funds                                                 49
     9.2    Cycle City Ambition Grant (CCAG)                                                 50
     9.3    Cycleways                                                                        50
     9.4    Consolidated Cycle Actions                                                       51
     9.5    Public Cycle Hire                                                                51
     9.6    Cycle Logistics                                                                  52
     9.7    Cycling to 2040                                                                  52
10   Actions for Travel Choices                                                              53
     10.1   Car Clubs                                                                        53
     10.2 Dynamic Road Network Efficiency and Travel Information System                      54
11   Actions for Cars                                                                        56
     11.1   Plugged-in Places EV Charging Network                                            56
     11.2 Car Use Allowance                                                                  59
     11.3 Local Authority Parking Charges                                                    59
     11.4 School Travel                                                                      60
12   Actions for Information and Resources                                                   61
     12.1   Website and Online Resources                                                     61
     12.2 Online Route Finding                                                               61
     12.3 Pollution Alert                                                                    62
     12.4 Evaluate the Health Impacts of Poor Air Quality                                    62
     12.5 Contingency Response Plan                                                          63
     12.6 TfGM Air Quality Team                                                              63
     12.7 Air Quality Monitoring Database                                                    64
     12.8 Traffic Flow Data                                                                  64
     12.9 Awareness-Raising                                                                  65

                                                                                               3
CONTENTS

13    Next Steps and Summary of Actions          66
      13.1   Implementation Plan                 66
      13.2 Monitoring Progress                   66
      13.3 Update and Reviews                    66
      13.4 Summary of Actions                    67
14 References                                    75
Appendix A: Local and Regional Policies          76
Appendix B: Infrastructure Improvement Schemes   80

4    GREATER MANCHESTER AIR QUALITY ACTION PLAN
EXECUTIVE SUMMARY

Preparation of this Air Quality Action Plan (AQAP)            Policies and interventions were subsequently identified
for Greater Manchester has involved a review of the           and divided into the following broad subjects, based on
strategies, policies and plans which tackle or are in some    the area and type of effects that may be achieved:
way related to air quality, to develop a clear, robust and
meaningful set of actions which will deliver real changes     1. Development Management and Planning
in terms of air quality, whilst supporting the sustainable       Regulation – including standardisation of regulation
economic growth of the region.                                   and policy across the Greater Manchester (GM) region.

The primary objectives of this Plan are to improve            2. Freight & Heavy Goods Vehicles – there are several
air quality across Greater Manchester and to embed               opportunities to reduce emissions associated with the
low-emission behaviours into the culture of our                  movement of freight and goods by road.
organisations and lifestyles by 2025, whilst supporting
the UK Government in meeting all EU thresholds for key        3. Buses – buses have a vital role to play in transporting
air pollutants at the earliest date to reduce ill-health in      the public and provide opportunities to improve air
Greater Manchester.                                              quality. The Government’s Bus Services Bill 2016 aims
                                                                 to support bus patronage and encourage improved
In this Plan ‘Key Priority Areas’ have been identified;          vehicle standards. The development of Greater
these are generally locations near to major roads and            Manchester’s future bus strategy will explore how the
heavily trafficked areas in Manchester city centre, and          new legislative powers may be used to support the
other major urban centres across the other nine districts,       region’s air quality objectives.
where air quality is poor and where people live. Most
effort and resources to improve air quality should be         4. Cycling – existing strategies and initiatives encourage
focused on these areas.                                          cycling.

Key Performance Indicators (KPIs) have been defined to        5. Travel Choices – encouraging the public and business
help categorise improvement actions according to the             to make sustainable travel choices is essential to
means by which they could improve air quality, namely:           realising lasting air quality benefits.

1. Reduce Traffic – for instance by encouraging modal         6. Cars – measures to reduce emissions from cars and
   shift from private vehicle use to public transport,           reduce the number of vehicle trips can deliver real
   cycling and walking.                                          improvements.

2. Increase Efficiency – of traffic movement by reducing      7. Information & Resources – education and the
   congestion and stop-start travel to achieve a smoother        provision of information to the public, business and
   emission profile and overall lower emissions, which           policy makers are seen as vital to realising air quality
   may be particularly significant at peak hours.                improvements.

3. Improve Fleet – by incentivising the replacement of        The following table summarises the actions to be
   older, more polluting vehicles with newer, smaller,        implemented to improve air quality. It is only intended
   cleaner, lower-emission vehicles.                          to be a summary; a more detailed version of the table
                                                              with greater depth of information is provided in the final
Consultation workshops were held with key stakeholders        section of the report.
including the Greater Manchester local authorities,
Public Health England, Transport for Greater Manchester
(TfGM) and Highways England, to provide an opportunity
for open discussion to generate new ideas and obtain
feedback on the measures proposed, and to ensure that
there is appropriate ‘buy-in’ to the proposed actions to
ensure that they can be implemented.

                                                                                                EXECUTIVE SUMMARY 5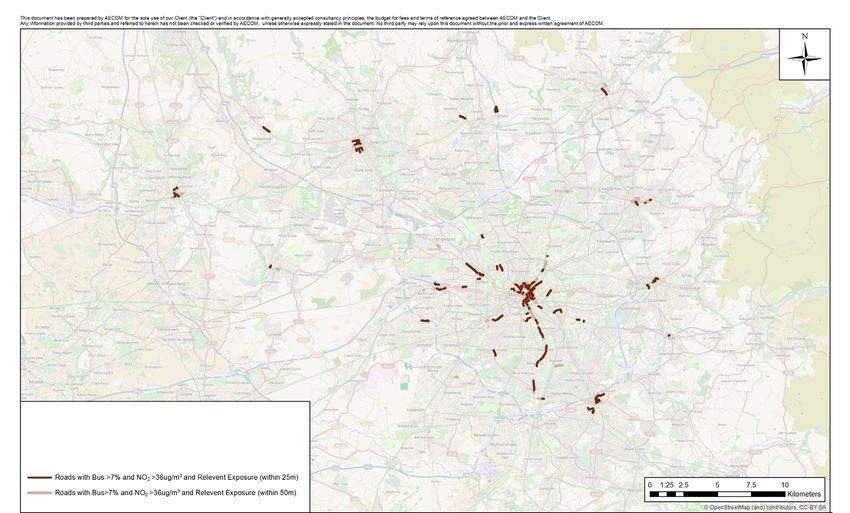
Action Summary Table

    Development Control and Planning Regulation
    1.1.    Construction Management Guidance: Greater Manchester (GM) councils to adopt the IAQM Guidance on the
            Assessment of Dust from Demolition and Construction sites – to ensure appropriate mitigation controls are
            conditioned.
    1.2.    Development Planning Guidance: GM councils to adopt the most recent IAQM air quality planning guidance, to help
            ensure that planning applications consider impacts consistently, and opportunities to improve air quality are realised.
    1.3.    Cumulative Development Database: A centralised database of planning applications and air quality assessments
            will be managed by TfGM, to better understand and manage the cumulative effects of several developments.
    1.4.    Clean Air Zone Appraisals: TfGM will undertake an appraisal of the effects of charging Clean Air Zones (CAZs).
    1.5.    20mph Zones: Review the effects of 20mph zones on air quality.
    1.6.    Encouraging Travel Planning: TfGM will work with the local authorities to encourage travel planning measures in
            businesses and individuals to effect a significant modal shift.
    1.7.    Taxi & Private Hire Licensing: Seek to standardise the minimum emission requirements for taxis.
    1.8.    Green Infrastructure: Investigate the potential of green infrastructure in improving air quality.

    Freight & Heavy Good Vehicles
    2.1     TfGM Delivery and Servicing Plan (DSP) Toolkit: The key priority areas for air quality due to freight emissions will
            be included in the toolkit, to encourage more efficient practices.
    2.2     Urban Distribution Centres: Locations for potential centres will be identified in the Greater Manchester Spatial
            Framework, using travel planning to ensure that local air quality benefits are realised.
    2.3     Urban Consolidation: The GM councils and TfGM will implement a policy to encourage and facilitate consolidation
            for freight deliveries and waste collection, with air quality being a prime consideration.
    2.4     Access for Freight to Key Economic Centres and Sub-regional Freight Facilities: New and existing freight
            facilities to consider maximising air quality benefits by reducing HGV movements.
    2.5     Freight Information Channels: TfGM will identify where mobile, digital and live information channels can be used to
            improve the efficiency of freight transport by providing accurate and up-to-date information to operators and drivers.
    2.6     Diesel Transport Refrigeration Units (TRUs): TfGM will look at the alternatives to Diesel Transport
            Refrigeration Units (TRUs) to ultimately achieve and promote zero-emission transport refrigeration.
    2.7     Engine Idling: TfGM will promote anti-idling policies with freight transport companies and more widely.
    2.8     Alternative Fuels: Investigate the potential of alternative fuels and carry out trials using different vehicle
            types.

    Buses
    3.1     Bus Priority Programmes: TfGM to ensure that new bus priority programmes are conceived with air quality consider-
            ations prioritised.
    3.2     Bus Improvements: Identify opportunities to retrofit vehicles, when appropriate.
    3.3     Hybrid Bus Improvements: Includes several actions to maximise the benefits of hybrid buses.
    3.4     Trial of Low-Emission Vehicles: Identify opportunities for trial of a range-extender bus or other Ultra-Low-Emission
            Vehicles.

6      GREATER MANCHESTER AIR QUALITY ACTION PLAN
Cycling
4.1    Cycle Programmes: Improve the cycle infrastructure and provide practical support to reduce vehicle movements in
       the Key Priority Areas.
4.2    Public Cycle Hire: Explore the feasibility of public cycle hire facilities.
4.3    Cycle Logistics: Encourage and promote a logistics programme to use cycle or electrically-assisted cycles for short
       distance deliveries and distribution in urban centres.
4.4    2040: Undertake further work to better understand the more innovative options available to further promote
       cycling and walking, and to set out a clear delivery plan in line with the 2040 transport strategy.

Travel Choices
5.1    Car Clubs: Appraise the effects of the car clubs that are already in operation, with consideration to new clubs; and a
       requirement to operate a high proportion of Electric Vehicles (EVs).
5.2    Dynamic Road Network Efficiency and Travel Information System: Travel information systems will be used to
       promote alternative travel choices and to warn people vulnerable to high pollution to make appropriate choices.

Cars
6.1    Plugged-in Places EV Charging Network: Continue to increase the number of EV charging points.
6.2    Car Use Allowance: Work with local authorities to review car business mileage allowances and sustainable travel.
6.3    Local Authority Parking Charges: Work with local authorities to review the introduction of parking charges at local
       authority offices to discourage non-low emissions private car use in favour of public transport.
6.4    School Travel: TfGM will appraise opportunities to reduce air quality impacts from school car travel.

Information & Resources
7.1    Website and Online Resources: The GreatAir Manchester website will help to raise awareness and educate.
7.2    Online Route Finding: Major providers of online mapping and travel information will be contacted to ensure that the
       best available online data is being used and updated frequently in order to promote alternative travel choices.
7.3    Pollution Alert: Email/text alert service to warn about pollution events and promote alternative travel choices.
7.4    Health Effects of Air Pollution within Greater Manchester. Work will be undertaken with partners to determine
       the health effects of air quality across the whole of the Greater Manchester region.
7.5    Contingency Response Plan: to be prepared with Greater Manchester Resilience Forum (GMRF) to ensure adequate
       procedures are in place to cope in the event of high pollution episodes.
7.6    TfGM Air Quality Team: TfGM will provide staff resource to support partners in implementing this Plan and to
       provide support for key local authority roles.
7.7    Air Quality Monitoring Database: to be maintained to ensure that air quality information is collated and can be
       used.
7.8    Traffic Data: Better data required to understand the composition of the vehicle fleet and better understand the air
       quality problem and better monitor the effects of this Plan in the future.
7.9    Awareness-Raising: Raising awareness with communities, workplaces and schools, plan air quality action days, and
       provide guidance regarding the role they can play in improving air quality.

                                                                                                     EXECUTIVE SUMMARY 7
MEMORIAL TO GED STEADMAN

Ged was a dedicated, well respected colleague and friend, which was reflected in the number of people he knew
when it came to air quality. He would spend hours looking at monitoring results and know at an instant if there was
a problem with one of the air quality monitors, ensuring that it was fixed before irreparable damage was done. He
was an active member of the Greater Manchester Air Quality Group, working closely with the nine other Greater
Manchester authorities to produce the first Greater Manchester Air Quality Action Plan, a group for which he was to
become the undisputed lead in more recent times. He was very much a team player and willingly took on the role of
bidding, on behalf of the Greater Manchester authorities, to fund essential work such as air quality modelling across
the conurbation. His efforts resulted in the first Air Quality Management Area. He also appeared on BBC Radio
Manchester’s Breakfast show hosted by Alan Beswick, when he cycled into central Manchester to take part in a live
radio interview on air quality in the conurbation.

Ged worked hard to protect the people of Salford, where he had worked since 22 April 1991. Part of his role was to
respond to planning consultations. He would read consultants’ reports, submitted with planning applications, and
recommend conditions to ensure that the best possible air quality outcomes were realised. He was not a shy person; on
several occasions he was known to challenge large organisations to ensure that emissions would not affect people in
Greater Manchester.

Ged took pride in his work but he was also a realistic man and knew that there was a balance between good air quality
and economic growth, as without growth the city would not prosper. He knew that the dramatic improvements needed
in air quality would only come from a change in behaviour when choosing means of transport and the move away
from fossil fuels. Ged played his part in this and would cycle to and from work every day; however he did have cause to
comment about the dangers of the tram tracks whilst cycling.

Ged died on 31 May 2015, aged 59. He is sadly missed and was taken too soon; however, we are all the richer for
knowing him.

8   GREATER MANCHESTER AIR QUALITY ACTION PLAN
ACKNOWLEDGMENTS

TfGM would like to thank the following individuals who provided support in the development of this Plan:

Sarah Davies, AGMA                                          Craig Lewis, Salford CC
Katherine King, Bolton MBC                                  Siobhan Farmer, Salford CC
Judith Scott, Bury MBC                                      Emma Nolan, Salford CC
Anne Spencer, Bury MBC                                      Chris Findley, Salford CC
Chris Horth, Bury MBC                                       Adele Kingston, Salford CC
Rebecca Jones, Bury MBC                                     Sue Stevenson, Stockport MBC
Lorraine Chamberlin, Bury MBC                               Stephen Brown, Stockport MBC
Andrew Bean, Highways England                               Paul Lawrence, Stockport MBC
Steven Lee, Highways England                                Gary Mongan, Tameside MBC
Kristian Marsh, Highways England                            Ian Hull, TfGM
Rebecca Twigg, Manchester CC                                Julian Ashworth, TfGM
Tim Birch, Manchester CC                                    David Bland, TfGM
Richard Elliot, Manchester CC                               Peter Molyneux, TfGM
Stuart Bayley, Manchester CC                                Richard Dolphin, TfGM
Caroline Greenen, Oldham Council                            Matthew O’Neill, TfGM
Mark Atherton, Oldham Council                               Catherine Flynn, TfGM
Ceri Riley, PHE                                             Howard Hartley, TfGM
Mark Brown, PHE                                             David Ives, TfGM
William Welfare, PHE                                        Richard Pollitt, Trafford BC
Laura Hulse, Rochdale MBC                                   Alan Goodare, Trafford BC
Nicola Rogers, Rochdale MBC                                 Nasreen Ali, Trafford BC
Cheryl Ma, Salford CC                                       Rob Haslam, Trafford BC
Lynda Stefek, Salford CC                                    Steve Tesson-Fell, Wigan Council
William Horsfall, Salford CC

                                                                                            ACKNOWLEDGMENTS 9
GLOSSARY
AQAP: Air Quality Action Plan
AQMA: Air Quality Management Area
CAZ: Clean Air Zone
DPF: Diesel Particulate Filter, fine particulates emissions-reduction technology
DSP Delivery and Servicing Plan
EFT: Emission Factor Toolkit, Defra vehicle emission model used in this study
EGR: Exhaust Gas Recirculation, emissions reduction technology
EV: Electric-engine Vehicle, typically using battery as the main power source instead of an internal
combustion engine
Euro 1 to 6: Engine emission standards for cars, labelled as number digits
Euro I to VI: Engine emission standards for buses and HGVs, labelled as Roman numerals
GMCA: Greater Manchester Combined Authority
HGV: Heavy Goods Vehicle weighing over 3.5 tonnes
HDV: Heavy Duty Vehicle over 3.5 tonnes, including buses and HGVs
HIA: Health Impact Assessment
LAQM: Local Air Quality Management
LDV: Light Duty Vehicle weighing less than 3.5 tonnes, such as light vans
LSTF: Local Sustainable Transport Fund
LTP: Local Transport Plan
NO2: Nitrogen dioxide, the key pollutant in this study due to high levels of exposure in some parts of the region
NOx: Oxides of nitrogen, modelled as emissions in this study
PM10: Fine particulate matter; particles of below 10µm in diameter.
PSV: Public Service Vehicle such as buses
QBC: Quality Bus Corridor
SCR: Selective Catalytic Reduction, emissions reduction technology
TfGM: Transport for Greater Manchester
UTMC: Urban Traffic Management Control
10 GREATER MANCHESTER AIR QUALITY ACTION PLAN1 INTRODUCTION
Greater Manchester, like many urbanised regions of the UK, contains areas that suffer from poor air quality. This
Air Quality Action Plan aims to bring together a robust and meaningful set of actions and measures that will bring
about an improvement in air quality, to benefit the health of the population.
This document is the Air Quality Action Plan (AQAP) for Greater Manchester. Preparation of the AQAP has involved
a review of the strategies, policies and plans which tackle or are in some way related to air quality, to develop a clear,
robust and meaningful set of actions which will deliver real changes in terms of air quality. These actions focus on road
transport as it is the major contributor to poor air quality in the region.
Greater Manchester Combined Authority (GMCA) has an established Climate Change Strategy and associated
Implementation Plan. However, air quality activity has not developed at the same rate and there is a requirement to
raise the profile of this agenda and increase the pace of progress.
TfGM and GMCA are implementing a number of policies and programmes to improve the urban environment, including
the efficiency of the transport network and access to travel. Therefore, many of the Actions have been developed
around this existing framework to achieve the greatest possible local air quality benefits.
This AQAP comprises a single document including actions that will be ratified by TfGM and district authorities to tackle
air quality in Key Priority Areas, whilst supporting the sustainable economic growth of the region. This plan will allow
councils to carry out their statutory duties under Part IV of the Environment Act 1995, as its implementation will help
mandatory EU limit values to be met.
Manchester Airport, Highways England and Network Rail have specific air quality plans. TfGM will work closely with
these organisations to ensure that activities are aligned.
1.1 Action Plan Objectives
The key objectives of this Plan are that:
nnAir quality across Greater Manchester will improve
nnLow-emission behaviours will have become embedded into the culture of our organisations and lifestyles
by 2025
nnWe will support the UK Government in meeting and maintaining all EU thresholds for key air pollutants at
the earliest date to reduce ill-health in Greater Manchester.
1.2 Consultation
This AQAP documents a programme of consultation and workshops for key stakeholders including the Greater
Manchester local authorities, Public Health England, TfGM and Highways England, to provide an opportunity for open
discussion to generate new ideas and obtain feedback on the measures proposed, and to make sure that there
is appropriate ‘buy-in’ to the proposed actions to ensure that they can be implemented.
The existing policies, programmes and schemes being undertaken by TfGM and district authorities were reviewed
and opportunities to incorporate air quality interventions have been identified. These provisional interventions
were presented to the consultees in order to identify whether an action may be created.
An understanding of the baseline conditions and progress on existing air quality interventions were also used to
identify other actions that should be included in this Plan.
INTRODUCTION 111.3 The Existing Greater Manchester Air Quality Strategy and Air Quality Action Plan
The first Greater Manchester Air Quality Strategy was set out in 2002 with the Greater Manchester Air Quality
Management Strategy ‘Clearing the Air’.
The Greater Manchester Air Quality Strategy and Action Plan (2006) which followed set out a package of measures
to address air pollution from road transport, with a particular focus on meeting EU Limit Values for nitrogen dioxide
(NO2) in 2010. The Plan was developed jointly with the Local Transport Plan 2 (LTP2) due to road traffic being a major
contributor to pollution.
The key air quality objectives from the 2006 AQAP were transposed into Local Transport Plan 2011-2016 (LTP3), which
sets out the strategic approach to reducing transport emissions.
The updated Greater Manchester Low-Emission Strategy will provide the strategic framework to support the
implementation of the Actions in this Plan.
1.4 Low-Emission Strategy for Greater Manchester
The Low-Emission Strategy is published alongside this Action Plan and presents a long-term, integrated approach to
carbon emissions and air quality in the period up to 2040. The Strategy is intended to establish a framework to develop
detailed plans to reduce carbon emissions and improve air quality.
The key aims of the strategy are to:
nnSupport the UK Government in meeting all EU thresholds for key pollutants at the earliest date;
nnContribute to reducing Greater Manchester’s carbon footprint, in line with the Greater Manchester Climate
Change Strategy; and
nnReduce air pollution as a contributor to ill-health in Greater Manchester.
1.5 Greater Manchester Spatial Framework (GMSF)
The 10 Greater Manchester local authorities increasingly operate as a single economic area, with a single labour
market and interdependent towns and cities, transport, culture, education and public services. Therefore, the Greater
Manchester Spatial Framework (GMSF) is intended to reflect the role of Greater Manchester as a regional capital
by defining the extents and requirements of future housing and development for the next 20 years, which will be
coordinated with the 10 local plans.
The draft GMSFF was published for consultation in December 2016. A publication plan will be published (and further
consulted on) later in 2017, before submission to the Secretary of State and an independent public hearing in 2018.
12 GREATER MANCHESTER AIR QUALITY ACTION PLAN1.6 2040 Transport Strategy
In July 2016, TfGM published for consultation the draft Greater Manchester Transport Strategy 2040, on behalf of the
GMCA and GM Local Enterprise Partnership, along with a Delivery Plan for the period 2016/17-2020/21. These documents
together constitute Greater Manchester’s fourth Local Transport Plan. The 2040 Strategy provides a vision of what
a successful transport system might look like in 2040, to support Greater Manchester’s wider economic, social and
environmental ambitions. In order to support these ambitions, the following outcomes were identified as necessary.
Vision Desired Outcomes
Supporting sustainable economic growth nnReduce congestion;
nnBetter access to skills and markets;
nnMore reliable journey times;
nnA resilient and well-maintained network; and
nnPeople see Greater Manchester as a good place to visit
and invest in.
Improving quality of life nnBetter access to jobs and training;
nnBetter access to services;
nnMore people travelling actively;
nnImproved road safety and personal security.
Protecting the environment nnMore people travelling by non-car modes;
nnReduce emissions of CO2 and NO2;
nnAccessible locations prioritised for new development;
and
nnInfrastructure designed and maintained to minimise
environmental impact.
INTRODUCTION 132 AIR QUALITY LEGISLATION
The legislative framework essentially places the onus on regions such as Greater Manchester to maintain good air
quality or improve air quality where required, so as to meet mandatory limits.
Air quality legislation in the UK is derived from European legislation whereby mandatory limit values must be met
for several air pollutants. The two pollutants of most concern for the majority of areas of the UK where air quality
is a problem are nitrogen dioxide (NO2) and particulate matter (PM), derived from gasoline. Road vehicles are the
predominant sources. This section describes the legislative framework.
2.1 European Air Quality Directives
The Air Quality Framework Directive (96/62/EC) on ambient air quality assessment and management defines the
policy framework for 12 air pollutants known to have a harmful effect on human health and the environment. The limit
values for the specific pollutants are set through a series of daughter directives.
Following the above directives, Council Directive 2008/50/EC on ambient air quality and cleaner air for Europe came
into force in 2008, and was transposed into national legislation in 2010 (The Air Quality Standards Regulations 2010).
2.2 National Air Quality Legislation
2.2.1 UK Air Quality Strategy
The UK Air Quality Strategy (AQS) (Defra, 2007) sets out air quality objectives and policy options to improve air
quality and offers options for further consideration to reduce the risk to human health and the environment from air
pollution.
The AQS identifies nine ambient air pollutants that have the potential to cause harm to human health. These
pollutants are associated with local air quality problems, with the exception of ozone, which is instead considered to
be a regional problem. Similarly, the Air Quality Regulations set objectives, but for just seven of the pollutants that are
associated with local air quality.
2.2.2 Air Quality Objectives and Limit Values
The provisions of Part IV of the Environment Act 1995 establish a national framework for air quality management,
which requires all local authorities in England, Northern Ireland, Scotland and Wales to conduct local air quality
reviews. Section 82(1) of the Act requires these reviews to include an assessment of the current air quality in the area
and the predicted air quality in future years. Should the reviews indicate that the objectives prescribed in the UK Air
Quality Strategy (Defra, 2007) and the Air Quality (England) Regulations 2010 (Defra, 2010) (henceforth referred to as
the ‘Air Quality Regulations’) will not be met, the local authority is required to designate an Air Quality Management
Area (AQMA). Action must then be taken at a local level to ensure that air quality in the area improves.
The air quality objectives and limit values currently applicable to the UK can therefore be split into two groups. Each
has a different legal status and is therefore handled differently within the framework of UK air quality policy. These
are:
nnUK air quality objectives set down in regulations for the purposes of local air quality management; and
nnEuropean Union (EU) limit values transcribed into UK legislation for which compliance is mandatory.
14 GREATER MANCHESTER AIR QUALITY ACTION PLAN2.3 2015 Supreme Court Ruling
In April 2015 the Supreme Court issued a final judgement on the case brought by the NGO ClientEarth, ordering the
Government to end breaches of EU limits on nitrogen dioxide (NO2).
The legal challenge was prompted by the failure since 2010 of London and several other regions to meet EU limit values
for NO2. The court ruled that the Government must take action to cut air pollution, with a national plan to be published
by the end of December 2015. Plans were published but ClientEarth brought a further case to the High Court, which
ruled that the Government’s Air Quality Plan failed to comply with the Supreme Court ruling or relevant EU directives,
and that it must publish new plans by 31 July 2017.
Greater Manchester urban area represents one of the 38 non-compliant zones in the UK 1, due to exceedances of
the annual mean NO2 limit value. Greater Manchester is not projected to achieve compliance until 2020 without
intervention; therefore considerable and far-reaching action is required to achieve compliance, with bodies such as
TfGM providing essential support.
2.4 Air Quality Action Plans
Implementation of the AQAP will be driven by TfGM, in conjunction with the local authorities.
The Department for Environment, Food and Rural Affairs (Defra) local air quality policy guidance, LAQM.PG(16)
(Defra, 2016), recommends that AQAPs should include as a minimum the following:
i. Quantification of source contributions (e.g. HGVs, buses, taxis, other transport, industrial or domestic sources etc.)
responsible for the exceedance of the relevant objective; knowing the source of the problem will allow the AQAP
measures to be effectively targeted;
ii. Quantification of impacts of proposed measures including, where feasible, expected emission and concentration
reductions (either locally obtained and/or via national monitoring/modelling statistics). It is important that the
local authority shows how it intends to monitor and evaluate the effectiveness of the plan;
iii. Clear timescales, including milestones and expected outcomes, which the authority and other delivery partners
propose to implement the measures within the AQAP; and
iv. Defined roles and responsibilities that detail how the local authority and other delivery partners, including
transport, planning and health departments, will take ownership of the problem and in what capacity they will work
together to implement the AQAP.
This Plan, along with the Implementation Plan (see Section 13.1), considers these items.
1 http://uk-air.defra.gov.uk/assets/documents/no2ten/140708_N02_projection_tables_FINAL.pdf
AIR QUALITY LEGISLATION 153 UNDERSTANDING THE PROBLEM The air quality problem in Greater Manchester is fairly similar in nature to other urban areas in the UK and Europe. This section identifies the areas on which actions in this Plan should focus. 3.1 Air Quality Management Area Air Quality Management Areas (AQMAs) for the administrative areas in the Greater Manchester region were originally declared in 2001-2002 for both annual mean NO2 and PM10. The AQMAs were amended between 2004-2006 and they were also revoked for PM10. 10 AQMAs were subsequently declared between 2005-2006 for the whole of Greater Manchester based on the modelled 35μg/m3 isopleths for annual mean NO2, which, considering the EU Limit is 40μg/ m3, acknowledged the uncertainties of modelling and could be viewed as being cautious. Recent modelling has shown an improvement in NOx emissions and that the AQMA has reduced in size. A new single AQMA has been declared for Greater Manchester and was published on 1 May 2016. The extent of the new AQMA is shown in Figure 1. Figure 1: The Greater Manchester AQMA 16 GREATER MANCHESTER AIR QUALITY ACTION PLAN
3.2      Monitored Concentrations

NO2 is measured using both continuous and passive techniques. To provide an indication of the extent of monitoring
that has been undertaken, annual mean NO2 concentrations recorded by the Greater Manchester authorities’ (passive)
diffusion tube network in 2014 are indicated in Figure 2. Where locations are shown as having no data recorded in 2014
these sites are now closed, but these have been included to indicate the spatial distribution of the historical data set.
Particulate matter (PM10 and PM2.5) is also monitored, but at fewer locations.

The data show that there are many locations that have recorded values above or close to the annual mean NO2
objective, although it should be noted that Figure 2 includes data from both kerbside/roadside locations and from urban
background locations, so recorded concentrations can vary significantly in just a matter of metres from a road2. Over
recent years, annual mean concentrations of the order of 65μg/m3 have been measured, which gives some indication of
the challenge that the region faces.

Figure 2: Air Quality Monitoring Locations in Greater Manchester, Annual Mean NO2 Concentrations Recorded in 2014

2   To properly understand the distribution of concentrations the sites would need to be explored in greater detail. For such detail please refer to the
    most recent Greater Manchester Air Quality Progress Report (2014).

                                                                                                         UNDERSTANDING THE PROBLEM 17
3.3 Modelled Areas of Exceedance
As discussed above, the Greater Manchester councils have undertaken a detailed dispersion modelling study to identify
the existing, and projected future, areas exceeding the annual mean objective for NO2.
With regard to this AQAP, the areas exceeding the UK air quality objectives represent the ‘Key Priority Areas’. These
are areas of relevant exposure3 that tend to be adjacent to major roads and heavily trafficked areas in Manchester city
centre, or other major urban centres, across the other nine districts, and areas near the M60 and other motorways.
Figure 3: Modelled Annual Mean NO2 Concentrations in Greater Manchester
3 i.e. where members of the public are likely to be regularly present and are likely to be exposed to pollutants for a period of time appropriate to
the averaging period of the objective. Concentrations in excess of the objectives where members of the public are unlikely to be exposed should
not be considered to represent ‘relevant exposure’.
18 GREATER MANCHESTER AIR QUALITY ACTION PLAN3.4 Traffic Emissions
3.4.1 Fleet Contributions
The Emission Factors Toolkit (EFT) is a calculation tool published by Defra designed to determine pollutant emissions
from road vehicles for a specified year, road type, vehicle speed and fleet composition. The latest version (Version
6.0.2) was released in November 2014, and incorporates the most up-to-date vehicle emission factors and information
on the current and projected future vehicle fleet. The vehicle emission factors are currently based on the European
Environment Agency (EEA, 2013) COPERT 4 (v10) emission calculation tool, which includes data for all vehicle
categories from Pre-Euro 1/I to Euro 6/VI type approval standard.
Figure 4 illustrates the contributions of different vehicle types to road traffic emissions of NOx and PM10. The
figures are based on national-average fleet compositions for 2015, assuming a nominal 10% of the fleet comprising
HGVs (heavy goods vehicles >3.5 tonnes) and buses, travelling at 30mph. These data demonstrate that pollutant
emissions from these vehicles are disproportionally high compared to the number of these vehicles. Emissions from
buses are predicted to have similar emissions as goods vehicles, although public services vehicles (PSVs) are typically
concentrated on congested urban corridors where a greater number of people may be exposed.
Emissions from cars account for the major part of road traffic NOx (based on cars representing 90% of the fleet for the
purposes of this example), where most of the NOx emissions are attributable to diesel cars, which comprise 46% of the
total emissions, compared to only 6% from petrol cars.
Emissions of PM10 from diesel cars are 29%, compared to 24% from petrol cars, which in part reflects the current
understanding that a significant proportion of fine particulate emissions are due to non-exhaust sources, such as tyre
and brake wear, road abrasion and suspended material. Therefore, the difference in fuel type is of less significance for
PM10 emissions than for NOx emissions.
Figure 4: Proportions of NOx and PM10 Emissions from Road Sources
0.9% 5.8% 1.1%
14% 12.2%
23.9%
2.1% 3.6%
NOx PM
11.4%
45.8% 13.5%
16.3% 29.2%
19.7%
0.3% 0.2%
Petrol Diesel Petrol Diesel Rigid Artic Buses/ Other
Cars (%) Cars (%) LGV (%) LGV (%) HGV (%) HGV (%) Coaches (%) (%)
Other: motorcycles and alternative fuel vehicles e.g. hybrid, electric, biogas
UNDERSTANDING THE PROBLEM 193.4.2 Euro-classification Emission Profiles
Emissions standards were introduced in Europe through the Euro-rating system in 1992 in order to limit the emissions
of harmful pollutants in road vehicle exhaust. Emission profiles have been generated that relate pollutant emissions
to vehicle speed for more than 200 vehicle type/fuel type/Euro Standard combinations. These speed versus emissions
profiles are derived from the results of emissions testing and modelling of hundreds of vehicles over many years.
Examples of speed versus NOx emission profiles for HGVs, LGVs, buses and cars based on the projected 2017 vehicle
fleet mix are provided in Figure 5 to Figure 8; the profiles demonstrate the differences in terms of NOx emissions of
changing vehicle speed and Euro Standard. The emission profiles for LDVs are split into petrol and diesel. In general the
higher the Euro Standard, the lower the pollutant exhaust emissions; however, the following points should be noted:
nnFor petrol cars, Euro 5 and 64 are almost identical, and very similar to Euro 3 and 4. Emissions for Euro 2
vehicles and earlier were significantly higher.
nnFor HGVs, Euro IV vehicles have lower emissions than Euro V vehicles at speeds below 35km/hr.
nnFor diesel cars and LGVs, Euro 5 vehicles produce higher NOx emissions than Euro 4 vehicles at all speeds.
nnFor buses, a Euro V vehicle fitted with Selective Catalytic Reduction (SCR) has higher emissions than a Euro IV
bus at speeds less than 40km/hr.
Figure 5: Speed / NOx Emission Profile for Petrol Cars/LDVs
4
Pet LDV Pre-Euro 1
3.5 Pet LDV Euro 1
Pet LDV Euro 2
3 Pet LDV Euro 3
Pet LDV Euro 4
2.5
Emissions (g/km)
Pet LDV Euro 5
Pet LDV Euro 6
2
1.5
1
0.5
0
5 15 25 35 45 55 65 75 85 95 105 115
Speed (km/hr)
4 Euro nomenclature for HDVs uses roman numerals, whilst LDVs use numbers. See Glossary.
20 GREATER MANCHESTER AIR QUALITY ACTION PLANFigure 6: Speed / NOx Emission Profile for Diesel Cars/LDVs
1.8
Dsl LDV Pre-Euro 1
1.6
Dsl LDV Euro 1
Dsl LDV Euro 2
1.4
Dsl LDV Euro 3
1.2 Dsl LDV Euro 4
Emissions (g/km)
Dsl LDV Euro 5
1
Dsl LDV Euro 6
0.8
0.6
0.4
0.2
0
5 15 25 35 45 55 65 75 85 95 105 115
Speed (km/hr)
Figure 7: Speed / NOx Emission Profile for HDVs (HGVs and Buses)
25
Euro 1
Euro 2
20
Euro 3
Euro 4
Euro 5
Emissions (g/km)
15
Euro 6
10
5
0
5 15 25 35 45 55 65 75 85 95
Speed (km/hr)
UNDERSTANDING THE PROBLEM 21Figure 8: Comparison of Speed / NOx Emission Profile for Euro IV and Euro V Buses
18
16 Euro IV Bus
Euro V EGR Bus
14
Euro V SCR Bus
12
Emissions (g/km x1000)
10
8
6
4
2
0
5 15 25 35 45 55 65 75 85 95 105 115
Speed (km/hr)
22 GREATER MANCHESTER AIR QUALITY ACTION PLAN3.5 Areas with High Bus and HGV Flows
The emissions apportionment discussion in Section 3.4.1 indicates that buses and HGVs may lead to disproportionately
high emissions compared to their number within the vehicle fleet. However, the impacts due to these vehicles will
not occur equally on all roads. This is illustrated in Figure 9, which highlights road sections with greater than 7%
traffic flow of either buses or HGVs and where the modelled annual mean concentration of NO2 exceeds 36μg/m3 5.
The concentration threshold used in this plot is below the EU limit value, but was considered to be cautious, and
generally consistent with the approach used to designate the existing AQMA. High proportions of HGV movements
are concentrated on the main radial routes, including the M60 and M62 motorways, whilst high proportions of bus
movements tend to occur along relatively short sections of road within the main urban centres.
Figure 9: Roads with High Proportions of Bus or HGV Movements and High Annual Mean NO2 Concentration
5 The existing AQMA was declared based on the 35 μg/m3 contour from modelling undertaken in 2005
UNDERSTANDING THE PROBLEM 233.6 Key Priority Areas for Air Quality Action Planning
The term, ‘Key Priority Areas’ is introduced in Section 3.3. These are areas of relevant exposure identified in this
Plan that tend to be adjacent to major roads and heavily trafficked or congested areas with poor air quality, where
improvement actions would achieve the greatest effects. Specific areas which are subject to worsening air quality
from cumulative impacts from development and traffic should be the focus of priority action to mitigate public health
concerns.
3.6.1 HGVs and Buses
In order to identify the Key Priority Areas for HGVs and buses, the plan must also consider the locations where the
public are exposed to high pollutant concentrations due to HGV and bus emissions. Figure 10 and Figure 11 show the
areas with high proportions (>7%) of bus and HGV movements, where the modelled annual mean concentration of NO2
exceeds the 35μg/m3 target, and also where the road is within 50m of a property.
Based on this analysis, the priority roads for HGVs and buses are indicated in Table 1 and Table 2 respectively, along
with monitored annual mean NO2 concentrations at locations considered representative of air quality along that route
and the basic vehicle fleet split on each road.
Monitored Annual Mean NO2A Traffic Composition
Area/Road
Site ID 2013 2014 Petrol Cars Diesel Cars HGV Bus
ST18 42.8 40.5 39% 38% 10%Figure 10: Roads with High Proportions of Bus Movements and High Annual Mean NO2 Concentration near Properties
Table 2: Key Priority Areas for Bus Interventions
Monitored Annual Mean NO2A Traffic Composition
Area/Road
Site ID 2013 2014 Petrol Cars Diesel Cars HGV Bus
B5117 Oxford Road MA82 60.2 63.0 39% 25% 1% 26%
A6 Broad Street - - - 49% 30% 1% 10%
A664 Rochdale Road MA85 42.9 53.5 45% 28% 3% 13%
Manchester city centre B C MA24 46.9 50.3 0% 0% 0% 100%
Oldham town centre B - - - 17% 11% 0% 66%
Rochdale town centre B RO11A 49.3 45.7 49% 31% 1% 11%
Bury town centre B 48% 30% 1% 12%
Bolton town centre B BO8 - 33.3 40% 25% 2% 26%
Wigan town centre B - - - 40% 26% 1% 21%
Stockport town centre B C ST18 42.8 40.5 0% 0% 0% 100%
Note: A
Example of recorded data on, or near, this road
B
Example of road in the town centre used to demonstrate an example of a road with high bus flow in this area
Traffic flow composition data from the EMIGMA model.
C
Bus-only routes
UNDERSTANDING THE PROBLEM 25Figure 11: Roads with High Proportions of HGV Movements and High Annual Mean NO2 Concentration near Properties 3.6.2 Cars Private cars typically represents >70% of the vehicle movements on most roads, and so the influence of cars is significant in most areas where high pollutant concentrations have been identified. Furthermore, the large proportion of cars also influences areas of congestion due to the road space taken up by the vehicles. Figure 12 shows the roads with high car traffic volumes in areas of high pollutant concentrations and within 25m of properties, and shows that these roads are distributed throughout the region, and are not focused on main routes or urban centres. Therefore, actions to reduce emissions from private cars should target the whole fleet with less focus on the Key Priority Areas identified for HGVs and buses, and the Key Priority Areas for cars should include all roads where the pollutant concentrations exceed 35μg/m3 and have properties within 25m. Detailed information about the car fleet composition will be required to properly understand the emissions arising from this component of the fleet, as the age, fuel-type and typical journey length will determine the emissions profile. This in turn will ensure that effective control measures can be considered, such as targeting older vehicles in some areas, or specific fuel types in other areas. 26 GREATER MANCHESTER AIR QUALITY ACTION PLAN
Figure 12: Roads with High Proportions of Car Movements and High Annual Mean NO2 Concentration near Properties

3.6.3 Summary of Key Priority Areas
This analysis indicates where targeted Actions should be implemented, although the relationship between different
effects should also be recognised. For example, bus interventions may affect car use due to the model shift between
travel types, whereas public/private transport interventions are unlikely to affect HGV or other freight movements due
to the type of journey.

The population data used to identify the Key Priority Areas do not include socio-economic data, where people living in
economically deprived areas may be more sensitive to poor air quality and should, therefore, be prioritised. This has
been considered within the actions and will be incorporated within the Health Impact Assessment (action 7.4).

                                                                                 UNDERSTANDING THE PROBLEM 27
4 CURRENT AIR QUALITY IMPROVEMENT INITIATIVES
Significant effort has been made over the last decade to improve air quality across Greater Manchester. This
section does not set out to document the progress made in detail, but it does highlight the key initiatives.
4.1 Greater Manchester Air Quality Strategy and Air Quality Action Plan
The Greater Manchester Air Quality Strategy and Action Plan (AGMA, 2006) sets out a wide-reaching package of
measures to address air pollution from road transport, with a particular focus on achieving EU limits for NO2 by 2010.
Actions included in the Plan were divided into the following categories:
nnPhysical improvements to the transport network to give priority to passenger transport and cycling
nnRegulation and enforcement to improve co-ordination between various agencies to reduce pollution, for
example, from poorly tuned engines or through idling vehicles
nnSmarter choices to make it easier for residents, businesses and visitors in Greater Manchester to contribute to
reducing pollution and carbon emissions through their own actions
nnPlanning policy and development
nnCleaner technology, fuels and practices
nnImproved partnership working with other organisations.
Key air quality objectives from the Strategy and Action Plan were also transposed into Local Transport Plan 2011-
2016 (LTP3), which incorporated the Air Quality Local Transport and Implementation Plan. The overall strategy for
improving air quality in Greater Manchester defined in the Implementation Plan was focused on:
nnIncreasing travel by sustainable modes
nnReducing acute pollution incidents from traffic
nnImproving vehicle efficiency, including vehicle and fuel technology and efficient driving techniques
nnEncouraging smarter travel through improved fares, ticketing and information, management of demand for car
travel and promotional campaigns
nnBetter integration of transport and new development
nnReducing trips by motor vehicles by improvements to public transport and to infrastructure for walking and
cycling
nnImproving network efficiency.
4.1.1 Air Quality Strategy and Action Plan Progress
Progress on the Action Plan was reported in the LTP3 Progress Report 2014 (GMCA, 2014). In the short term, options to
reduce acute pollution incidents from traffic and to improve vehicle efficiency included:
nnAn annual programme of vehicle emissions testing on major transport corridors;
nnExtending the enforcement of idling vehicles, which is already carried out in the regional centre, to town and
district centres;
28 GREATER MANCHESTER AIR QUALITY ACTION PLANnnTargeted renewal of buses on routes into the regional centre and in adjacent areas where permitted levels of
pollutants are exceeded;
nnSupporting/lobbying central Government for a national HGV scrappage scheme and working with the
Government on complementary regulation measures; and
nnCo-ordinating the uptake of Safe and Fuel Efficient Driving (SAFED) training for smaller freight and bus
operators and promoting continued updates to driving skills through a best-practice scheme.
However, the Action Plan has not achieved the improvements that were hoped for, since the impact of the
individual measures often reduced overall emissions across the conurbation whilst changes on individual roads were
imperceptible. Therefore, future actions are proposed to be focused on the most beneficial options within specific
geographic areas, such as the roads within the AQMA and, in the context of this plan, the Key Priority Areas.
CURRENT AIR QUALITY IMPROVEMENT INITIATIVES 295 ADDITIONAL CONSIDERATIONS IN
DRAWING UP THIS AQAP
Air quality improvements can be achieved in many ways, relying on interventions that can complement one
another and can take effect over months and years.
5.1 Key Performance Indicators
Actions to improve local air quality by reducing emissions from road vehicles may focus upon reducing the total
number of vehicle movements or target a specific component of the vehicle fleet, such as buses or HGVs, to achieve an
improved emission performance.
The Air Quality Strategy and Action Plan (GMCA, 2006) and the 2013/2014 Air Quality Progress Report (GMCA, 2014)
included a range of transport-related measures that were intended to focus on the following objectives:
nnReducing trips by motor vehicles
nnImproving vehicle efficiency through vehicle and fuel technology and efficient driving techniques.
The objectives from the 2006 Plan were used to inform the Key Performance Indicators (KPIs) in this Action Plan for
changes to the fleet that may lead to local air quality effects, as shown in Table 3 along with examples. These KPIs are
used to show how each of the actions may improve local air quality.
The KPIs are colour-coded throughout this document so as to easily see how each action may improve air quality.
In addition to these KPIs, it may also be possible to reduce exposure by redistributing traffic away from the Key Priority
Areas, or to avoid introducing new developments in these areas. However, these options will not necessarily lead to
long-term local air quality improvements and may lead to a redistribution of the areas of high pollutant concentration,
and so this is not considered to be a sustainable KPI.
Table 3: Key Performance Indicators for local air quality
KPI Example
Reduce the number of vehicle movements, either during peak hours or more generally. This may
Reduce Traffic affect the whole fleet or only part of it.
E.g. reduce the number of private cars by redistribution onto public transport.
Improve the traffic flow to reduce congestion and achieve lower emissions from the existing
fleet.
Increase Efficiency
E.g. changing speeds to achieve less stop-start movement or more efficient driving profiles,
such as through variable speed limits, traffic light timing or driver education.
Change the composition of the existing fleet to increase the proportion of low-emission vehicles.
Improve Fleet E.g. displace older vehicles in favour of newer vehicles that achieve a high Euro engine emission
standard or have ultra-low-emissions, such as Electric Vehicles (EVs).
30 GREATER MANCHESTER AIR QUALITY ACTION PLAN5.2 Existing Programmes
The existing policies, programmes and schemes being undertaken by TfGM and district authorities were reviewed to
identify where they include air quality as a consideration. However, many of these policies do not explicitly define how
they will be implemented, or what the magnitude and extent of the air quality effects will be. Therefore, the actions in
this Plan build on a number of the existing programmes outlined in the following sections:
nnLocal and Greater Manchester-wide policies, which outline the Greater Manchester-wide strategies, are
discussed in Appendix A. Where an action is intrinsically linked to an existing policy or fund, this has been
identified within the relevant action.
nnInfrastructure improvement schemes, which will have discrete local air quality effects due to changes to traffic
flow or travel behaviour, are identified in Appendix B.
5.3 Responsibility and Resources
The Action Plan will be led and coordinated by TfGM, whilst the commitment to implement the actions is undertaken
jointly by TfGM and the regional stakeholders, such as local authorities. Where financial or staff resources are required,
TfGM will coordinate the requirements and resources with the aim of achieving the action.
A detailed implementation plan to appraise the actions and to define how they will be undertaken will be created after
the actions have been adopted. The components of the implementation plan are outlined in Section 13.1.
5.4 Structure of Actions
The types of policies and interventions that make up the actions have been divided into the following broad subjects,
based on the area and type of effects that may be achieved:
nnSection 6, Actions for Development Control and Planning Regulation
nnSection 7, Actions for Freight and Heavy Goods Vehicles
nnSection 8, Actions for Buses, including route management
nnSection 9, Actions for Cycling
nnSection 10, Actions for Travel Choices
nnSection 11, Actions for Cars
nnSection 12, Actions for Information and Resources, such as websites.
5.5 Measuring Effects
The local air quality effects of discrete programmes, schemes and interventions may not be measurable (by measuring air
quality) due to the cumulative effects of different schemes and other factors. Previous efforts to improve air quality in the
region also did not necessarily consider the measurability of the actions where it was assumed improvements would occur,
whilst tangible beneficial effects were not always achieved and could not be attributed to individual actions.
Therefore, although air quality will continue to be measured, it will not always represent the level of success for the
defined actions. Whilst air quality improvements are the goal of this Plan, it is often more appropriate to measure
another parameter that should directly or indirectly affect air quality. Such a parameter could be bus patronage, or
proportion of electric vehicles registered. Appropriate means of measuring effects for each action will be identified in the
Implementation Plan, and will be linked to the KPI for each action.
Where possible, air quality effects will be measured for discrete schemes, although this will likely be possible only for
significant infrastructure projects, such as new roads, where a pre and post-development monitoring campaign would be
used to measure changes in air quality.
ADDITIONAL CONSIDERATIONS IN DRAWING UP THIS AQAP 315.6 Timescales
The actions have been attributed approximate timescales for the effect on local air quality to take place, and which will
be outlined in greater detail in the Implementation Plan (see Section 13.1). Timescales for the various actions that will
be implemented to improve local air quality may be impacted by new Government legislation.
Long-term actions are essential to create the groundwork to achieve an integrated low-emission transport
infrastructure within the 25-year timescale of the 2040 Transport Strategy. These actions include large-scale
infrastructure projects, such as electric charging points and cycleways.
Medium-term actions are intended to have an effect over the three-to-four years following the initial adoption of
the Action Plan. These include: drivers, incentives and penalties to change people’s behaviour through education
and opportunities for alternative modes of travel. These actions will also increase the rate of the fleet turnover, in
order to achieve a low-emission fleet sooner than may otherwise be achieved. They include policies that will have
increasing effect over time, but also transport infrastructure and regulation that will have an abrupt effect following
implementation.
Short-term actions may be implemented within a matter of months, and are intended to achieve local air quality
benefits in the Key Priority Areas through travel planning and development control.
5.7 Priority Actions
The Low-Emission Strategy came to the conclusions about which types of action would be most effective. At this
stage, the actions have not been ranked in order of priority, although they will each achieve different air quality effects
within different timescales and financial budgets. The prioritisation of individual actions will be outlined in the
Implementation Plan, with thorough consideration of factors such as cost, benefit and timescale.
Where the implementation of an action is dependent on another action going ahead, this has been identified.
5.8 Complementary Effects
Many actions may have complementary effects on the following:
nnNoise: Increased uptake of new vehicle technology such as electric vehicles and reduced traffic conditions will
generally contribute to reduced noise.
nnClimate change and carbon emissions: It has recently become more apparent that programmes and policies
to reduce carbon emissions have occasionally led to deterioration in local air quality, such as the promotion of
the diesel car fleet. Therefore, the potential effects on climate change have been considered in the actions to
ensure that complementary effects are achieved.
nnSocial inclusion: It is essential that the actions do not adversely affect the most vulnerable social groups in the
region, where the poorest social groups are often most susceptible to changes in air quality, and are also most
likely to be reliant on public transport.
32 GREATER MANCHESTER AIR QUALITY ACTION PLANYou can also read