GRAPHWAGU: GPU POWERED LARGE SCALE GRAPH LAYOUT COMPUTATION AND RENDERING FOR THE WEB
←
→
Page content transcription
If your browser does not render page correctly, please read the page content below
Eurographics Symposium on Parallel Graphics and Visualization (2022)
R. Bujack, J. Tierny, F. Sadlo (Editors)

                 GraphWaGu: GPU Powered Large Scale Graph Layout
                      Computation and Rendering for the Web

                              Landon Dyken1 , Pravin Poudel2 , Will Usher3 , Steve Petruzza2 , Jake Y. Chen1 , Sidharth Kumar1
                                                                1 University   of Alabama at Birmingham
                                                                        2 Utah    State University
                                                                                    3 Intel

         Abstract
         Large scale graphs are used to encode data from a variety of application domains such as social networks, the web, biological
         networks, road maps, and finance. Computing enriching layouts and interactive rendering play an important role in many of
         these applications. However, producing an efficient and interactive visualization of large graphs remains a major challenge,
         particularly in the web-browser. Existing state of the art web-based visualization systems such as D3.js, Stardust, and NetV.js
         struggle to achieve interactive layout and visualization for large scale graphs. In this work, we leverage the latest WebGPU
         technology to develop GraphWaGu, the first WebGPU-based graph visualization system. WebGPU is a new graphics API that
         brings the full capabilities of modern GPUs to the web browser. Leveraging the computational capabilities of the GPU using this
         technology enables GraphWaGu to scale to larger graphs than existing technologies. GraphWaGu embodies both fast parallel
         rendering and layout creation using modified Frutcherman-Reingold and Barnes-Hut algorithms implemented in WebGPU
         compute shaders. Experimental results demonstrate that our solution achieves the best performance, scalability, and layout
         quality when compared to current state of the art web-based graph visualization libraries. All of our source code for the project
         is available at https://github.com/harp-lab/GraphWaGu.

1. Introduction                                                                         visualizing such large scale graphs is challenging, as the massive
                                                                                        number of nodes and edges poses a severe computational and ren-
A graph is used to represent connected entities and the relation-
                                                                                        dering challenge. This problem is further exacerbated for web-
ships between them. Graphs are ubiquitous, appearing in many ap-
                                                                                        based visualization systems. The web browser has become the pre-
plication domains, such as social networks, the web, the semantic
                                                                                        ferred modality for data visualization, as it provides a standardized
web, road maps, communication networks, biology, and finance. It
                                                                                        cross-platform environment through which applications can be de-
is common to process and analyze graphs for the purpose of ex-
                                                                                        ployed to users. Existing state of the art web based graph visual-
tracting features such as connected components, cliques/triangles,
                                                                                        ization libraries such as D3.js [BOH11], Cytoscape.js [FLH∗ 16],
and shortest paths [JDG∗ 20, HJC∗ 19]. There are many produc-
                                                                                        and Stardust [RLH17] struggle to achieve interactive rendering and
tion level graph mining [CDGP20, KG19, TFS∗ 15, AN16] and an-
                                                                                        layout creation for such large scale graphs.
alytic [DGH∗ 19, NLP13] systems to perform these kinds of tasks.
Visualizing graphs [HMM00] where nodes and edges are mapped
                                                                                           To deal with visualizing large graphs, existing state of the art
and projected to the 2D plane is another crucial task. There are
                                                                                        graph mining and analytic systems perform concurrent parallel ex-
many applications of graph visualization, including community de-
                                                                                        ecution, leveraging either shared memory parallelism on GPUs or
tection [CBP14], cluster analysis [AVHK06, EF96], and summa-
                                                                                        distributed parallelism through MPI. Existing web-based graph vi-
rizing and understanding [KKVF15] the overall structure of con-
                                                                                        sualization libraries, however, have either been limited to serial ex-
nected data. There are two aspects associated with visualizing a
                                                                                        ecution on the CPU, as in D3.js, or have leveraged GPU capabil-
graph in 2D, layout creation (also referred to as graph drawing),
                                                                                        ities for rendering only, as in Stardust.js. These limitations have
where Cartesian coordinates are computed for every node of the
                                                                                        caused existing web-based graph visualization systems to struggle
graph, and rendering, where nodes and edges are rendered to an
                                                                                        with scaling to large graphs while maintaining interactivity. We-
image based on the computed layout. In this paper, we limit the
                                                                                        bGPU [Web] is a new technology that enables addressing this lim-
discussion of layout creation and rendering to undirected graphs.
                                                                                        itation in the web browser. Currently in development for all ma-
   With the advent of big data and large scale applications lever-                      jor browsers, WebGPU is a low-level graphics API similar to Di-
aging HPC resources, we are observing graphs of increasing                              rectX 12, Vulkan, and Metal, that brings the advanced rendering
sizes [SMS∗ 17], with millions of vertices and edges. Interactively                     and computational capabilities of modern GPUs to web browser

© 2022 The Author(s)
Eurographics Proceedings © 2022 The Eurographics Association.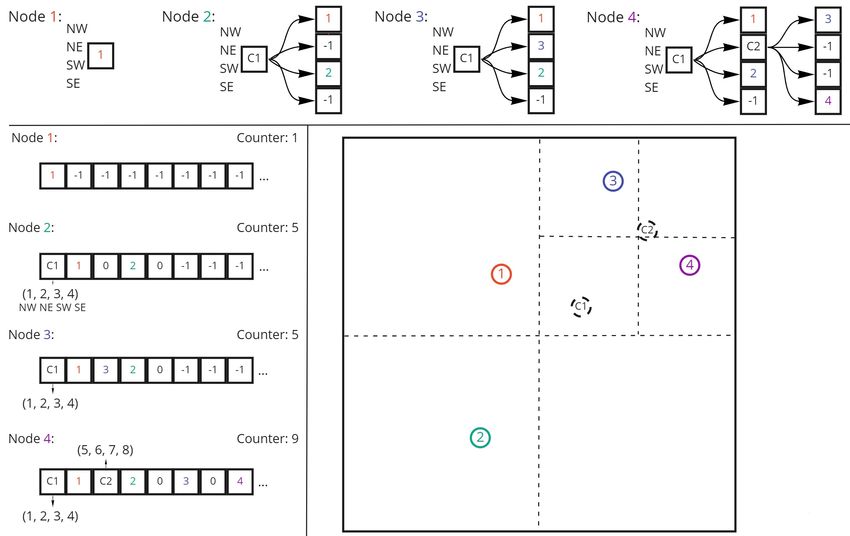
Dyken et al. / GraphWaGu: GPU Powered Large Scale Graph Layout Computation and Rendering for the Web

applications. Compared to WebGL [Gro22], the current standard              spring-electric model as a modification to the SE algorithm that
for GPU rendering on the web which is used by Stardust [RLH17]             imitates a physics simulation where vertices map to electrical par-
and NetV.js [HPZC21] to accelerate rendering, WebGPU provides              ticles and edges correspond to springs following Hook’s law. In this
a significant increase in GPU capabilities. Specifically, WebGPU           method, attractive forces are computed between adjacent nodes that
provides compute shaders and storage buffers, which are essential          pull them together, and repulsive forces are computed between ev-
for implementing computational algorithms on the GPU.                      ery pair of non-adjacent nodes that repel them from each other. The
                                                                           algorithm defines an ideal length l where these forces will cancel
   We have developed a web-based graph visualization library,
                                                                           out, distance duv as euclidean distance between u and v, and com-
GraphWaGu, that uses WebGPU to leverage the GPU’s compu-
                                                                           putes attractive forces ( fa ) and repulsive forces ( fr ) as follows:
tational power for layout creation and rendering for undirected
graphs in 2 dimensions. By doing so, GraphWaGu is capable of                                      duv 2
                                                                                       fa (d) =         where u ̸= v and eu,v ̸∈ E
visualizing large-scale networks at interactive frame rates. In par-                                l
ticular, we make the following specific contributions:
                                                                                                         −l 2
• The first parallel and scalable WebGPU based graph rendering                                fr (d) =        where eu,v ∈ E
                                                                                                         duv
  system, capable of rendering up to 100,000 nodes and 2,000,000
  edges with interactive frame rates (≥ 10 FPS)                            When the algorithm reaches a state of equilibrium or minimum en-
• The first parallel WebGPU based implementation of force di-              ergy, the layout computed tends to have edges of uniform length l
  rected layout computation using the Frutcherman-Reingold al-             and satisfying distance between separate connected components.
  gorithm.                                                                    The force directed FR algorithm is an iterative process; ev-
• An optimized parallel implementation for force directed layout           ery iteration moves vertices by computing attractive and repul-
  computation using quadtree generation and traversal for Barnes-          sive forces until a suitable layout is obtained. In each iteration,
  Hut simulation in WebGPU compute shaders (without recursion              the cost to compute repulsive forces between every pair of nodes
  or use of pointers).                                                     is O(|V |2 ) and the cost to compute the attractive forces of ev-
• Experimental studies to compare the performance and scalabil-            ery edge is O(|E|). Due to the O(|V |2 ) repulsive force calcula-
  ity of our WebGPU solutions against state of the art web-based           tion, this method is computationally expensive for graphs with
  graph visualization libraries. For 100,000 nodes and 2,000,000           large numbers of nodes and non-interactive at scale. A number of
  edges, we maintain rendering frame rates 4× higher than the              works have been proposed to address this issue, such as a grid-
  next best library (NetV.js) and layout creation times up to half         variant algorithm [FR91], Fast Multipole Method [HK00], Barnes-
  that of D3.js.                                                           Hut (BH) approximation [BH86], Well-Separated Pair Decompo-
                                                                           sition [LWZ15], Random Vertex Sampling [Gov19], and combi-
2. Background and Related Work                                             nations of these [Gov19]. These can reduce the repulsive force
                                                                           computation to O(|V |log|V |), or even O(|V |) for Random Vertex
In this section we cover relevant background work for both phases          Sampling. BH is one of the most popular techniques among these
of graph visualization: graph layout creation and rendering. We            techniques due to its simplicity. BH utilizes a quadtree data struc-
then briefly discuss the key features of WebGPU that we leverage           ture to approximate forces between nodes when they are distant
in GraphWaGu.                                                              from each other, allowing the computation of repulsive forces with
                                                                           O(|V |log|V |) average cost.
2.1. Layout Creation                                                          Prior work has also explored parallelizing graph layout creation.
                                                                           Brinkmann et al. [BRT17] parallelized the ForceAtlas2 [JVHB14]
A graph G is comprised of a vertex (or node) set V and an edge
                                                                           algorithm, while Grama et al. [GKS94] and Burtscher and Pin-
(or link) set E, with cardinalities |V | and |E| respectively. When
                                                                           gali [BP11] dealt with parallelizing the quadtree construction and
rendering a graph, every vertex is projected on a 2D plane, where
                                                                           traversal steps necessary for BH. There have also been efforts to
the position of a vertex v is denoted by Pv . In this paper, we choose
                                                                           improve performance by CPU parallelization, with Tikhonova and
to restrict our discussion to only undirected graphs. We define two
                                                                           Ma [TM08] using a pre-processing step and grouping of vertices.
nodes u and v in G to be adjacent to each other if and only if eu,v ∈
                                                                           These works successfully improved the speed and scalability of
E.
                                                                           force directed layout creation, but are limited to GPU programming
   Pioneering work by Eades [Ead84] proposed the spring embed-             frameworks like CUDA and OpenCL. We propose a unique parallel
der algorithm (SE) to generate aesthetically pleasing layouts by           implementation of layout creation in the web written completely in
treating undirected graphs as mechanical systems of steel balls            the WebGPU shading language (WGSL) [wgs].
(nodes) and springs (edges). The spring force acting between nodes
attracts or repels them from each other depending on the distance
                                                                           2.2. Graph Rendering
between them, bringing change to the energy of system. The nodes
are allowed to move from their initial placement due to these spring       Several visualization frameworks provide APIs to render graphs in
forces until a global minimum energy state is attained. There have         the web, with some of the most popular being D3.js [BOH11], Cy-
been multiple further works such as the KK method [KK∗ 89] and             toscape.js [FLH∗ 16], and Stardust [RLH17]. Most of these visu-
Frutherman and Reingold (FR) force directed algorithm [FR91] to            alization frameworks use Canvas API [con22a] or SVG [con22b]
generate aesthetic graph layouts. The FR algorithm introduces a            to render, which are poor in terms of scalability and performance.

                                                                                                                                          © 2022 The Author(s)
                                                                                                   Eurographics Proceedings © 2022 The Eurographics Association.
Dyken et al. / GraphWaGu: GPU Powered Large Scale Graph Layout Computation and Rendering for the Web
The Canvas API performs better than SVG, but the ability of both Together, these features establish a user-friendly prototype for com-
to handle large-scale data with real time interaction is limited com- puting, evaluating, and recomputing graph layouts on the web. We
pared to GPU-accelerated technologies. This can be observed in structure this section by first discussing the graph rendering in or-
Figure 3. The WebGL API is a more scalable and powerful alter- der to introduce how GraphWaGu handles redrawing the changing
native to Canvas API and SVG but requires users wanting visual- of node positions that comes with interactivity and force directed
izations to create their own rendering pipeline with shader code. layout iteration, then propose our algorithms for computing layouts
In recent years though, new WebGL-based tools provide the neces- with and without BH approximation.
sary abstractions to perform easy rendering of large-scale graphs.
Examples of such libraries are Stardust, Sigma.js [Coe18], and
3.1. Graph Rendering
NetV.js [HPZC21]. Among these, Stardust presents itself as a com-
plement to D3.js whereas Sigma.js uses a separate library, graphol- The GraphWaGu approach to graph rendering is built to take ad-
ogy [Pli21], to manage its graph model. NetV.js [HPZC21] also vantage of the unique features of WebGPU for web-based graphics
uses WebGL and promises higher scalability thanks to its concise using bind groups and large storage buffers. At system initializa-
programming interfaces which allow an efficient way of storing tion, we create rendering pipelines for nodes and edges, with bind
and manipulating graph data. Although WebGL based libraries like groups containing edge and node storage buffers, and then start an
NetV.js promise good rendering ability, their overall performance animation frame to continuously run these pipelines’ render passes.
is still limited by the limitations of WebGL, and they must rely on The edge buffer consists of 2 ∗ |E| uint32s corresponding to the in-
serial graph layout libraries like D3.js for graph generation. dices of each edge’s source and target nodes, and the node buffer is
filled with 2 ∗ |V | float32 positions. For view changes such as pan-
ning and zooming, events are captured by an HTML canvas con-
2.3. WebGPU troller and new view parameters are written to a uniform buffer,
WebGPU is a new graphics API that brings the full capabilities while changes to the node and edge data buffers can be written by
of modern GPUs to the web browser. WebGPU is built from the WebGPU API calls in the CPU or by shaders running on the GPU.
ground up, complete with its own shading language WGSL. In For both pipelines, vertex buffers of one element are used to de-
contrast to WebGL, WebGPU is not a port of an existing native scribe the type of primitive to be drawn; for edges a line and for
API, though it is designed to easily map to modern APIs like Di- nodes two triangles in the form of a square. A draw call is made to
rectX12, Vulkan, and Metal for performance, and draws inspiration instance |V | nodes and |E| edges, and in each vertex shader, the in-
from them in its design. stances access their corresponding element in the storage buffers
and return its position to the rest of the pipeline. For edges, a
WebGPU provides a number of advantages over WebGL for
color is simply returned in the fragment shader. For nodes, a check
developing complex compute and rendering applications in the
around the radius is made and the fragment alpha is computed as
browser. WebGPU enables rendering applications to construct a de-
1 minus the sigmoid of the distance of the fragment to the node
scription of the rendering or compute pipeline state ahead of time,
center to simulate anti-aliasing.
specifying the shaders, input and output data locations, and data
layouts, to build a fixed description of the pipeline. Data are fed to There are two main advantages to this approach. First, the po-
the pipeline through bind groups, whose layouts similarly encode sition of edges does not have to be pre-computed in order to cre-
ahead of time the structure of the data to be provided to the pipeline, ate and fill a vertex buffer. When node positions change, the edge
while allowing the buffers being read or written to be changed ef- vertex shader will freely output the correct position by checking
ficiently at execution time. The pre-configured state stored in the against the node storage buffer. Second, the storage buffers can be
pipeline significantly reduces state configuration overhead costs in- used in other WebGPU pipelines, e.g. to write new node positions
curred during execution, while still allowing flexibility as to what each iteration of GraphWaGu force directed compute shaders. This
data buffers are read or written when the pipeline is executed. Fur- saves the time of copying data from the source of the graph layout
thermore, WebGPU supports compute shaders and storage buffers, computation to the rendering tool.
providing unique support for developing GPU algorithms capable
of processing large data sets in the browser. Prior work on deep
3.2. Graph Layout Computation
neural networks [HKUH17] and scientific visualization [UP20] has
leveraged the capabilities of WebGPU to deploy large-scale GPU We present algorithms GraphWaGu FR and GraphWaGu BH for
parallel compute applications in the browser. Frutcherman-Reingold and Barnes-Hut approximate force directed
layouts respectively. Iterations of the algorithms are computed and
applied to nodes using WebGPU compute passes. These compute
3. Implementation passes are run parallel to the render passes of the GraphWaGu ani-
We implement rendering and force-directed layout techniques in mation frame, so that as new node positions are computed and ap-
our tool, GraphWaGu, a web-based GPU-accelerated library for plied, a new graph is rendered.
interacting with large-scale graphs. GraphWaGu utilizes WebGPU
3.2.1. WebGPU Frutcherman-Reingold
to create visualizations from input graphs onto mouse-interactive
HTML Canvas5 elements. GraphWaGu also presents GPU imple- Before running the GraphWaGu FR algorithm, we initialize the
mentations of Fruchterman-Reingold and Barnes-Hut approximate compute pipelines needed: adjacency matrix creation, force calcu-
force-directed layout algorithms using WebGPU compute shaders. lation, and force application with their respective compute shaders
© 2022 The Author(s)
Eurographics Proceedings © 2022 The Eurographics Association.Dyken et al. / GraphWaGu: GPU Powered Large Scale Graph Layout Computation and Rendering for the Web
Algorithm 1 GraphWaGu FR parallelizing the repulsive force computation this method struggles
1: Input: G(V, E), coolingFactor to scale to very high node counts as the exact force computation
2: for e in E do incurs O(|V |2 ) cost. This requires us to implement some method of
3: ad jacencyMatrix[e.source + e.target ∗ |V |] = 1 approximating these forces, for which we use BH approximation to
4: ad jacencyMatrix[e.target + e.source ∗ |V |] = 1 achieve O(|V |log|V |).
5: end for
6: while coolingFactor ≥ ε do Algorithm 2 GraphWaGu BH Algorithm
7: for i ← 0 to |V | do in parallel 1: Input: G(V, E), coolingFactor
8: f =0 2: createSortedEdgeLists();
9: v = V [invocationId] 3: while coolingFactor ≥ ε do
10: for i ← 0 to |V | do 4: createQuadTree();
11: if ad jacencyMatrix[invocationId + i ∗ |V |] then 5: for v ← 0 to |V | do in parallel
12: f ← f + fa (v,V [i]) 6: for ei, j in E with i or j = v do
13: else 7: F[v] ← F[v] + fa (V [i],V [ j])
14: f ← f + fr (v,V [i]) 8: end for
15: end if 9: end for
16: end for 10: computeRepulsiveForces();
17: F[invocationID] = | ff | ∗ min(coolingFactor, | f |) 11: for i ← 0 to |V | do in parallel
18: end for 12: V [i].position ← V [i].position + F[i]
19: for i ← 0 to |V | do in parallel 13: F[i] ← 0
20: V [i].position ← V [i].position + F[i] 14: end for
21: end for 15: coolingFactor ← coolingFactor ∗ initialCoolingFactor
22: coolingFactor ← coolingFactor ∗ initialCoolingFactor 16: end while
23: end while
3.2.2. WebGPU Barnes-Hut
and necessary bind group layouts. An overview of the general algo- The Barnes-Hut approximation algorithm [BH86] has multiple
rithm used in WebGPU Frutcherman-Reingold is detailed in Algo- challenges to be effectively implemented in parallel systems. This
rithm 1. It follows closely to the original force directed algorithm task has been addressed in previous work by [BP11], where they
proposed by Frutcherman and Reingold, apart from the use of an showed an efficient method of optimizing this process in CUDA
adjacency matrix and parallel computation of forces. utilizing barriers and thread-voting functions. The Barnes-Hut al-
gorithm involves building and traversing a quadtree data structure,
An adjacency matrix A for a graph G is defined as a |V | by |V |
two tasks typically implemented through recursion, with nodes
matrix where A(i, j) is 0 when (i, j) is not in E and 1 when (i, j) is.
having pointers to their children, and dynamic allocation storage in
This structure allows us to check for edges in the force calculation
a heap to hold the tree. Recursion, pointers, and dynamic allocation
shader in O(1) time to decide whether to compute attractive or re-
at runtime are not supported in programming compute shaders in
pulsive forces for that node. If an adjacency matrix or similar data
WebGPU. Methods for building quadtrees in parallel do exist such
structure is not used, attractive forces must be computed separately
as through the use of linear quadtrees [Gar82], and are depicted in
from repulsive forces in O(|E|) time. A concern when using an ad-
work such as [Kar12], but these are not adapted specifically for the
jacency matrix is that it can require a large amount of memory, as
task of layout creation and often rely on structures and GPU pro-
its size grows exponentially with |V |.
gramming functions not currently available in the WebGPU API.
To address this, we note that each element of the adjacency ma- We present our own methods of building and traversing a quadtree
trix requires only one bit to track whether two nodes are connected in compute passes on the GPU compatible with the WebGPU API.
or not. We create the adjacency matrix with |V | × |V | bits and ac- Our quadtree implementation utilizes one of the two approaches
cess individual entries through bitwise operations and shifts in the described by [Sam90] for pointerless representations, treating the
compute shader. A simplified depiction of this is in lines 2-5 of quadtree as a collection of its leaf nodes, with directional codes for
Algorithm 1 indexes of its northwest (NW), northeast (NE), southwest (SW),
and southeast (SE) children. From the same source, we can also
Force computation is shown in lines 7-18 of Algorithm 1, where
obtain the weak upper bound of 6 ∗ |V | as an appropriate limit to
either repulsive or attractive forces are calculated for each vertex
the total number of items in our quadtree, including null pointers.
to each other vertex using the adjacency matrix, and application is
shown in lines 19-21. We parallelize the FR force directed algo- We safely initialize a WebGPU buffer of length 6 ∗ |V | to contain
rithm by dispatching one GPU thread per node, effectively running all items within the quadtree, where each item is a struct with empty
a parallel for loop over the node buffer and computing or applying attributes for its boundary rectangle, center of mass, mass, and in-
forces for each. This method runs into issues when |V | is above dices of NW, NE, SW, and SE children in the same buffer. This
65,535, as that is the maximum supported dispatch size in We- buffer is bound to a compute pipeline which runs at the beginning of
bGPU. To address this we create batches of nodes of 50,000, and each GraphWaGu BH layout iteration. When creating a quadtree, a
run a separate compute pass for each batch. However, even with bounding box must first be computed containing all of the nodes of
© 2022 The Author(s)
Eurographics Proceedings © 2022 The Eurographics Association.Dyken et al. / GraphWaGu: GPU Powered Large Scale Graph Layout Computation and Rendering for the Web
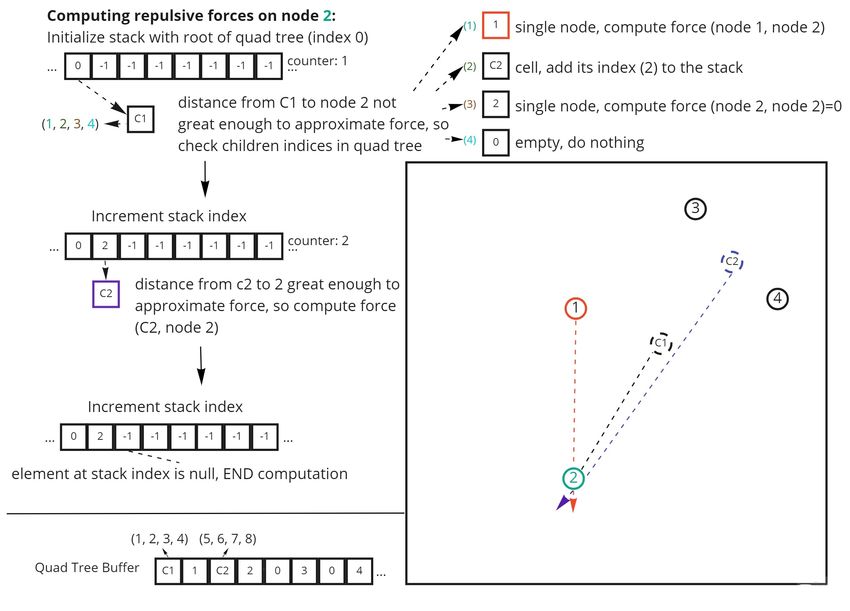
Figure 1: Inserting a 4 node graph into an empty quadtree. At the top, a visualization of the classic quadtree creation using pointers and
dynamic allocation is shown, from left to right. To the left of the example graph, the same sequence of insertions is shown for the GraphWaGu
BH algorithm into our quadtree buffer, from top to bottom. In the first insertion, the quadtree struct at index 0 is set to the first node, and
counter is made 1. At insertion 2, a partition is made, so the 0 spot in our buffer becomes cell C1 with center of mass between 1 and 2, its
NW, NE, SW, and SE attributes are set, and counter increments by 4. Insertion 3 changes the center of mass of C1, and insertion 4 does the
same and requires another partition to make C2. Ellipses at the end of each buffer indicate the array should be size 6 ∗ |V | = 24, -1 refers to
null items, and 0s are empty quadtree structs.
the input graph. In order to simplify this step and maintain robust- each node in parallel, dispatching a thread for each node which then
ness for our float32 node positions, GraphWaGu BH forces all node iterates through the list of edges it is a part of and accumulates at-
positions within the range [0, 1] by clamping values when forces tractive forces. This is seen in lines 5-9 in Algorithm 2. The same
are applied to change node positions. Because duplicate node posi- force buffer is then used for the repulsive force pass, taking in the
tions can lead to loops of partitioning when creating a quadtree, this result of the attractive forces and returning the total force results. In
clamp also applies a small position randomization on the bound- order to traverse the quadtree to compute Barnes-Hut approximate
aries. The first step of the creation shader then is to declare a root repulsive forces for each node, a large buffer is sent to be used as
node with boundary rectangle [0, 0, 1, 1] and a counter variable to a pseudo-stack by the repulsive force compute shader described in
keep track of the latest insertion into the quadtree buffer. A for loop line 10 of Algorithm 2. Because the average height of a quadtree is
is then run to insert all nodes from the node data buffer. Each node O(log4 |V |), each traversal will add around this many items to the
insertion is accomplished iteratively, incrementing counter and set- stack, so the size of the stack buffer is set to just above |V |log4 |V |.
ting the NW, NE, SW, and SE attributes to the indices of children Two variables are used to keep track of the shader’s current place
when partitions are made. Center of mass and total mass are com- in the stack and the last item it needs to process. An example of
puted in the usual way for cells and leaf nodes and stored in the this method is shown in Figure 2. Introducing parallelism to the
struct attributes of the correct index in the quadtree buffer. An ex- repulsive force pass in this algorithm is done in the same way as
ample quadtree creation is given by Figure 1 showing this method. force computation in the GraphWaGu FR algorithm, by dispatch-
ing a thread per node, effectively running a parallel for loop over
Once the quadtree is created, attractive and repulsive forces are the nodes.
computed in their own compute pipelines before being applied in
the same way as GraphWaGu FR. An overview of the full Graph-
4. Evaluation
WaGu BH algorithm is given in Algorithm 2. Attractive forces in
this algorithm now have to be computed in O(|E|) time, as an ad- To evaluate the performance of GraphWaGu, we performed three
jacency matrix is not built and repulsive and attractive forces must different sets of experiments comparing our solution with state-of-
be computed in separate passes. To speed this up, the algorithm the-art techniques. In particular, we report: (i) rendering benchmark
begins by creating sorted lists (by source index and target index) using synthetic graphs at different scales; (ii) layout generation
of the input graph’s edges so that we can parallelize the attractive benchmark using synthetic graphs at different scales; (iii) layout
force computation. This allows us to compute attractive forces for creation and rendering of a variety of real graphs.
© 2022 The Author(s)
Eurographics Proceedings © 2022 The Eurographics Association.Dyken et al. / GraphWaGu: GPU Powered Large Scale Graph Layout Computation and Rendering for the Web
Figure 2: Computing repulsive forces for node 2 in GraphWaGu BH algorithm. This uses the same graph and quadtree buffer as 1. First,
the root item of the quadtree C1 is assigned to the start of the stack and is checked. This is a cell item containing 4 children, so each child
is evaluated, adding the cell C2 to the stack. This cell is then checked, and the distance from node 2 is far enough away to approximate the
repulsive force, so we do not check C2’s children. We then reach the end of the stack buffer, so the computation is finished.
4.1. Experimental setup collection, we use five graphs and report layout and performance
results in Table 1.
We ran all experiments on two different system setups with browser
Google Chrome Canary: (i) equipped with AMD Ryzen 4600 CPU
(3 GHZ, 6 cores), 8GB RAM memory and integrated AMD Radeon 4.2. Graph Rendering Benchmark
C7 GPU (512MB Video RAM); (ii) equipped with AMD Ryzen We compare the rendering performance of GraphWaGu with other
5600 CPU (3.7 GHz, 6 cores), 16GB RAM memory and a dedi- popular web-based graph rendering frameworks: NetV.js, D3.js
cated NVIDIA GeForce RTX 2060 GPU. All the code for the ap- (Canvas and SVG), G6.js, Cytoscape, Sigma.js, and Stardust.
plication running the node rendering and layout creation pipelines Among these frameworks, D3.js is the most popular due to its ro-
is written in React, compiled with babel transcompiler, and bundled bust catalogue of visualization options and built-in libraries for al-
with webpack module bundler. gorithms such as computing force directed graph layouts. However,
due to its dependency on the DOM tree and SVG, D3.js cannot
For both the rendering and layout computation benchmarks, we
effectively handle a large number of graphical marks, especially
generated 11 graphs with varying vertex counts, all with com-
when running animation. The frameworks NetV.js, Sigma.js, and
pletely random edge connectivity and initial node positions using
Stardust are built on top of WebGL, and can therefore utilize the
the javascript Math.random function. For these artificial graphs, we
GPU for high performance rendering; however, they do not accel-
maintained an edge to vertex count ratio (|V|:|E|) of 20 to model
erate graph layout computation. G6.js does not leverage the GPU
real-world data (similar to the experimental setup of [HPZC21]).
for rendering nor computation, and has limited scalability for large
The total vertex count for each graph varies from 102 to 106 . To
scale graph rendering as a result.
demonstrate that our performance results are not biased by the na-
ture of the synthetic (randomly generated) graphs, we also per- In order to properly stress test the abilities of the rendering li-
formed an additional evaluation using datasets generated by a wide braries chosen, we one-by-one call each to render a completely
range of applications and hosted by the SuiteSparse Matrix Col- different graph of the size being tested each frame. We randomly
lection [KAB∗ 19]. Formerly known as the University of Florida generate the graphs for each frame as detailed in the experimental
Sparse Matrix Collection, these diverse datasets are large and ac- setup, and do not include graph generation time in the time it takes
tively maintained resources that arise in real applications. From this to complete a frame. Frames per second (FPS) is calculated for each
© 2022 The Author(s)
Eurographics Proceedings © 2022 The Eurographics Association.Dyken et al. / GraphWaGu: GPU Powered Large Scale Graph Layout Computation and Rendering for the Web
On both systems, GraphWaGu outperforms other frameworks
60 NetV
D3 SVG and is the most scalable solution. The rendering performance of
D3 Canvas GraphWaGu is significantly better for the largest scale graphs even
50 G6
when using an integrated GPU (see Figure 4). On the integrated
Cytoscape
Sigma GPU, WebGL based libraries (NetV and Stardust) performed sim-
40 Stardust ilarly to optimized serial libraries (D3 Canvas and G6) up to the
GraphWaGu
highest number of nodes, as there was not much GPU power for
FPS
30 them to take advantage of. On the dedicated GPU, we can see that
WebGL based libraries perform much better, with Stardust main-
20
taining about equal FPS to GraphWaGu until passing 10,000 nodes
and 200,000 edges, which is the limit of Stardust graph render-
ing. For small sized graphs, all frameworks perform well, hence
10
the FPS performance reaches the nominal limit of 60 FPS. For
larger graphs, GraphWaGu shows better performance compared to
0
2 3 4 5 6
other frameworks. The reason behind this are differences between
10 10 10 10 10
Number of nodes
the structure of the GraphWaGu system and the WebGL based li-
braries. These require a higher number of draw calls (which are
costlier) than WebGPU to reflect the change of state in between
Figure 3: Rendering performance on computer with high-end ded-
the passing of frames. WebGPU allows resources and command
icated GPU (NVIDIA GeForce RTX 2060). Performance for all
bounding together in groups for dispatching them in chunk on
rendering libraries on dedicated GPU. Rendering performance of
GPU, which reduces the CPU overhead and improves performance.
GraphWaGu becomes best among competitors after 10,000 nodes
and is able to render the graph with 50,000 nodes and 1,000,000 We report that we are able to maintain interactive rendering
edges in around 10fps. With ample GPU power, WebGL and We- (≥ 10 FPS) until 100,000 nodes and 2,000,000 edges on the dedi-
bGPU systems outcompete serial based libraries. cated GPU system, while NetV.js is the only other library that main-
tains rendering, at 3 FPS. The rendering of GraphWaGu continues
NetV
to be possible until 200,000 nodes, and 4,000,000 edges, a bench-
60
D3 SVG mark that is not possible on any other web-based graph visualiza-
D3 Canvas tion library. (see Figure 3).
50 G6
Cytoscape
Sigma
40
4.3. Layout Computation Benchmarks
Stardust
GraphWaGu
In this section, we evaluate the efficacy of GraphWaGu FR and
FPS
30 GraphWaGu BH layout computation functionality. Because tech-
nologies like Stardust and NetV.js support only rendering while re-
20 lying on other libraries to create graph layouts, we evaluate our sys-
tem only against D3.js’s D3-force layout computation ability. This
10
library utilizes a Barnes-Hut approximation of repulsive forces, so
that each iteration of its algorithm is O(|V |log|V |), but it is only
a serial implementation created in javascript. As with rendering,
0
2 3 4 5 6
we use the synthetic graphs described in experimental setup to run
10 10 10 10 10
Number of nodes
benchmarks for our layout computations. We create one graph for
each size chosen, and compute the layout determined by its ran-
dom structure with GraphWaGu FR, GraphWaGu BH, and D3-
Figure 4: Rendering performance on low-end computer with in-
force. For each generated graph, we measured the average iteration
tegrated GPU (AMD Radeon C7). The rendering performance of
time of the force-directed layout algorithm after computing 87 it-
GraphWaGu becomes significantly better than other visualization
erations (i.e., enough iterations to reach equilibrium for the graphs
frameworks after 1,000 nodes and 20,000 edges. Because of the
being used). Because graph rendering and layout computation are
lack of GPU power, D3 canvas is able to be competitive with GPU-
coupled in the GraphWaGu system through the setup of WebGPU
accelerated libraries like NetV and Stardust.
command encoding, each iteration time includes both layout com-
putation and rendering of the current graph layout on that frame.
library after repeating this process for a total duration of five sec- Figure 5 shows the results for the integrated GPU. We observe
onds for each graph size. The FPS is then averaged over this five that GraphWaGu FR yields the best performance for graphs with
seconds, and this is what we record, capped at 60 FPS since it is the relatively fewer number of nodes, however, D3-force outperforms
maximum display frequency. This process of FPS calculation was GraphWaGu algorithms for graphs with larger number of nodes.
done using the stats library [Cab]. We report these FPS results for This is because the low computational benefit offered by the low-
all libraries on both the dedicated and integrated GPUs in Figures end dedicated GPU does not offset the additional cost of creating
3 and 4 respectively. and running the compute pipelines for GraphWaGu BH here; the
© 2022 The Author(s)
Eurographics Proceedings © 2022 The Eurographics Association.Dyken et al. / GraphWaGu: GPU Powered Large Scale Graph Layout Computation and Rendering for the Web
GraphWaGu FR
performing algorithm. This trend can be attributed to the over-
4
GraphWaGu BH head of constructing the quadtree, computation of the center of
10 D3 mass and centroid, and tree-traversal for force calculation asso-
ciated with Barnes-Hut approximation used by both GraphWaGu
BH and D3-force. The overhead becomes negligible for graphs
Average iteration time (ms)
10
3 with larger number of nodes, as the performance benefits of the
quadtree greatly outweigh the overhead of its creation and traversal.
These results follow closely to the trends for Fruchterman-Reingold
2
and Barnes-Hut algorithms in parallel seen by [RSA20] for their
10
BatchLayout and BatchLayout BH algorithms, although their per-
formance is better with more optimized algorithms in native code,
and they do not include rendering in their system. Overall, Graph-
10
1 WaGu BH is able to maintain interactive frame rate (around 100
millisecond iteration time) while computing layout and rendering
10
2
10
3
10
4 until 20,000 nodes and 400,000 edges, while D3-force lasts un-
Number of nodes til 2,000 nodes and 40,000 edges, and GraphWaGu FR lasts un-
Figure 5: Layout computation performance on integrated GPU. til 10,000 nodes and 200,000 edges. GraphWaGu allows users to
Layout computation is fastest in GraphWaGu algorithms until pan and zoom with the graph rendering while the layout is being
20,000 nodes, when the integrated graphics card becomes unable computed, and this shows that we can permit user interaction with
to properly scale parallel computation of forces. graphs while rendering and computing layout for around 400,000
graphical marks. Also, with the use of GraphWaGu BH, we can
4
scale our layout computation to a graph of 100,000 nodes and
10 GraphWaGu FR
GraphWaGu BH
2,000,000 edges while computing its convergence in less than three
D3 minutes.
Average iteration time (ms)
3
10 4.4. Layout Quality Evaluation
In order to accurately measure the performance of the different lay-
out creation algorithms, a comparison must be made on the qual-
2 ity of outputted graphs. There are many aesthetic metrics avail-
10
able [Pur02] which seek to quantitatively evaluate different ideal
features in a 2-dimensional graph. For the sake of this paper, we
have chosen the following three metrics to verify the quality of
10
1 graphs outputted by D3, GraphWaGu FR, and GraphWaGu BH.
Edge Uniformity: Edge uniformity (EU) is a measure of the
10
2
10
3
10
4
10
5 variance of a layout’s edge lengths. We calculate this measure in
Number of nodes the same manner as defined by [RSA20]:rthe normalized standard
Figure 6: Layout computation performance on dedicated GPU. Av- ∑e∈E (le −lµ )2
deviation of edge length is computed as |E|∗lµ2
where lµ is
erage iteration time is best in GraphWaGu FR until 5,000 nodes,
when GraphWaGu BH becomes the best performing. Both Graph- the average length of all edges. Because a higher value corresponds
WaGu algorithms outperform D3.js except for huge number of to greater standard deviation among edge lengths, a lower value of
nodes where GraphWaGu FR’s O(|V |2 ) repulsive force calculation EU is a better aesthetic measure for a layout.
causes it to be the worst. Stress: Stress (S) measures the difference between the input
graph theoretical distances and output realized 2-dimensional dis-
tances for each pair of vertices in a layout. The graph theoreti-
GPU is likely unable to properly scale the parallel computation of cal distance between two vertices is determined with regard to the
forces for such large storage buffers being used. shortest path of edges between them, with closer to adjacent ver-
tices having lesser theoretical distance. The realized layout distance
Figure 6 shows the results for the dedicated GPU. For the largest
is the actual Euclidean distance between the two vertices in an out-
graphs, GraphWaGu BH has the best iteration time, although it
put layout. Stress is computed for a layout as the sum of the differ-
grows at the same rate as D3-force iteration time as both have
ences of these two measures for each pair of vertices in the graph.
O(|V |log|V |) repulsive force calculation and O(|E|) attractive force
A lower value of stress corresponds to a better layout as it means
calculation cost. Iteration times are better for both GraphWaGu
depicting the input graph more accurately.
algorithms compared to D3-force when number of nodes is be-
low 20,000, which is the point when the parallel O(|V |2 ) repul- Neighborhood Preservation: Neighborhood Preservation (NP)
sive force calculation in GraphWaGu FR becomes worse than the evaluates the precision of a layout in maintaining the proximity of
serial O(|V |log|V |) calculation done by D3-force. When the num- nodes when translating from graph space to 2-dimensional space.
ber of nodes is below 5,000 though, GraphWaGu FR is the best To do this, for each vertex v we first extract the neighborhood
© 2022 The Author(s)
Eurographics Proceedings © 2022 The Eurographics Association.Dyken et al. / GraphWaGu: GPU Powered Large Scale Graph Layout Computation and Rendering for the Web
Graph
D3.js GraphWaGu FR GraphWaGu BH Average Iteration Time (ms)
Size (N, E)
140
120
100
Pkustck01 80
(22044, 979380) 60
40
20
0
D3 GraphWaGu FR GraphWaGu BH
60
50
40
Pkustk02 30
(10800, 399600)
20
10
0
D3 GraphWaGu FR GraphWaGu BH
500
400
300
Finance256
(37376, 298496) 200
100
0
D3 GraphWaGu FR GraphWaGu BH
50
40
30
ba_network
(6000, 5999) 20
10
0
D3 GraphWaGu FR GraphWaGu BH
70
60
50
40
Fe_4elt2
30
(11143, 65636)
20
10
0
D3 GraphWaGu FR GraphWaGu BH
Table 1: Layout and performance comparisons of our approach (GraphWaGu FR and GraphWaGu BH) with D3.
Quality metric
Graph
D3-EU FR-EU BH-EU D3-S FR-S BH-S D3-NP FR-NP BH-NP
Pkustk01 8.3E-01 8.3E-01 7.7E-01 3.0E+07 3.6E+07 2.5E+07 4.4E-01 4.3E-01 4.4E-01
Pkustk02 8.1E-01 7.3E-01 6.9E-01 1.3E+08 9.8E+07 1.1E+08 3.3E-01 3.4E-01 3.3E-01
Finance_256 1.3E+00 9.2E-01 8.8E-01 3.9E+08 3.2E+08 3.7E+08 3.4E-02 4.8E-02 1.8E-02
ba_network 1.1E+00 1.6E+00 1.1E+00 9.1E+06 7.3E+06 7.9E+06 2.9E-02 7.4E-02 3.6E-02
Fe_4elt2 4.8E-01 6.3E-01 4.5E-01 4.2E+07 2.7E+07 2.5E+07 1.3E-01 1.8E-01 1.0E-01
Table 2: Quality metrics for the layouts depicted in Table 1. In bold is the best result for each metric: edge uniformity (EU), stress (S),
neighborhood preservation (NP).
© 2022 The Author(s)
Eurographics Proceedings © 2022 The Eurographics Association.Dyken et al. / GraphWaGu: GPU Powered Large Scale Graph Layout Computation and Rendering for the Web
NG (vi , rG ) of vertices connected to vi via a path of at most rG edges. 6. Acknowledgement
We then create the neighborhoods NL (vi ) from a given layout L as This work was funded in part by NSF RII Track-4 award 2132013.
the closest |NG (vi , rG )| vertices to each vi using Euclidean distance.
The NP for this layout and graph is then the Jaccard similarity be-
tween these two neighborhoods, averaged over the vertices of the References
graph. This gives a measure which shows the precision of the lay- [AN16] A RIDHI S., N GUIFO E. M.: Big graph mining: Frameworks and
out neighborhoods in representing the input graph neighborhoods. techniques. Big Data Research 6 (2016), 1–10. 1
This method is shown to be useful in [KRM∗ 17] with rG of 2, and [AVHK06] A BELLO J., VAN H AM F., K RISHNAN N.: Ask-graphview:
rG ∈ {1, 3} are indicated to yield similar results. For our NP cal- A large scale graph visualization system. IEEE transactions on visual-
ization and computer graphics 12, 5 (2006), 669–676. 1
culations we choose rG = 1. A higher value of NP means a better
layout, with a value of 1 meaning that all vertices preserve all their [BH86] BARNES J., H UT P.: A hierarchical o (n log n) force-calculation
algorithm. nature 324, 6096 (1986), 446–449. 2, 4
neighbors.
[BOH11] B OSTOCK M., O GIEVETSKY V., H EER J.: D³ data-driven doc-
As shown in Table 1, we compute the layout of five real uments. IEEE Transactions on Visualization and Computer Graphics
(2011). doi:10.1109/tvcg.2011.185. 1, 2
graphs from the SuiteSparse Matrix Collection [KAB∗ 19] in D3.js,
GraphWaGu FR, and GraphWaGu BH on the dedicated GPU. To [BP11] B URTSCHER M., P INGALI K.: An efficient cuda implementation
of the tree-based barnes hut n-body algorithm. In GPU computing Gems
fairly compare the quality of the layouts being output, and to ensure Emerald edition. Elsevier, 2011, pp. 75–92. 2, 4
that they would reach convergence of energy minimization, each
[BRT17] B RINKMANN G. G., R IETVELD K. F., TAKES F. W.: Exploit-
algorithm ran for 2000 iterations for each dataset. Each layout was ing gpus for fast force-directed visualization of large-scale networks.
then rendered using GraphWaGu for consistency, and this output In 2017 46th International Conference on Parallel Processing (ICPP)
is shown. In terms of performance, we observe the same behaviour (2017), IEEE, pp. 382–391. 2
experienced in our benchmarks (see Figure 6), where the Graph- [Cab] C ABELLO R.:. https://github.com/mrdoob/stats.js/. 7
WaGu outperforms D3.js for small graphs (with both approaches) [CBP14] C RUZ J. D., B OTHOREL C., P OULET F.: Community detection
and large graphs (with the BH approach). and visualization in social networks: Integrating structural and semantic
information. ACM Transactions on Intelligent Systems and Technology
In layout creation, better performance must also be accompa- (TIST) 5, 1 (2014), 1–26. 1
nied by similar or better quality layouts or a comparison between [CDGP20] C HEN X., DATHATHRI R., G ILL G., P INGALI K.: Pangolin:
the algorithms being used is not possible. Qualitatively, one can An efficient and flexible graph mining system on cpu and gpu. Proceed-
judge that the layouts shown in Table 1 seem similar, although ings of the VLDB Endowment 13, 8 (2020), 1190–1205. 1
they are not identical due to differences in algorithmic design. Be- [Coe18] C OENE J.-P.: sigmajs: An r htmlwidget interface to the sigma.
cause of this, we compute the quality metrics described above to js visualization library. Journal of Open Source Software 3, 28 (2018),
814. 3
judge quantitatively the aesthetic standard of all the layouts, and
depict the results in Table 2. For edge uniformity (EU), Graph- [con22a] CONTRIBUTORS M.: Canvas API. https://developer.
mozilla.org/en-US/docs/Web/API/Canvas_API, 2022.
WaGu BH is the winner for all 5 graphs. For both stress (S) and [Online; accessed 11-March-2022]. 2
neighborhood preservation, either GraphWaGu FR or GraphWaGu
[con22b] CONTRIBUTORS M.: SVG. https://developer.
BH has the best score for all datasets, although D3 is comparable mozilla.org/en-US/docs/Web/SVG, 2022. [Online; accessed
for most. Overall, these results point that GraphWaGu creates lay- 11-March-2022]. 2
outs of equal or better quality then D3 when using both the FR [DGH∗ 19] DATHATHRI R., G ILL G., H OANG L., JATALA V., P INGALI
and BH algorithms. These results validate our layout generation K., NANDIVADA V. K., DANG H.-V., S NIR M.: Gluon-async: A bulk-
works for a diverse set of data and that GraphWaGu has the po- asynchronous system for distributed and heterogeneous graph analyt-
ics. In 2019 28th International Conference on Parallel Architectures
tential to generate and render aesthetically pleasing layouts with
and Compilation Techniques (PACT) (2019), IEEE, pp. 15–28. 1
superior performance to existing web-based graph visualization li-
[Ead84] E ADES P.: A heuristic for graph drawing. Congressus numeran-
braries. tium 42 (1984), 149–160. 2
[EF96] E ADES P., F ENG Q.-W.: Multilevel visualization of clustered
graphs. In International symposium on graph drawing (1996), Springer,
5. Conclusions pp. 101–112. 1
[FLH∗ 16] F RANZ M., L OPES C. T., H UCK G., D ONG Y., S UMER O.,
We have presented GraphWaGu, the first WebGPU based graph vi- BADER G. D.: Cytoscape. js: a graph theory library for visualisation and
sualization tool that enables parallel layout computation and ren- analysis. Bioinformatics 32, 2 (2016), 309–311. 1, 2
dering for large scale graphs in the browser. We have implemented [FR91] F RUCHTERMAN T. M., R EINGOLD E. M.: Graph drawing by
a WebGPU based layout computation for both Frutcherman- force-directed placement. Software: Practice and experience 21, 11
Reingold and Barnes-Hut algorithms. Performance scaling studies (1991), 1129–1164. 2
have demonstrated that GraphWaGu can achieve the best perfor- [Gar82] G ARGANTINI I.: An effective way to represent quadtrees. Com-
mance for both small (thousands of edges) and large graphs (mil- mun. ACM 25, 12 (dec 1982), 905–910. URL: https://doi.org/
10.1145/358728.358741, doi:10.1145/358728.358741.
lions of edges) when compared with existing state-of-the-art web
4
based visualization libraries. The layout computation and render-
[GKS94] G RAMA A. Y., K UMAR V., S AMEH A.: Scalable parallel for-
ing performance of GraphWaGu pave the way for a new generation mulations of the barnes-hut method for n-body simulations. In Super-
of web-based graph visualization tools that leverage the full power computing’94: Proceedings of the 1994 ACM/IEEE Conference on Su-
of the GPU. percomputing (1994), IEEE, pp. 439–448. 2
© 2022 The Author(s)
Eurographics Proceedings © 2022 The Eurographics Association.Dyken et al. / GraphWaGu: GPU Powered Large Scale Graph Layout Computation and Rendering for the Web
[Gov19] G OVE R.: A random sampling o (n) force-calculation algorithm [Pli21] P LIQUE G.: Graphology, a robust and multipurpose Graph ob-
for graph layouts. In Computer Graphics Forum (2019), vol. 38, Wiley ject for JavaScript. Zenodo. https://www.khronos.org/api/
Online Library, pp. 739–751. 2 webgl, 2021. [Online; accessed 11-March-2022]. 3
[Gro22] G ROUP K.: WebGL: LOW-LEVEL 3D GRAPHICS API [Pur02] P URCHASE H. C.: Metrics for graph drawing aes-
BASED ON OPENGL ES. https://www.khronos.org/api/ thetics. Journal of Visual Languages & Computing 13, 5
webgl, 2022. [Online; accessed 11-March-2022]. 2 (2002), 501–516. URL: https://www.sciencedirect.com/
science/article/pii/S1045926X02902326, doi:https:
[HJC∗ 19] H OANG L., JATALA V., C HEN X., AGARWAL U., //doi.org/10.1006/jvlc.2002.0232. 8
DATHATHRI R., G ILL G., P INGALI K.: Disttc: High performance
distributed triangle counting. In 2019 IEEE High Performance Extreme [RLH17] R EN D., L EE B., H ÖLLERER T.: Stardust: Accessible and
Computing Conference (HPEC) (2019), IEEE, pp. 1–7. 1 transparent gpu support for information visualization rendering. In Com-
puter Graphics Forum (2017), vol. 36, Wiley Online Library, pp. 179–
[HK00] H AREL D., KOREN Y.: A fast multi-scale method for draw- 188. 1, 2
ing large graphs. In International symposium on graph drawing (2000),
Springer, pp. 183–196. 2 [RSA20] R AHMAN M. K., S UJON M. H., A ZAD A.: Batchlayout: A
batch-parallel force-directed graph layout algorithm in shared memory.
[HKUH17] H IDAKA M., K IKURA Y., U SHIKU Y., H ARADA T.: CoRR abs/2002.08233 (2020). URL: https://arxiv.org/abs/
Webdnn: Fastest dnn execution framework on web browser. In Pro- 2002.08233, arXiv:2002.08233. 8
ceedings of the 25th ACM International Conference on Multimedia (New
York, NY, USA, 2017), MM ’17, Association for Computing Machinery, [Sam90] S AMET H.: The Design and Analysis of Spatial Data Structures.
p. 1213–1216. URL: https://doi.org/10.1145/3123266. Addison-Wesley Publishing Company, Inc, 1990. 4
3129394, doi:10.1145/3123266.3129394. 3 [SMS∗ 17] S AHU S., M HEDHBI A., S ALIHOGLU S., L IN J., Ö ZSU
M. T.: The ubiquity of large graphs and surprising challenges of graph
[HMM00] H ERMAN I., M ELANÇON G., M ARSHALL M. S.: Graph vi-
processing. Proceedings of the VLDB Endowment 11, 4 (2017), 420–
sualization and navigation in information visualization: A survey. IEEE
431. 1
Transactions on visualization and computer graphics 6, 1 (2000), 24–43.
1 [TFS∗ 15] T EIXEIRA C. H., F ONSECA A. J., S ERAFINI M., S IGANOS
G., Z AKI M. J., A BOULNAGA A.: Arabesque: a system for distributed
[HPZC21] H AN D., PAN J., Z HAO X., C HEN W.: Netv. js: A web-based graph mining. In Proceedings of the 25th Symposium on Operating Sys-
library for high-efficiency visualization of large-scale graphs and net- tems Principles (2015), pp. 425–440. 1
works. Visual Informatics 5, 1 (2021), 61–66. 2, 3, 6
[TM08] T IKHONOVA A., M A K.-L.: A scalable parallel force-directed
[JDG∗ 20] JATALA V., DATHATHRI R., G ILL G., H OANG L., NANDI - graph layout algorithm. In Proceedings of the 8th Eurographics confer-
VADA V. K., P INGALI K.: A study of graph analytics for massive ence on Parallel Graphics and Visualization (2008), pp. 25–32. 2
datasets on distributed multi-gpus. In 2020 IEEE International Parallel
and Distributed Processing Symposium (IPDPS) (2020), IEEE, pp. 84– [UP20] U SHER W., PASCUCCI V.: Interactive visualization of terascale
94. 1 data in the browser: Fact or fiction? In 2020 IEEE 10th Symposium on
Large Data Analysis and Visualization (LDAV) (2020), pp. 27–36. doi:
[JVHB14] JACOMY M., V ENTURINI T., H EYMANN S., BASTIAN M.: 10.1109/LDAV51489.2020.00010. 3
Forceatlas2, a continuous graph layout algorithm for handy network
visualization designed for the gephi software. PloS one 9, 6 (2014), [Web] WebGPU. https://gpuweb.github.io/gpuweb/. 1
e98679. 2 [wgs] WebGPU Shading Language. https://www.w3.org/TR/WGSL/. 2
[KAB∗ 19] KOLODZIEJ S. P., A ZNAVEH M., B ULLOCK M., DAVID J.,
DAVIS T. A., H ENDERSON M., H U Y., S ANDSTROM R.: The suites-
parse matrix collection website interface. Journal of Open Source Soft-
ware 4, 35 (2019), 1244. 6, 10
[Kar12] K ARRAS T.: Maximizing parallelism in the construction of
bvhs, octrees, and k-d trees. In Proceedings of the Fourth ACM
SIGGRAPH / Eurographics Conference on High-Performance Graph-
ics (Goslar, DEU, 2012), EGGH-HPG’12, Eurographics Association,
p. 33–37. 4
[KG19] K UMAR S., G ILRAY T.: Distributed relational algebra at scale.
In International Conference on High Performance Computing, Data, and
Analytics (HiPC). IEEE (2019). 1
[KK∗ 89] K AMADA T., K AWAI S., ET AL .: An algorithm for drawing
general undirected graphs. Information processing letters 31, 1 (1989),
7–15. 2
[KKVF15] KOUTRA D., K ANG U., V REEKEN J., FALOUTSOS C.: Sum-
marizing and understanding large graphs. Statistical Analysis and Data
Mining: The ASA Data Science Journal 8, 3 (2015), 183–202. 1
[KRM∗ 17] K RUIGER J., R AUBER P., M ARTINS R., K ERREN A.,
KOBOUROV S., T ELEA A.: Graph layouts by t-sne. Computer Graphics
Forum 36 (06 2017), 283–294. doi:10.1111/cgf.13187. 10
[LWZ15] L IPP F., W OLFF A., Z INK J.: Faster force-directed graph draw-
ing with the well-separated pair decomposition. In International Sympo-
sium on Graph Drawing (2015), Springer, pp. 52–59. 2
[NLP13] N GUYEN D., L ENHARTH A., P INGALI K.: A lightweight in-
frastructure for graph analytics. In Proceedings of the twenty-fourth ACM
symposium on operating systems principles (2013), pp. 456–471. 1
© 2022 The Author(s)
Eurographics Proceedings © 2022 The Eurographics Association.You can also read


