GRAINet: mapping grain size distributions in river beds from UAV images with convolutional neural networks
←
→
Page content transcription
If your browser does not render page correctly, please read the page content below
Hydrol. Earth Syst. Sci., 25, 2567–2597, 2021
https://doi.org/10.5194/hess-25-2567-2021
© Author(s) 2021. This work is distributed under
the Creative Commons Attribution 4.0 License.

GRAINet: mapping grain size distributions in river beds
from UAV images with convolutional neural networks
Nico Lang1 , Andrea Irniger2 , Agnieszka Rozniak1 , Roni Hunziker2 , Jan Dirk Wegner1 , and Konrad Schindler1
1 EcoVision   Lab, Photogrammetry and Remote Sensing, ETH Zürich, Zurich, Switzerland
2 Hunziker,   Zarn & Partner, Aarau, Switzerland

Correspondence: Nico Lang (nico.lang@geod.baug.ethz.ch) and Andrea Irniger (andrea.irniger@hzp.ch)

Received: 27 April 2020 – Discussion started: 25 May 2020
Revised: 5 February 2021 – Accepted: 25 March 2021 – Published: 19 May 2021

Abstract. Grain size analysis is the key to understand the         serve the biodiversity in aquatic habitats. Grain size data of
sediment dynamics of river systems. We propose GRAINet,            gravel- and cobble-bed streams are key to advance the un-
a data-driven approach to analyze grain size distributions of      derstanding and modeling of such processes (Bunte and Abt,
entire gravel bars based on georeferenced UAV images. A            2001). The fluvial morphology of the majority of the world’s
convolutional neural network is trained to regress grain size      streams is heavily affected by human activity and construc-
distributions as well as the characteristic mean diameter from     tion along the river (Grill et al., 2019). Human interventions
raw images. GRAINet allows for the holistic analysis of en-        like gravel extractions, sediment retention basins in the upper
tire gravel bars, resulting in (i) high-resolution estimates and   catchments, hydroelectric power plants, dams, or channels
maps of the spatial grain size distribution at large scale and     reduce the bed load and lead to surface armoring, clogging
(ii) robust grading curves for entire gravel bars. To collect      of the bed, and latent erosion (Surian and Rinaldi, 2003; Si-
an extensive training dataset of 1491 samples, we introduce        mon and Rinaldi, 2006; Poeppl et al., 2017; Gregory, 2019).
digital line sampling as a new annotation strategy. Our eval-      Consequently, the natural alteration of the river bed is hin-
uation on 25 gravel bars along six different rivers in Switzer-    dered, eventually deteriorating habitats and potential spawn-
land yields high accuracy: the resulting maps of mean di-          ing grounds. Moreover, the process of bed-load transport can
ameters have a mean absolute error (MAE) of 1.1 cm, with           cause bed or bank erosion, the destruction of engineering
no bias. Robust grading curves for entire gravel bars can be       structures (e.g., due to bridge scours), or increased flooding
extracted if representative training data are available. At the    due to deposits in the channel that amplify the impact of se-
gravel bar level the MAE of the predicted mean diameter is         vere floods (Badoux et al., 2014). What makes modeling of
even reduced to 0.3 cm, for bars with mean diameters rang-         fluvial morphology challenging are the mutual dependencies
ing from 1.3 to 29.3 cm. Extensive experiments were carried        between the flow field, grain size, movement, and geome-
out to study the quality of the digital line samples, the gener-   try of the channel bed and banks. While channel shape and
alization capability of GRAINet to new locations, the model        roughness define the flow field, the flow moves sediments
performance with respect to human labeling noise, the limi-        – depending on their size – and the bed is altered by ero-
tations of the current model, and the potential of GRAINet to      sion and deposition. This mutually reinforcing system makes
analyze images with low resolutions.                               understanding channel form and processes hard. Transport
                                                                   calculations in numerical models are thus still based on em-
                                                                   pirical formulas (Nelson et al., 2016).
                                                                      One important key indicator for modeling sediment dy-
1   Introduction                                                   namics of a river system is the grading curve of the sedi-
                                                                   ment. Depending on the complexity of the model, the grain
Understanding the hydrological and geomorphological pro-           size distribution is either described by its characteristic di-
cesses of rivers is crucial for their sustainable development      ameters (e.g., the mean diameter dm defined by Meyer-Peter
so as to mitigate the risk of extreme flood events and to pre-

Published by Copernicus Publications on behalf of the European Geosciences Union.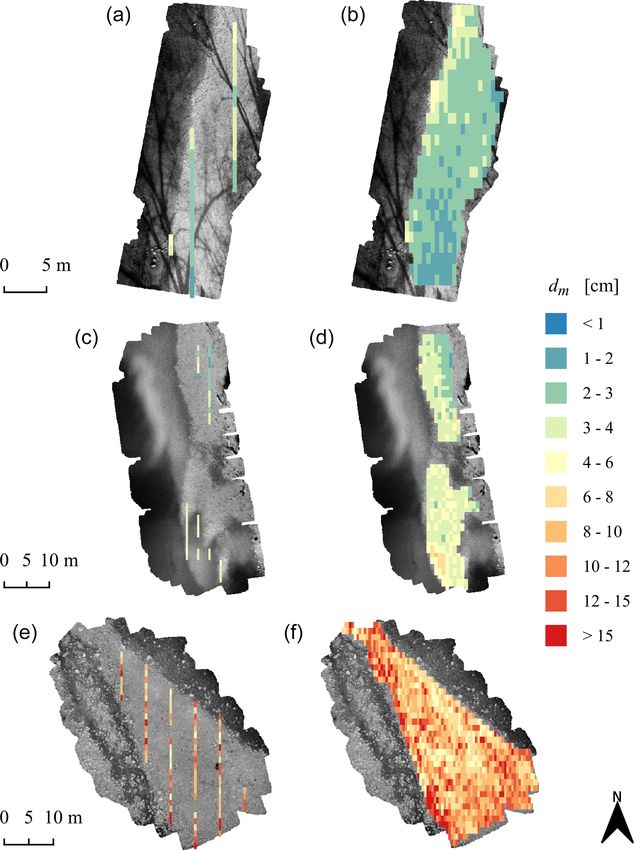
2568                               N. Lang et al.: GRAINet: mapping grain size distributions in river beds from UAV images

and Müller, 1948) or by the fractions of the grading curve               tical impact. Monitoring of river systems over time suffers
(fractional transport; Habersack et al., 2011). The grain size           from biases introduced by different operators in the field
of the river bed is crucial because it defines the roughness             (Wohl et al., 1996). Hence, objective, automatic methods for
of the channel as well as the incipient motion of the sedi-              large-scale grain size analysis offer great potential for con-
ment (Bunte and Abt, 2001). Thus, knowledge of the grain                 sistent monitoring over time.
size distribution is essential to specify flood protection mea-             Other researchers have proposed to analyze 3D data ac-
sures, to assess bed stability, to classify aquatic habitats, and        quired with terrestrial or airborne lidar or through pho-
to evaluate geological deposits (Habersack et al., 2011). Col-           togrammetric stereo matching (Brasington et al., 2012;
lecting the required calibration data to describe the compo-             Vázquez-Tarrío et al., 2017; Wu et al., 2018; Huang et al.,
sition of a river bed is time-consuming and costly, since it             2018). However, working with 3D data introduces much
varies strongly along a river (Surian, 2002; Bunte and Abt,              more overhead in data processing compared to 2D imagery.
2001) and even locally within individual gravel bars (Babej              Moreover, terrestrial data acquisition lacks flexibility and
et al., 2016; Rice and Church, 2010). Traditional mechani-               scalability, while airborne lidar remains costly (at least until
cal sieving to classify sediments (Krumbein and Pettijohn,               it can be recorded with consumer-grade UAVs). Photogram-
1938; Bunte and Abt, 2001) requires a substantial amount                 metric 3D reconstruction is limited by the reduced resolution
of skilled labor, and the whole process of digging, transport,           of the reconstructed point clouds (relative to that of the origi-
and sieving is time-consuming, costly, and destructive. Con-             nal images), which suppresses smaller grains. Woodget et al.
sequently, it is rarely implemented in practice. An alternative          (2018) have shown that, for small grain sizes, image-based
way of sampling sediment is surface sampling along tran-                 texture analysis is beneficial over roughness-based methods.
sects or on regular grid. We refer to Bunte and Abt (2001)                  While automatic grain size estimation from ground-level
for a detailed overview of traditional sampling strategies. A            images is more efficient than traditional field measurements
simplified, efficient approach that collects sparse data sam-            (Wolman, 1954; Fehr, 1987; Bunte and Abt, 2001), it is com-
ples in the field is the line sampling analysis of Fehr (1987),          monly less accurate, and scaling to large regions is hard.
the quasi-gold standard in practice today.1 This procedure of            Threshold-based image analysis for explicit gravel detection
surface sampling is commonly referred to as pebble counts                and measurements is affected by lighting variations and thus
along transects (Bunte and Abt, 2001). Yet, this approach is             requires much manual parameter tuning. In contrast, statisti-
still very time-consuming and, worse, potentially inaccurate             cal approaches avoid explicit detection of grains and empir-
and subjective (Bunte and Abt, 2001; Detert and Weitbrecht,              ically correlate image content with the grain size measure-
2012). Moreover, in situ data collection requires physical ac-           ment. Although these data-driven approaches are promising,
cess and cannot adequately sample inaccessible parts of the              their predictive accuracy and generalization to new scenes
bed, such as gravel bar islands (Bunte and Abt, 2001).                   (e.g., airborne imagery at country scale) is currently limited
   An obvious idea to accelerate data acquisition is to esti-            by manually designed features and small training datasets.
mate grain size distribution from images. So-called photo-                  In this paper, we propose a novel approach based on
sieving methods that manually measure gravel sizes from                  convolutional neural networks (CNNs) that efficiently maps
ground-level images (Adams, 1979; Ibbeken and Schleyer,                  grain size distributions over entire gravel bars, using geo-
1986) were first proposed in the late 1970s. While the ac-               referenced and orthorectified images acquired with a low-
curacy of measuring the size of individual grains may be                 cost UAV. This not only allows our generic approach to es-
compromised compared to field sampling, manual image-                    timate the full grain size distribution at each location in the
based sampling brings many advantages in terms of trans-                 orthophoto but also to estimate characteristic grain sizes di-
parency, reproducibility, and efficiency. Since it is nonde-             rectly using the same model architecture (Fig. 1). Since it
structive, multiple operators can label the exact same loca-             is hard to collect sufficiently large amounts of labeled train-
tion. Much research tried to automatically estimate grain size           ing data for hydrological tasks (Shen et al., 2018), we in-
distributions from ground-level images (Butler et al., 2001;             troduce digital line sampling as a new, efficient annotation
Rubin, 2004; Graham et al., 2005; Verdú et al., 2005; De-                strategy. Our CNN avoids explicit detection of individual ob-
tert and Weitbrecht, 2012; Buscombe, 2013; Spada et al.,                 jects (grains) and predicts the grain size distribution or de-
2018; Buscombe, 2019; Purinton and Bookhagen, 2019). On                  rived variables directly from the raw images. This strategy
the contrary, relatively little research has addressed the au-           is robust against partial object occlusions and allows for ac-
tomatic mapping of grain sizes from images at larger scale               curate predictions even with coarse image resolution, where
(Carbonneau et al., 2004, 2005; Black et al., 2014; de Haas              the individual small grains are not visible by the naked eye.
et al., 2014; Carbonneau et al., 2018; Woodget et al., 2018;             A common characteristic of most research in this domain
Zettler-Mann and Fonstad, 2020), which is needed for prac-               is that grain size is estimated in pixels (Carbonneau et al.,
                                                                         2018). Typically, the image scale is determined by recording
    1 To the best of our knowledge, this includes at least the follow-   a scale bar in each image, which is used to convert the grain
ing German-speaking countries: Switzerland, Germany, and Aus-            size into metric units (e.g., Detert and Weitbrecht, 2012) but
tria.                                                                    limits large-scale application. In contrast, our approach esti-

Hydrol. Earth Syst. Sci., 25, 2567–2597, 2021                                             https://doi.org/10.5194/hess-25-2567-2021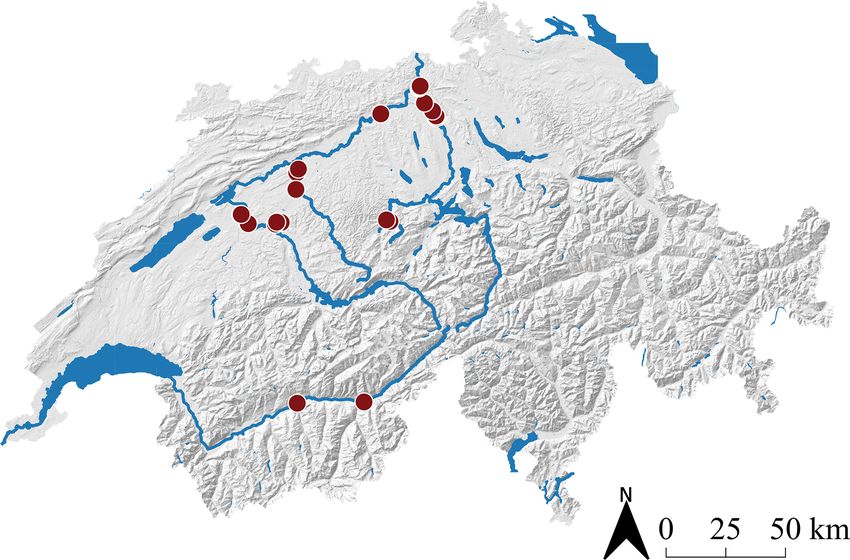
N. Lang et al.: GRAINet: mapping grain size distributions in river beds from UAV images                                                   2569

Figure 1. Illustration of the two final products generated with GRAINet on the river Rhone. Left: map of the spatial distribution of charac-
teristic grain sizes (here dm ). Right: grading curve for the entire gravel bar population, by averaging the predicted curves of individual line
samples.

mates grain sizes directly in metric units from orthorectified            approaches on rivers and fluvial geomorphology. Previous re-
and georeferenced UAV images.2                                            search can be classified into traditional image processing and
   We evaluate the performance of our method and its robust-              statistical approaches.
ness to new, unseen locations with different imaging con-                    Traditional image processing, also referred to as object-
ditions (e.g., weather, lighting, shadows) and environmen-                based approaches (e.g., Carbonneau et al., 2018), has been
tal factors (e.g., wet grains, algae covering) through cross-             applied to segment individual grains and measure their sizes,
validation on a set of 25 gravel bars (Irniger and Hunziker,              by fitting an ellipse and reporting the length of its minor
2020). Like Shen et al. (2018), we see great potential of deep            axis as the grain size (Butler et al., 2001; Sime and Fergu-
learning techniques in hydrology, and we hope that our re-                son, 2003; Graham et al., 2005, 2010; Detert and Weitbrecht,
search constitutes a further step towards its widespread adop-            2012; Purinton and Bookhagen, 2019). Detert and Weit-
tion. To summarize, our presented approach includes the fol-              brecht (2012) presented BASEGRAIN, a MATLAB-based ob-
lowing contributions:                                                     ject detection software tool for granulometric analysis of
                                                                          ground-level top-view images of fluvial, noncohesive gravel
    – end-to-end estimation of the full grain size distribution           beds. The gravel segmentation process includes grayscale
      at particular locations in the orthophoto, over areas of            thresholding, edge detection, and a watershed transforma-
      1.25 m × 0.5 m;                                                     tion. Despite this automated image analysis, extensive man-
                                                                          ual parameter tuning is often necessary, which hinders the
    – robust mapping of grain size distribution over entire
                                                                          automatic application to large and diverse sets of images. Re-
      gravel bars;
                                                                          cently Purinton and Bookhagen (2019) introduced a python
    – generic approach to map characteristic grain sizes with             tool called PebbleCounts as a successor of BASEGRAIN, re-
      the same model architecture;                                        placing the watershed approach with k-means clustering.
                                                                             Statistical approaches aim to overcome limitations of
    – mapping of mean diameters dm below 1.5 cm;                          object-centered approaches by relying on global image statis-
                                                                          tics. Image texture (Carbonneau et al., 2004; Verdú et al.,
    – robust estimation of dm , for arbitrary ground sampling             2005), autocorrelation (Rubin, 2004; Buscombe and Mas-
      distances up to 2 cm.                                               selink, 2009), wavelet transformations (Buscombe, 2013),
                                                                          or 2D spectral decomposition (Buscombe et al., 2010) are
                                                                          used to estimate the characteristic grain sizes like the mean
2    Related work                                                         (dm ) and median (d50 ) grain diameters. Alternatively, one can
                                                                          regress specific percentiles of the grading curve individually
In this section, we review related work on automated grain
                                                                          (Black et al., 2014; Buscombe, 2013, 2019).
size estimation from images. We refer the reader to Piégay
                                                                             Buscombe (2019) proposed a framework called SediNet,
et al. (2019) for a comprehensive overview of remote sensing
                                                                          based on CNNs, to estimate grain sizes as well as shapes
    2 It is worth noting that the annotation strategy and the CNN are     from images. Overall, the used dataset of 409 manually la-
not tightly coupled. Since the CNN is agnostic, it could be trained       beled sediment images was halved into training and test por-
on grain size data created with different sampling strategies to meet
other national standards.

https://doi.org/10.5194/hess-25-2567-2021                                                Hydrol. Earth Syst. Sci., 25, 2567–2597, 2021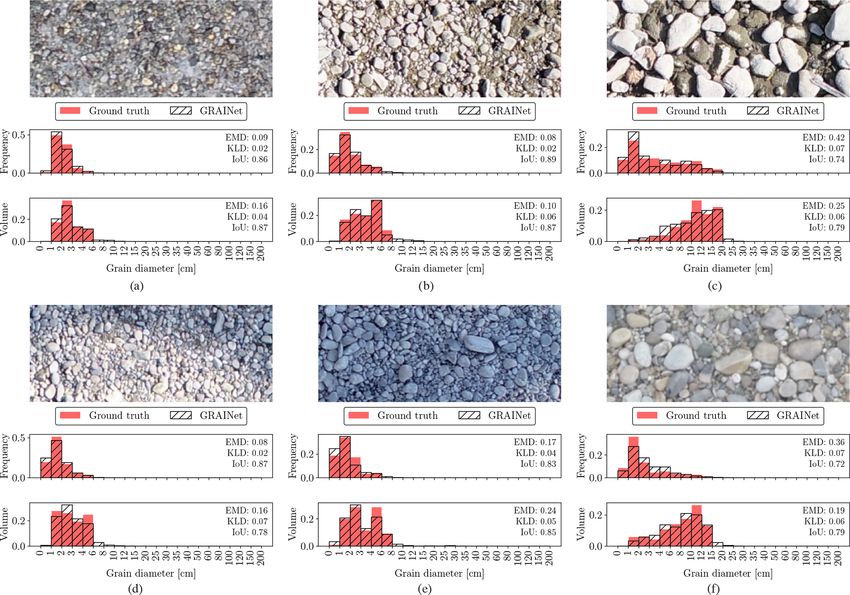
2570                               N. Lang et al.: GRAINet: mapping grain size distributions in river beds from UAV images

tions, and CNNs were trained from scratch, despite the small
amount of data.3
   In contrast to previous work, we view the frequency or vol-
ume distribution of grain sizes as a probability distribution
(of sampling a certain size), and we fit our model by min-
imizing the discrepancy between the predicted and ground
truth distributions. Our method is inspired by Sharma et al.
(2020), who proposed HistoNet to count objects in images
(soldier fly larvae and cancer cells) and to predict absolute
size distributions of these objects directly, without any ex-
plicit object detection. The authors show that end-to-end es-
timation of object size distributions outperforms baselines
using explicit object segmentation (in their case with Mask-
RCNN; He et al., 2017). Even though Sharma et al. (2020)
avoid explicit instance segmentation, the training process is            Figure 2. Overview map with the 25 ground truth locations of the
supervised with a so-called count map derived from a pixel-              investigated gravel bars in Switzerland.
accurate object mask, which indicates object sizes and loca-
tions in the image. In contrast, our approach requires neither
a pixel-accurate object mask nor a count map for training,               (Kl. Emme km 030.3), depending on the spatial extent and
which are both laborious to annotate manually. Instead, the              the variability of grain sizes within the gravel bar.
CNN is trained by simply regressing the grain size distribu-
tion end-to-end. Labeling of new training data becomes much              3.1   UAV imagery
more efficient, because we no longer need to acquire pixel-
accurate object labels. Our model learns to estimate object              We acquired images with an off-the-shelf consumer UAV,
size frequencies by looking at large image patches, without              namely, the DJI Phantom 4 Pro. Its camera has a
access to explicit object counts or locations.                           20 megapixel CMOS sensor (5472×3648 pixels) and a nomi-
                                                                         nal focal length of 24 mm (35 mm format equivalent).5 Flight
                                                                         missions were planned using the flight planner Pix4D cap-
3   Data                                                                 ture.6 Images were taken on a single grid, where adjacent
                                                                         images have an overlap of 80 %. To achieve a ground sam-
We collected a dataset of 1491 digitized line samples ac-                pling distance of ≈ 0.25 cm, the flying height was set to 10 m
quired from a total of 25 different gravel bars on six Swiss             above the gravel bar. This pixel resolution allows the human
rivers (see Table B1 in Appendix B for further details). We              annotator to identify individual grains as small as 1 cm. Fur-
name gravel bar locations with the river name and the dis-               thermore, to avoid motion blur in the images, the drone was
tance from the river mouth in kilometers.4 All gravel bars               flown at low speed. We generated georeferenced orthophotos
are located on the northern side of the Alps, except for two             with AgiSoft PhotoScan Professional.7
sites at the river Rhone (Fig. 2). All investigated rivers are              The accuracy of the image scale has a direct effect on the
gravel rivers with gradients of 0.01 %–1.5 %, with the ma-               grain size measurement from georeferenced images (Carbon-
jority (20 sites) having gradients < 1.0 %. The river width at           neau et al., 2018). To assure that our digital line samples are
the investigated sites varies between 50 and 110 m, whereby              not affected by image scale errors, we compare them with
Emme km 005.5 and Emme km 006.5 correspond to the nar-                   corresponding line samples in the field and observe good
rowest sites, and Reuss km 017.2 represents the widest one.              agreement. Note that absolute georeferencing is not crucial
   One example image tile from each of the 25 sites is shown             for this study. Because ground truth is directly derived from
in Fig. 3. This collection qualitatively highlights the great            the orthorectified images, potential absolute georeferencing
variety of grain sizes, distributions, and lighting conditions           errors do not affect the processing.
(e.g., shadows, hard and soft light due to different weather
conditions). The total number of digital line samples col-               3.2   Annotation strategy
lected per site varies between 4 (Reuss km 021.4) and 212
                                                                         We introduce a new annotation strategy (Fig. 4), called digi-
    3 While not clearly explained in Buscombe (2019), the results        tal line sampling, to label grain sizes in orthorectified images.
seem to suffer from overfitting, due to a flaw in the experimen-
tal setup. Our review of the published source code revealed that            5 https://www.dji.com/ch/phantom-4-pro (last access: 23 March
the stopping criterion for the training uses the test data, leading to   2020)
overly optimistic numbers.                                                  6 https://www.pix4d.com/de/produkt/pix4dcapture (last access:
    4 With the exception of location Emme –, which is a gravel pile      4 April 2020)
outside the channel.                                                        7 https://www.agisoft.com/ (last access: 4 April 2020)

Hydrol. Earth Syst. Sci., 25, 2567–2597, 2021                                             https://doi.org/10.5194/hess-25-2567-2021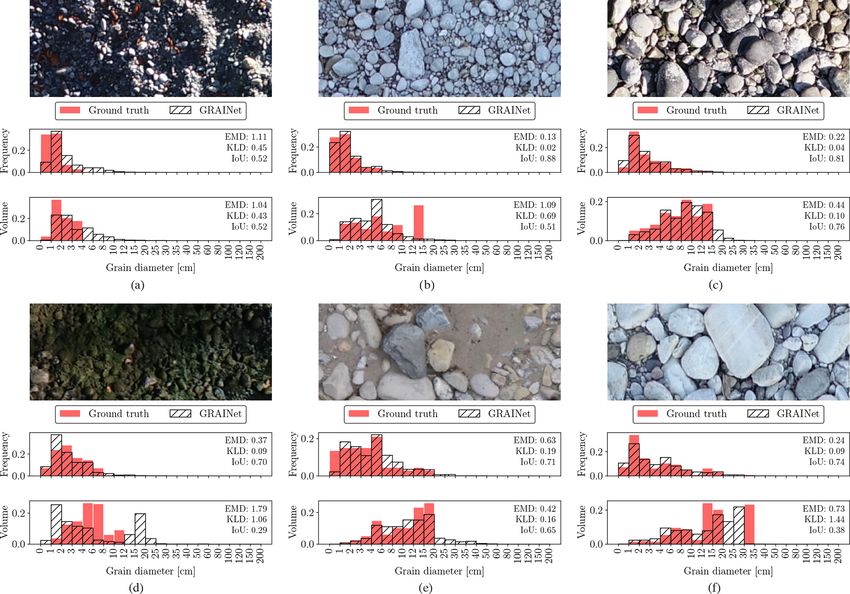
N. Lang et al.: GRAINet: mapping grain size distributions in river beds from UAV images                                        2571

                                                                   To allow for a quick adoption of our proposed approach, we
                                                                   closely follow the popular line sampling field method intro-
                                                                   duced originally by Fehr (1987). Instead of measuring grains
                                                                   in the field, we carry out measurements in images. First, or-
                                                                   thorectified images are tiled into rectangular image patches
                                                                   with a fixed size of 1.25 m × 0.5 m. We align the major axis
                                                                   with the major river flow, either north–south or east–west.
                                                                   A human annotator manually draws polygons of 100–150
                                                                   grains along the center line of a tile (Fig. 4a) which takes
                                                                   10–15 min per sample on average. We asked annotators to
                                                                   imagine the outline of partially occluded grains if justifiable.
                                                                   Afterwards, the minor axis of all annotated grains is mea-
                                                                   sured by automatically fitting a minimum bounding rectan-
                                                                   gle around the polygons (Fig. 4b). Grain sizes are quantized
                                                                   into 21 bins as shown in Fig. 5, which leads to a relative
                                                                   frequency distribution of grain sizes (Fig. 4c). Line samples
                                                                   are first converted to a quasi-sieve throughput (Fig. 4d) by
                                                                   weighting each bin with the weight wb = dmb α (Fehr, 1987),
                                                                   where dmb is the mean diameter per bin and α is set to 2
                                                                   (assuming no surface armoring). Usually undersampled finer
                                                                   fractions are predicted by a Fuller distribution, which results
                                                                   in the final grading curve (Fig. 4e). This grading curve can ei-
                                                                   ther be directly used for fractional bed-load simulations or be
                                                                   used to derive characteristic grain sizes corresponding to the
                                                                   percentiles of the grading curve (Fig. 4f). These are needed,
                                                                   for instance, to calculate the single-grain bed-load transport
                                                                   capacity (d50 , d65 , dm ), to determine the flow resistance (dm ,
                                                                   d90 ), and to describe the degree of surface armoring (d30 , d90 ;
                                                                   Habersack et al., 2011).
                                                                      Our annotation strategy has several advantages. First, dig-
                                                                   ital line sampling is the one-to-one counterpart of the cur-
                                                                   rent state-of-the-art field method in the digital domain. Sec-
                                                                   ond, the labeling process is more convenient, as it can be
                                                                   carried out remotely and with arbitrary breaks. Third, image-
                                                                   based line sampling is repeatable and reproducible. Multiple
                                                                   experts can label the exact same location, which makes it
                                                                   possible to compute standard deviations and quantify the un-
                                                                   certainty of the ground truth. Finally, digital line sampling
                                                                   allows one to collect vast amount of training data, which is
                                                                   crucial for the performance of CNNs. For modern machine
                                                                   learning techniques, data quantity is often more important
                                                                   than quality, as shown for example in Van Horn et al. (2015).
                                                                   As it is common machine learning terminology, we use the
                                                                   term ground truth to refer to the manually annotated digital
                                                                   line samples that are used to train and evaluate our model.

                                                                   3.3   Ground truth

                                                                   In total, > 180 000 grains over a wide range of sizes have
                                                                   been labeled manually (Fig. 5). Individual grain sizes range
Figure 3. Example image tiles (1.25 m×0.5 m) with 0.25 cm ground
sampling distance. Each of the 25 example tiles is taken from a    from 0.5 to approx. 40 cm. The major mode of individual
different gravel bar.                                              grain sizes is between 1 and 2 cm, and the minor mode is be-
                                                                   tween 4 and 6 cm. Mean diameters dm per site vary between
                                                                   1.3 (Aare km 178.0) and 29.3 cm (Grosse Entle km 002.0)
                                                                   with a global mean of all 1491 annotated line samples at

https://doi.org/10.5194/hess-25-2567-2021                                       Hydrol. Earth Syst. Sci., 25, 2567–2597, 2021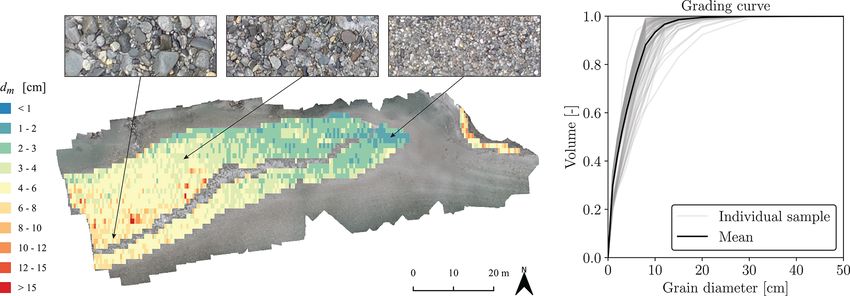
2572 N. Lang et al.: GRAINet: mapping grain size distributions in river beds from UAV images
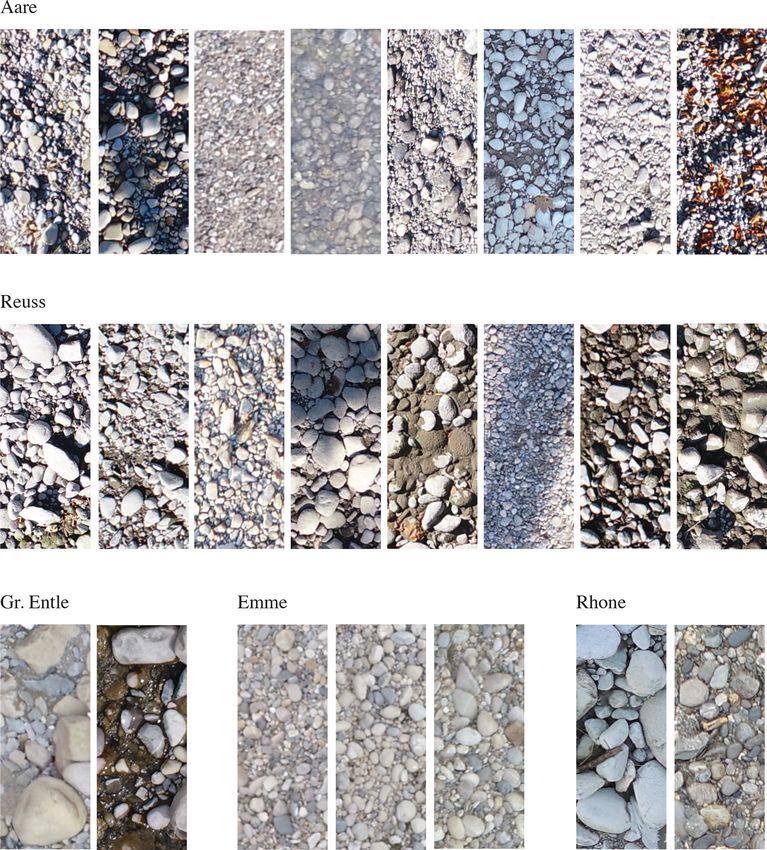
Figure 4. Overview of the line sampling procedure. (a) Digital line sample with 100–150 grains, (b) automatic extraction of the b axis,
(c) relative frequency distribution of grain sizes, (d) relative volume distribution, (e) grading curve, and (f) characteristic grain sizes (e.g.,
dm ).
Figure 5. Overview of the ground truth data. (a) Average of the 1491 relative frequency distributions; (b) histogram of the respective
characteristic mean diameter dm . The solid red line corresponds to the mean dm , and the dashed red lines correspond to mean ± SD.
6.2 cm and a global median at 5.3 cm. The distribution of sampling is 500 × 200 pixels. Inaccuracies may arise due to
the mean diameters dm (Fig. 5b) follows a bimodal distri- rounding effects from the prior cropping. For simplicity, the
bution as well. The major mode is around 4 cm and the mi- tile size is cropped to 500 × 200 pixels. Additionally, hori-
nor mode around 8 cm. We treat all samples the same and zontal tiles are flipped to be vertical.
do not further distinguish between shapes when training our Finally, following best practice for neural networks, we
CNN model for estimating the size distribution, such that normalize the intensities of the RGB channels to be standard
the learned model is universal and applicable to all types of normal distributed with mean of 0 and standard deviation of
gravel bars. Furthermore, to train a robust CNN, we not only 1, which leads to faster convergence of gradient-based op-
collect easy (clean) samples but also challenging cases with timization (LeCun et al., 2012). It is important to note that
natural disturbances such as grass, leaves, moss, mud, water, any statistics used for preprocessing must be computed solely
and ice. from the training data and then applied unaltered to the train-
ing, validation, and test sets.
4 Method 4.2 Regression of grain size distributions with
GRAINet
Many hydrological parameters are continuous by nature and
can be estimated via regression. Neural networks are generic Our CNN architecture, which we call GRAINet, regresses
machine learning algorithms that can perform both classifi- grain size distributions and their characteristic grain sizes di-
cation and regression. In the following, we discuss details rectly from UAV imagery. CNNs are generic machine learn-
of our methodology for regressing grain size distributions of ing algorithms that learn to extract texture and spectral fea-
entire gravel bars from UAV images. tures from raw images to solve a specific image interpreta-
tion task. A CNN consists of several convolutional (CONV)
4.1 Image preprocessing layers that apply a set of linear image filter kernels to their
input. Each filter transforms the input into a feature map by
Before feeding image tiles to the CNN, we apply a few stan- discrete convolution; i.e., the output is the dot product (scalar
dard preprocessing steps. To simplify the implicit encoding product) between the filter values and a sliding window of
of the metric scale into the CNN output, the ground sam- the inputs. After this linear operation, nonlinear activation
pling distance (GSD) of the image tiles is unified to 0.25 cm. functions are applied element-wise to yield powerful nonlin-
The expected resolution of a 1.25 m × 0.5 m tile after the re- ear models. The resulting activation maps are forwarded as
Hydrol. Earth Syst. Sci., 25, 2567–2597, 2021 https://doi.org/10.5194/hess-25-2567-2021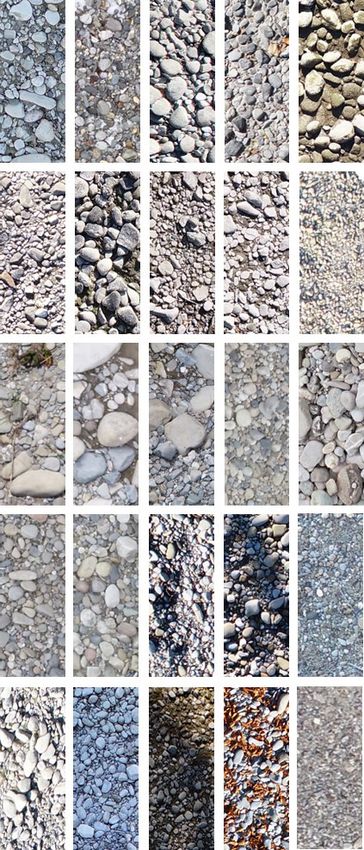
N. Lang et al.: GRAINet: mapping grain size distributions in river beds from UAV images                                           2573

input to the next layer. In contrast to traditional image pro-           4.2.1   CNN output targets
cessing, the parameters of filter kernels (weights) are learned
from training data. Each filter kernel ranges over all input             As CNNs are modular learning machines, the same CNN
channels fin and has a size of w × w × fin , where w defines             architecture can be used to predict different outputs. As al-
the kernel width. While a kernel width of 3 is the minimum               ready described, we can predict either discrete (relative) dis-
width required to learn textural features, 1 × 1 filters are also        tributions or scalars such as a characteristic grain size. We
useful to learn the linear combination of activations from the           thus train GRAINet to directly predict the outputs proposed
preceding layer.                                                         by Fehr (1987) at intermediate steps (Fig. 4):
   A popular technique to improve convergence is batch nor-
                                                                          (i) relative frequency distribution (frequency),
malization (Ioffe and Szegedy, 2015), i.e., renormalizing the
responses within a batch after every layer. Besides better gra-          (ii) relative volume distribution (volume),
dient propagation, this also amplifies the nonlinearity (e.g.,
in combination with the standard rectified linear unit (ReLU)            (iii) characteristic mean diameter (dm ).
activation function).
   Our proposed GRAINet is based on state-of-the-art resid-              4.2.2   Model learning
ual blocks introduced by He et al. (2016). An illustration
                                                                         Depending on the target type (probability distribution or
of our GRAINet architecture is presented in Appendix A in
                                                                         scalar), we choose a suitable loss function (i.e., error met-
Fig. A1. Every residual block transforms its input using three
                                                                         ric; Sect. 4.3) that is minimized by iteratively updating the
convolutional layers, each including a batch normalization
                                                                         trainable network parameters. We initialize network weights
and a ReLU activation. The first and last convolutional layers
                                                                         randomly and optimize with standard mini-batch stochastic
consist of 1 × 1 × fin filters (CONV 1 × 1), while the second
                                                                         gradient descent (SGD). During each forward pass the CNN
layer has 3 × 3 × fin filters (CONV 3 × 3). Besides this series
                                                                         is applied to a batch (subset) of the training samples. Based
of transformations, the input signal is also forwarded through
                                                                         on these predictions, the difference compared to ground truth
a shortcut, a so-called residual connection, and added to the
                                                                         is computed with the loss function, which provides the super-
output of the residual block. This shortcut allows the training
                                                                         vision signal. To know in which direction the weights should
signal to propagate better through the network. Every second
                                                                         be updated, the partial derivative of the loss function is com-
block has a step size (stride) of 2 so as to gradually reduce
                                                                         puted with respect to every weight in the network. By ap-
the spatial resolution of the input image and thereby increase
                                                                         plying the chain rule for derivatives, this gradient is back-
the receptive field of the network.
                                                                         propagated through the network from the prediction to the
   We tested different network depths (i.e., number of
                                                                         input (backward pass). The weights are updated with small
blocks/layers) and found the following architecture to work
                                                                         steps in negative gradient direction. A hyperparameter called
best: GRAINet consists of a single 3 × 3 “entry” CONV layer
                                                                         the learning rate controls the step size. In the training pro-
followed by six residual blocks and a 1 × 1 CONV layer that
                                                                         cess, this procedure is repeated iteratively, drawing random
generates B final activation maps. These activation maps are
                                                                         batches from the training data. One training epoch is finished
reduced to a one-dimensional vector of length B using global
                                                                         once all samples of the training dataset have been fed to the
average pooling, which computes the average value per acti-
                                                                         model (at least) once.
vation map. If the final target output is a scalar (i.e., a charac-
                                                                            We use the ADAM optimizer (Kingma and Ba, 2014) for
teristic grain size like the dm ), B is set to 1. To predict a full
                                                                         training, which is a popular adaptive version of standard
grain size distribution, B equals the number of bins of the
                                                                         SGD. ADAM adaptively attenuates high gradients and am-
discretized distribution. Finally, the vector is passed through
                                                                         plifies low gradients by normalizing the global learning rate
a softmax activation function. The output of that operation
                                                                         with a running average for each trainable parameter. Note
can be interpreted as a probability distribution or grain size
                                                                         that SGD acts as a strong regularizer, as the small batches
bins, since the softmax scales the raw network output such
                                                                         only roughly approximate the true gradient over the full train-
that all vector elements lie in the interval [0, 1] and sum up
                                                                         ing dataset. This allows for training neural networks with
to one.8 The total number of parameters of this network ar-
                                                                         millions of parameters.
chitecture is 1.6 million, which is rather lean compared to
                                                                            To enhance the diversity of the training data, many tech-
modern image analysis networks that often have > 20 mil-
                                                                         niques for image data augmentation have been proposed,
lion parameters.
                                                                         which simulate natural variations of the data. We employ ran-
                                                                         domly horizontal and vertical flipping of the input images.
                                                                         This makes the model more robust and, in particular, avoids
   8 In contrast to Sharma et al. (2020), we estimate relative instead
                                                                         overfitting to certain sun angles with their associated shadow
of absolute distributions. While they show that the L1 loss and the      directions.
KL divergence can be combined to capture scale and shape of the
distribution, respectively, we simply fix the scale of the predicted
distribution with a softmax before the output.

https://doi.org/10.5194/hess-25-2567-2021                                             Hydrol. Earth Syst. Sci., 25, 2567–2597, 2021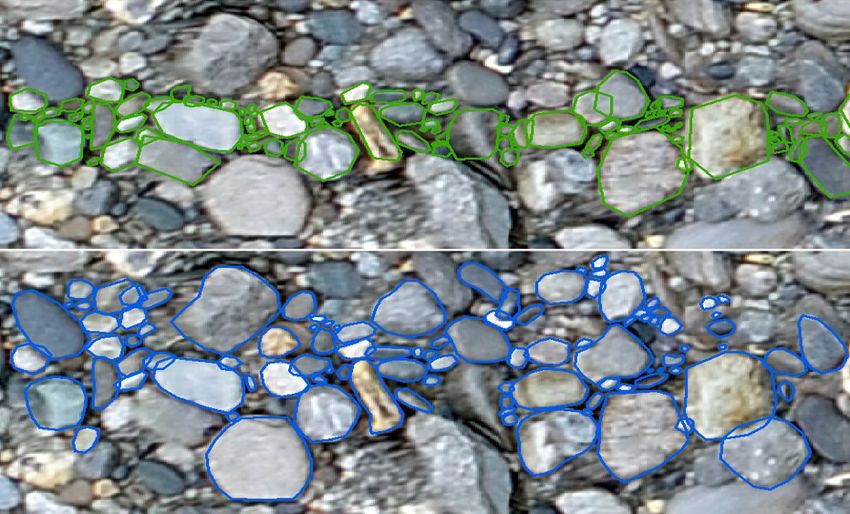
2574                             N. Lang et al.: GRAINet: mapping grain size distributions in river beds from UAV images

4.3    Loss functions and error metrics
                                                                                      PB
                                                                                       min (p(b), q(b))
Various error metrics exist to compare ground truth distri-          IoU(p, q) = PBb=1                  .                        (3)
butions to predicted distributions. Here, we focus on three                       b=1 max (p(b), q(b))
popular and intuitive metrics that perform best for our task:        During the training process the loss function (Eq. 4) simply
the Earth mover’s distance (shortened to EMD; also known             averages the respective error metric over all samples within a
as the Wasserstein metric), the Kullback–Leibler divergence          training batch. To evaluate performance, we average the error
(KLD), and the Intersection over Union (IoU; also known as           over the unseen test dataset:
the Jaccard index).
                                                                                N
   The Earth mover’s distance (Eq. 1) views two probabil-                    1 X
                                                                     L=            D (yi , f (xi )) ,                            (4)
ity density functions (PDFs) p and q as two piles of earth                   N i=1
with different shapes and describes the minimum amount of
“work” that is required to turn one pile into the other. This        where D corresponds to the error metric, f denotes the CNN
work is measured as the amount of moved earth (probabil-             model, N the number of samples, xi the input image tile,
ity mass) multiplied by its transported distance. In the one-        yi the ground truth PDF or CDF, and f (xi ) the predicted
dimensional case, the Earth mover’s distance can be imple-           distribution.
mented as the integral of absolute error between the two re-            To optimize and evaluate CNN variants that directly pre-
spective cumulative density functions (CDFs) P and Q of the          dict scalar values (like, for example, GRAINet, which di-
distributions (Ramdas et al., 2017). Furthermore, for discrete       rectly predicts the mean diameter dm ), we investigate two
distributions, the integral simplifies to a sum over B bins.         loss functions: the mean absolute error (MAE, also known
                                                                     as L1 loss, Eq. 5) and the mean squared error (MSE, also
                 B
                 X                                                   known as L2 loss, Eq. 6).
EMD(P , Q) =           |P (b) − Q(b)|                         (1)
                 b=1                                                                N
                                                                                 1 X
                                                                     MAE =             |f (xi ) − yi |                           (5)
Alternatively, the Kullback–Leibler divergence (Eq. 2) is                        N i=1
widely used in machine learning, because minimizing the
                                                                                   N
forward KLD is equivalent to minimizing the negative like-                      1 X                 2
                                                                     MSE =             f (xi ) − yi                              (6)
lihood or the cross-entropy (up to a constant). It should be                    N i=1
noted though that Kullback–Leibler divergence is not sym-
metric. For a supervised approach, the forward KLD is used,          Furthermore, we evaluate the model bias with the mean error
where p denotes the true distribution and q the predicted dis-       (ME):
tribution. This error metric only accounts for errors in the                      N
bins that actually contain a ground truth probability mass,                    1 X
                                                                     ME =            f (xi ) − yi ,                              (7)
i.e., when p(b) > 0. Errors in empty ground truth bins do                      N i=1
not contribute to the forward KLD. Therefore, optimizing
the forward KLD has a mean-preserving behavior. In con-              where a positive mean error indicates that the prediction is
trast, the reverse KLD has a mode-preserving behavior. Note          greater than the ground truth.
that KLD only accounts for errors in bins containing ground
truth probability mass. Thus, the overestimation of empty            4.4     Evaluation strategy
bins does not directly contribute to the error metric, but as
                                                                     The trained GRAINet is quantitatively and qualitatively eval-
we treat the grain size distribution as a probability distribu-
                                                                     uated on a holdout test set, i.e., a portion of the dataset that
tion, this displaced probability mass is missing in the bins
                                                                     was not seen during training. We analyze error cases and
that are taken into account.9
                                                                     identify limitations of the proposed approach. Finally, with
                 XB
                                p(b)
                                                                    our image-based annotation strategy, multiple experts can la-
DKL (p k q) =        p(b) log                               (2)      bel the same sample, which we exploit to relate the model
                 b=1
                                q(b)
                                                                     performance to the variation between human expert annota-
In contrast to the EMD and KLD, the Intersection over Union          tions.
(Eq. 3) is an intuitive error metric that is maximized and
                                                                     4.4.1     Tenfold cross-validation
ranges between 0 and 1. While it is often used in object detec-
tion or semantic segmentation tasks, it allows one to compare        To avoid any train–test split bias, we randomly shuffle the full
two 1D probability distributions as follows:                         dataset and create 10 disjoint subsets, such that each sample
   9 For completeness, we note that there is a smoothed and sym-     is contained only in a single subset. Each of these subsets is
metric (but less popular) variant of KLD, i.e., the Jensen–Shannon   used once as the hold-out test set, while the remaining nine
divergence.                                                          subsets are used for training GRAINet. The validation set is

Hydrol. Earth Syst. Sci., 25, 2567–2597, 2021                                            https://doi.org/10.5194/hess-25-2567-2021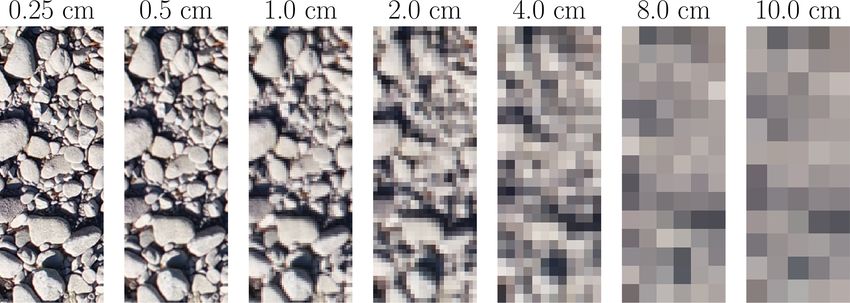
N. Lang et al.: GRAINet: mapping grain size distributions in river beds from UAV images                                       2575

created by randomly holding out 10 % of the training data          redundant. These predictions can be further used to create
and used to monitor model performance during training and          two kinds of products, illustrated in Fig. 1:
to tune hyperparameters. Results on all 10 folds are com-
bined to report overall model performance.                             1. dense high-resolution maps of the spatial distribution of
                                                                          characteristic grain sizes,
4.4.2    Geographical cross-validation
                                                                       2. grading curves for entire gravel bars, by averaging the
Whether or not a model is useful in practice strongly depends             grading curves at individual line samples.
on its capability to generalize across a wide range of scenes
                                                                   4.6    Experimental setup
unseen during training. Modern CNNs have millions of pa-
rameters, and in combination with their nonlinear properties,      For all experiments, the data are separated into three disjoint
these models have high capacity. Thus, if not properly regu-       sets: a training set to learn the model parameters, a validation
larized or if trained on a too small dataset, CNNs can poten-      set to tune hyperparameters and to determine when to stop
tially memorize spurious correlations specific to the training     training to avoid overfitting, and a test set used only to assess
locations which would result in poor generalization to unseen      the performance of the final model.
data. We are particularly interested to know if the proposed          The initial learning rate is empirically set to 0.0003, and
approach can be applied to a new (unseen) gravel bar. In or-       each batch contains eight image tiles, which is the maximum
der to validate whether GRAINet can generalize to unseen           possible within the 8 GB memory limit of our GPU (Nvidia
river beds, we perform geographical cross-validation. All im-      GTX 1080). While we run all experiments for 150 epochs
ages of a specific gravel bar are held out in turn and used to     for convenience, the final model weights are not defined by
test the model trained on the remaining sites.                     the last epoch but taken from the epoch with the lowest val-
                                                                   idation loss. An individual experiment takes less than 4 h to
4.4.3    Comparison to human performance
                                                                   train. Due to the extensive cross-validation, we parallelize
The predictive accuracy of machine learning models depend          across multiple GPUs to run the experiments in reasonable
on the quality of the labels used for training. In fact, label     time.
noise that would lead to inferior performance of the model
is introduced partially by the labeling method itself. Grain       5     Experimental results
annotation in images is somewhat subjective and thus dif-
fers across different annotators. The advantage of our digital     Our proposed GRAINet approach is quantitatively evaluated
line sampling approach is that multiple experts can perform        with 1491 digital line samples collected on orthorectified im-
the labeling at the exact same location, which is infeasible if    ages from 25 gravel bars located along six rivers in Switzer-
done in situ, because line sampling is disruptive and cannot       land (Sect. 3). We first analyze the quality of the collected
be repeated. We perform experiments to answer two ques-            ground truth data by comparing our digital line samples with
tions. First, what is the variation of multiple human annota-      field measurements. We then evaluate the performance of
tions? Second, can the CNN learn a proper model, despite           GRAINet for estimating the three different outputs:
the inevitable presence of some label noise? We randomly
selected 17 image tiles that are labeled by five skilled oper-         i. relative frequency distribution (frequency),
ators, who are familiar with traditional line sampling in the
                                                                       ii. relative volume distribution (volume),
field.
                                                                    iii. characteristic mean diameter (dm ).
4.5     Final products
                                                                      In order to get an empirical upper bound for the achievable
On the one hand, by combining the output of GRAINet                accuracy, we compare the performance of GRAINet with the
trained to either predict the frequency or the volume distri-      variation of repeated manual annotations. All reported results
bution with the approach proposed by Fehr (1987), we can           correspond to random 10-fold cross-validation, unless spec-
obtain the grading curve (cumulative volume distribution) as       ified otherwise. In addition, we analyze the generalization
well as the characteristic grain sizes (e.g., dm ). On the other   capability of all three GRAINet models with the described
hand, GRAINet can also be trained to directly predict char-        geographical cross-validation procedure and investigate the
acteristic grain sizes. The characteristic grain size dm is only   error cases to understand the limitations of the proposed data-
one example of how the proposed CNN architecture can be            driven approach. Finally, as our CNN does not explicitly de-
adapted to predict specific aggregate parameters. Ultimately,      tect individual grains, we investigate the possibility to esti-
the GRAINet architecture allows one to predict grain size          mate grain sizes from lower image resolutions.
distributions or characteristic grain sizes densely for entire
gravel bars, with high spatial resolution and at large scale,
which makes the (subjective) choice of sampling locations

https://doi.org/10.5194/hess-25-2567-2021                                         Hydrol. Earth Syst. Sci., 25, 2567–2597, 2021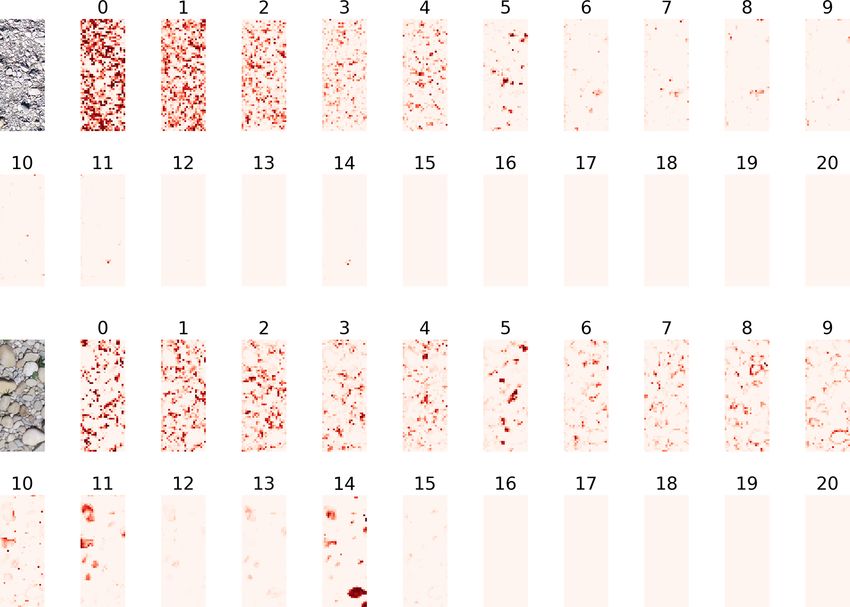
2576                             N. Lang et al.: GRAINet: mapping grain size distributions in river beds from UAV images

5.1     Quality of ground truth data                                 by the subjective selection of valid grains. While the distri-
                                                                     bution in the upper annotation (in green) contains a larger
We evaluate the quality of the ground truth data in two ways.        fraction of smaller grains following closely the center line,
First, the digital line samples are compared with state-of-the-      the lower annotation (in blue) contains a larger fraction of
art in situ line samples from field measurements. Second, the        larger grains, including some further away from the center
label uncertainty is studied by comparing repeated annota-           line.
tions by multiple skilled operators.                                     Recall that this comparison of multiple annotators is only
                                                                     possible because digital line sampling is nondestructive. In
5.1.1    Comparison to field measurements                            contrast, even though variations of similar magnitude are
                                                                     expected in the field, a quantitative analysis is not easily
From 22 out of the 25 gravel bars, two to three field measure-       possible. Nevertheless, Wohl et al. (1996) found that sedi-
ments from experienced experts were available (see Fig. 6).          ment samples are biased by the operator. Although CNNs are
These field samples were measured according to the line              known to be able to handle a significant amount of label noise
sampling proposed by Fehr (1987). To compare the digital             if trained on large datasets (Van Horn et al., 2015), the uncer-
and in situ line samples, we derive the dm values and compare        tainty of the manual ground truth annotations is also present
them at the gravel bar level, because the field measurements         in the test data and therefore represents a lower bound for
are only geolocalized to that level. Some field measurements         the performance of the automated method. Therefore, while
were accomplished a few days apart from the UAV surveys.             we do not expect the label noise to degrade the CNN train-
We expect grain size distributions to remain unchanged, as           ing process, we do not expect root-mean-square errors below
no significant flood event occurred during that time. Fig-           0.5 cm due to the apparent label noise in the test data.
ure 6 indicates that the field-measured dm is always within
the range of the values derived from the digital line samples.       5.2     Estimation of grain size distributions
Furthermore, the mean of the field samples agrees well with
the mean of the digital samples. Comparing the mean dm de-           As explained in Sect. 3.2, the process of obtaining a grad-
rived from field and digital line samples across the 22 bars         ing curve according to Fehr (1987) involves several empir-
results in a mean absolute error of 0.9 cm and in a mean er-         ical steps (Fig. 4). In this processing pipeline, the relative
ror (bias) of −0.3 cm, which means that the digital dm is on         frequency distribution can be regarded as the initial measure-
average slightly lower than the dm values derived from field         ment. However, as the choice of the proper CNN target is a
samples. The wide range of the digital line samples empha-           priori not clear, we investigate the two options to estimate (i)
sizes that the choice of a single line sample in the field is        the relative frequency distribution and (ii) the relative volume
very crucial and that it requires a lot of expertise to chose        distribution. In the latter version, the CNN implicitly learns
a few locations that yield a meaningful sample of the en-            the conversion from frequency to fraction-weighted quasi-
tire gravel bar population. Considering that the field samples       sieve throughput, making that processing step obsolete. We
are unavoidably affected by the selected location and also by        experiment with three loss functions to train GRAINet for the
operator bias (Wohl et al., 1996), we conclude that within           estimation of discrete target distributions: the Earth mover’s
reasonable expectations the digital line samples are in good         distance (EMD), the Kullback–Leibler divergence (KLD),
agreement with field samples and constitute representative           and the Intersection over Union (IoU). For each trained
ground truth data. Nevertheless, to better understand the dif-       model, all three metrics are reported in Table 1. The stan-
ference between digital line sampling and field sampling, a          dard deviation quantifies the performance variations across
new dataset should be created in the future, where field sam-        the 10 random data splits. Theoretically, one would expect
ples are precisely geolocated to allow for a direct comparison       the best performance under a given error metric D from the
at the tile level.                                                   model trained to optimize that same metric; i.e., the best per-
                                                                     formance per column should be observed on the diagonals in
5.1.2    Label uncertainty from repeated annotations                 the two tables. Note that each error measure lives in its own
                                                                     space; numbers are not comparable across columns.
We compute statistics of three to five repeated annotations
of 17 randomly selected image tiles (see Table C1 in the             5.2.1    Regressing the relative frequency distribution
Appendix) to analyze the (dis)agreement between human
annotators. The standard deviation of dm across different            When estimating the relative frequency distribution, all three
annotators varies between 0.1 (Aare km 172.2) and 2.0 cm             loss functions yield rather similar mean performance, in all
(Rhone km 083.3); the average standard deviation is 0.5 cm.          three error metrics (Table 1a). The lowest KLD (mean of
Although these 17 samples are too few to compute reliable            0.13) and the highest IoU (mean of 0.73) are achieved by
statistics, we get an intuition for the uncertainty of the digital   optimizing the respective loss function, whereas the low-
line samples. Figure 7 shows two different annotations for           est EMD is also achieved by optimizing the IoU. However,
the same image tile, to demonstrate the variation introduced         all variations are within 1 standard deviation. The KLD is

Hydrol. Earth Syst. Sci., 25, 2567–2597, 2021                                          https://doi.org/10.5194/hess-25-2567-2021
N. Lang et al.: GRAINet: mapping grain size distributions in river beds from UAV images 2577
Figure 6. Comparison of digital line samples with 22 in situ line samples collected in the field.
Table 1. Results for GRAINet regressing (a) the relative frequency distribution and (b) the relative volume distribution. Mean and standard
deviation (in parenthesis) for the random 10-fold cross-validation. The rows correspond to the CNN models trained with the respective loss
function. Arrows indicate if the error metric is minimized (↓, lower is better) or maximized (↑, higher is better).
(a) (b)
EMD (↓) KLD (↓) IoU (↑) EMD (↓) KLD (↓) IoU (↑)
EMD 0.43 0.15 0.72 0.65 0.79 0.61
(0.03) (0.02) (0.01) (0.03) (0.24) (0.01)
Loss
KLD 0.44 0.13 0.72 0.68 0.32 0.60
(0.05) (0.01) (0.01) (0.05) (0.02) (0.01)
IoU 0.42 0.16 0.73 0.69 0.80 0.61
(0.04) (0.03) (0.01) (0.05) (0.19) (0.01)
5.2.2 Regressing the relative volume distribution
The regression performance for the relative volume distribu-
tion is presented in Table 1b. Here, the best mean perfor-
mance is indeed always achieved by optimizing the respec-
tive loss function. The relative performance gap under the
KLD error metric increases to 250 %, with 0.32 when trained
with the KLD loss vs. 0.80 with the IoU loss. Also the stan-
dard deviation of the KLD between cross-validation folds ex-
hibits a marked increase.
5.2.3 Performance depending on the GRAINet
regression target
Figure 7. Repeated annotations of the same tile by two experts.
In comparison to the values reported in Table 1a, the KLD
on the volume seems to be even more sensitive regarding the
slightly more sensitive than the other loss functions, with the choice of the optimized loss function. Furthermore, all error
largest relative difference (0.13 vs. 0.16) corresponding to a metrics are worse when estimating the volume instead of the
23 % increase. All standard deviations are 1 order of magni- frequency distribution: the best EMD increases from 0.42 to
tude smaller than the mean, meaning that the reported perfor- 0.65, the KLD increases from 0.13 to 0.32, and the best IoU
mance is not significantly affected by the specific splits into decreases from 0.73 to 0.61.
training and test sets. Looking at the difference between the frequency and the
volume distribution, we see a general shift of the probabil-
ity mass to the right-hand side of the distributions, which is
https://doi.org/10.5194/hess-25-2567-2021 Hydrol. Earth Syst. Sci., 25, 2567–2597, 20212578 N. Lang et al.: GRAINet: mapping grain size distributions in river beds from UAV images
clearly visible in Fig. 8c and f. While the frequency is gen- Yet, there is a tendency of overestimating the coarse frac-
erally smoothly decreasing to zero probability mass towards tion if optimizing for KLD. However, only KLD can repro-
the larger grain size fractions of the distribution, the volume duce the grading curve of the coarse gravel bar reasonably
has a very sharp jump at the last bin (Fig. 8c and f), where well (Fig. 11d–f). Overall, the experiments indicate that the
the largest grain – often only a single one (Fig. 9b and f) – KLD loss yields best performance for all three error met-
has been measured. rics. Thus, to assess the effect of the target choice (frequency
Figure 8 displays examples of various lighting conditions vs. volume) on the final grading curves of all 25 gravel bars,
and grain size distributions, where GRAINet yields a good we use the GRAINet trained with the KLD loss (Fig. 12).
performance for both targets. On the other hand, the error Both models approximate the ground truth curves well and
cases in Fig. 9 represent the limitations of the model. While, are able to reproduce various shapes (e.g., Aare km 171.2 vs.
for example, extreme lighting conditions deteriorate the per- Reuss km 001.3) . However, the grading curves derived from
formance on both targets similarly (Fig. 9a), the rare radiom- the predicted frequency distribution (dashed curves) tend to
etry caused by moss (Fig. 9d) has a stronger effect on the overestimate higher percentiles (e.g., Aare km 171.0).
volume prediction. This qualitative comparison indicates that regressing the
Comparing the predictions with the ground truth distribu- volume distribution with GRAINet yields slightly better grad-
tions in Fig. 9, the GRAINet predictions seem to be generally ing curves than for the frequency distribution. If computing
smoother for both frequency and volume. More specifically, the grading curve from the predicted frequency distribution,
the predicted distributions have longer tails (Fig. 9a, c, and small errors in the bins with larger grains are propagated and
e) and closed gaps of empty bins (Fig. 9f). amplified in a nonlinear way due to the fraction-weighted
In combination with the smoother output of the CNN, the transformation described in Sect. 3.2. In contrast, the vol-
sharp jump in the volume distribution could be an explanation ume distribution already includes this nonlinear transforma-
for the generally worse approximation of the volume com- tion and consequently errors are smaller.
pared to the frequency.
5.3 Estimation of characteristic grain sizes
5.2.4 Learned global texture features
Characteristic grain sizes can be derived from the predicted
To investigate to what degree the texture features learned by distributions, or GRAINet can be trained to directly predict
the CNN are interpretable with respect to grain sizes, we vi- variables like the mean diameter dm as scalar outputs.
sualize the activation maps of the last convolution layer, be-
5.3.1 Regressing the mean diameter dm
fore the global average pooling, in Fig. 10. In that layer of
the CNN there is one activation map per grain size bin, and We again analyze the effect of different loss functions,
those maps serve as a basis for regressing the relative fre- namely, the mean squared error (MSE) and the mean ab-
quencies. Therefore, each of these 21 activation maps cor- solute error (MAE) when training GRAINet to estimate dm
responds to a specific bin of grain sizes, with bin 0 for the end-to-end; see Table 2. Note that minimizing MSE is equiv-
smallest grains and bin 20 for the largest ones. Light colors alent to minimizing the root-mean-square error (RMSE). Op-
denote low activation, and darker red denotes higher activa- timizing for MAE achieves slightly lower errors under both
tion. To harmonize the activations to a common scale, [0, 1], metrics (3.04 cm2 and 0.99 cm, respectively). However, opti-
for visualization, we pass the maps through a softmax over mizing for MAE results in significantly stronger bias, with a
bins. This can be interpreted as a probability distribution over ME of −0.11 cm (underestimation) compared to 0.02 cm for
grain size bins at each pixel of the downsampled patch. The the MSE. As for practical applications a low bias is consid-
resulting activation maps in Fig. 10 exhibit plausible patterns, ered more important, we use GRAINet trained with the MSE
with smaller grains activating the corresponding lower bin loss for further comparisons. This yields a MAE of 1.1 cm
numbers. (18 %) and an RMSE of 1.7 cm (27 %), respectively. Anal-
ogous to Buscombe (2013), the corresponding normalized
5.2.5 Grading curves for entire gravel bars errors in parenthesis are computed by dividing through the
overall mean dm of 6.2 cm (Fig. 5).
We compute grading curves from the predicted relative fre-
quency and volume distributions as described in Sect. 3.2. 5.3.2 Performance for different regression targets
Furthermore, we average the individual curves to obtain a
single grading curve per gravel bar. We show example grad- If our target quantity is the dm , we now have different strate-
ing curves obtained with the three different loss functions gies. The classical multistep approach would be to measure
in Fig. 11. The top row shows a distribution of rather fine frequencies, convert them to volumes, and derive the dm from
grains, while the bottom row represents a gravel bar of coarse those. Instead of estimating the frequency, we could also di-
grains. Regarding the fine gravel bar (Fig. 11a–c), the dif- rectly estimate volumes or predict the dm directly from the
ference between the three loss functions is hard to observe. image data. Which approach works best? Based on the results
Hydrol. Earth Syst. Sci., 25, 2567–2597, 2021 https://doi.org/10.5194/hess-25-2567-2021N. Lang et al.: GRAINet: mapping grain size distributions in river beds from UAV images 2579
Figure 8. Example image tiles where the GRAINet regression of the relative frequency and volume distributions yields good performance.
Table 2. Results for GRAINet regressing the mean diameter dm the predicted frequency and volume distributions are 2.9 and
[cm]. Mean and standard deviation (in parenthesis) for the random 2.3 cm, respectively. That is, dm values < 3.0 cm tend to be
10-fold cross-validation. The rows correspond to the CNN models overestimated when derived from intermediate histograms.
trained with the respective loss function. While both MSE and MAE This is mainly due to unfavorable error propagation, as slight
are minimized (↓), the ME is optimal with zero bias (0). overestimates of the larger fractions are amplified into more
serious overestimates of the characteristic mean diameter dm .
MSE (↓) MAE (↓) ME (0) While the dm derived from the volume prediction yields a
MSE 3.05 1.05 0.02 comparable MAE of 0.7 cm for ground truth dm < 3 cm, only
Loss
(1.03) (0.13) (0.18) the end-to-end regression is able to predict extreme, small,
MAE 3.04 0.99 −0.11 but apparently rare, values (Fig. 14). The end-to-end dm re-
(1.03) (0.12) (0.25) gression yields a MAE of 0.9 cm for dm values between 3
and 10 cm and 2.2 cm for values > 10 cm.
We conclude that end-to-end regression of dm performs
shown so far (Tables 1 and 2), we compare the dm values de- best. It achieves the lowest overall MAE (< 1.1 cm), and at
rived from frequency and volume distributions (trained with the same time it is able to correctly recover dm below 3.0 cm.
KLD) to the end-to-end prediction of dm (trained with MSE);
see Fig. 13. Regardless of the GRAINet target, the ME lies 5.3.3 Mean dm for entire gravel bars
within ±0.7 cm, the MAE is smaller than 1.5 cm, and the ab-
solute dispersion increases with increasing dm . With ground Robust estimates of characteristic grain sizes (e.g., dm , d50 )
truth dm values ranging from 1.3 to 29.3 cm, only the end- for entire gravel bars or a cross-sections are important to sup-
to-end dm prediction covers the full range down to 1.3 and port large-scale analysis of grain size characteristics along
up to 24 cm. In contrast, the smallest dm values derived from gravel-bed rivers (Rice and Church, 1998; Surian, 2002; Car-
https://doi.org/10.5194/hess-25-2567-2021 Hydrol. Earth Syst. Sci., 25, 2567–2597, 2021You can also read