Government Expenditure on Maternal Health and Family Planning Services for Adolescents in Mexico, 2003-2015 - MDPI
←
→
Page content transcription
If your browser does not render page correctly, please read the page content below
International Journal of
           Environmental Research
           and Public Health

Article
Government Expenditure on Maternal Health and
Family Planning Services for Adolescents in
Mexico, 2003–2015
Leticia Avila-Burgos 1 , Julio César Montañez-Hernández 1, * , Lucero Cahuana-Hurtado 2 ,
Aremis Villalobos 3 , Patricia Hernández-Peña 4 and Ileana Heredia-Pi 1
 1    Center for Health Systems Research, The National Institute of Public Health, Cuernavaca 62100, Morelos,
      Mexico; leticia.avila@insp.mx (L.A.-B.); ileana.heredia@insp.mx (I.H.-P.)
 2    School of Public Health and Administration, Universidad Peruana Cayetano Heredia, Lima 15102, Peru;
      cahuana.luce@gmail.com
 3    Center for Population Health Research, The National Institute of Public Health, Cuernavaca 62100, Morelos,
      Mexico; alvillalobos@insp.mx
 4    Netherlands Interdisciplinary Demographic Institute-KNAW, University of Groningen, 2511 CV The Hague,
      The Netherlands; hernandez@nidi.nl
 *    Correspondence: julio.montanez@insp.mx

 Received: 18 March 2020; Accepted: 27 April 2020; Published: 29 April 2020

 Abstract: The purpose of this study was to assess whether government policies to expand the coverage
 of maternal health and family planning (MHFP) services were benefiting the adolescents in need.
 To this end, we estimated government MHFP expenditure for 10- to 19-year-old adolescents without
 social security (SS) coverage between 2003 and 2015. We evaluated its evolution and distribution
 nationally and sub-nationally by level of marginalization, as well as its relationship with demand
 indicators. Using Jointpoint regressions, we estimated the average annual percent change (AAPC)
 nationally and among states. Expenditure for adolescents without SS coverage registered 15% for
 AAPC for the period 2003–2011 and was stable for the remaining years, with 88% of spending
 allocated to maternal health. Growth in MHFP expenditure reduced the ratio of spending by 13%
 among groups of states with greater/lesser marginalization; nonetheless, the poorest states continued
 to show the lowest levels of expenditure. Although adolescents without SS coverage benefited from
 greater MHFP expenditure as a consequence of health policies directed at achieving universal health
 coverage, gaps persisted in its distribution among states, since those with similar demand indicators
 exhibited different levels of expenditure. Further actions are required to improve resource allocation
 to disadvantaged states and to reinforce the use of FP services by adolescents.

 Keywords: government health expenditure; adolescents; maternal health; family planning

1. Introduction
     Mexico and other Latin American countries need to invest in the sexual and reproductive health
of adolescents [1–4]. Ensuring the availability of healthcare and promoting healthy behaviors in this
population group generate economic benefits that improve future labor productivity. Efforts on behalf
of adolescents also contribute to reducing risks, such as complications during pregnancy in very young
women, as well as preventing premature births and low-birthweight babies [3,5]. From a human rights
perspective, adolescents are entitled to receive the information and health services they need to survive,
grow, and realize their full potential as individuals [1,3,5].
     As a result of Mexican population dynamics, adolescents now exert an unprecedented impact on
national demographics. With nearly one-fourth of the population being aged 10–19 years in 2014 [6],

Int. J. Environ. Res. Public Health 2020, 17, 3097; doi:10.3390/ijerph17093097      www.mdpi.com/journal/ijerph
Int. J. Environ. Res. Public Health 2020, 17, 3097                                                  2 of 17

the health needs of adolescents have acquired particular relevance. Their behavior has evolved towards
early initiation of sexual activity [7,8] with limited use of contraceptive methods (CMs), especially
among the poorer groups [9,10]. With a fertility rate that grew from 64 births per 1000 adolescents
(15–19 years old) in 2009 to 77 births in 2014 [10,11], Mexico ranks first in adolescent fertility among
Organization for Economic Cooperation and Development (OECD) member states [12]. The healthcare
system needs to strengthen its response such that the health expectations and requirements of this age
group are addressed and their access to health services is expanded.
     Over two decades ago, Mexico launched its System of Social Protection in Health (Sistema de
Protección Social en Salud) with the aim of achieving universal health coverage. Its principal component,
the Seguro Popular health insurance scheme, was conceived as a mechanism for enhancing service
coverage and providing financial protection to the 45% non-salaried population in Mexico without
access to social security (SS) [13,14]. Within this scheme, improving maternal health (MH) through
greater coverage has been considered a core objective. An example of this commitment was the
introduction of the Healthy Pregnancy Strategy (Estrategia Embarazo Saludable) in 2008. This program
incorporated all pregnant women without SS coverage into the Seguro Popular, providing them with
a package of MH services free of charge [15]. Although adolescents without SS coverage were not
explicitly targeted by these initiatives, they benefited from the increased supply of maternal health
(MH) and family planning (FP) services [16,17].
     In 2009, Mexico stepped up its efforts to improve availability of sexual and reproductive health
services for adolescents. One upshot was the Model of Comprehensive Care for the Sexual and
Reproductive Health of Adolescents implemented in 2013. Two years later, having recognized
adolescent pregnancy as a national problem, Mexico established the National Strategy for the Prevention
of Adolescent Pregnancy. This initiative was designed to reduce the fertility rate among adolescents
aged 15–19 years and to eradicate pregnancy among those aged 10–14 years [8]. One of its principal
components was greater coverage for sexual and reproductive health services and modern contraception
methods (CMs). To this end, the National Strategy engaged numerous public health institutions—those
pertaining to the Social Security Institute, which covered 43% of the population, and those serving the
population without SS coverage through the Seguro Popular, the State Health Services, and the IMSS
PROSPERA Program, renamed IMSS Bienestar at the close of 2018 [18,19].
     These initiatives expanded the coverage of antenatal care services [16] and improved the availability
of CMs for the adolescent population lacking SS coverage [7,9], thereby mobilizing greater resources
from the government. To facilitate the transfer of funds to State Health Services, the System of Social
Protection in Health introduced a per capita payment scheme based on the number of affiliates. This
was intended to overcome the historical inertia in the distribution of funds [20].
     The Mexican Reproductive Health Account system offers information on public maternal health
and family planning (MHFP) spending from 2003 to 2015 [21], which serves to monitor and analyze
the resources and performance of these services during this period [17,19,22,23]. However, data are
not disaggregated by age group, and the consequences of changes in MHFP spending for adolescents
without SS coverage are therefore unknown. To assess whether policies for expanding the coverage of
maternal health and family planning (MHFP) are benefiting the adolescents in need, we (1) estimated
MHFP expenditure for the entire adolescent population without SS coverage and determined its growth
and distribution among MH and FP services and providers for the period 2003–2015; (2) analyzed the
expenditure gaps among states by level of marginalization; and (3) examined the relationship between
MHFP spending and demand indicators. Given that changes in the health system have centered on the
population without SS coverage, we confined our analyses to this population.

2. Material and Methods
    We conducted an ecological study in order to estimate government MHFP expenditure for
adolescents without SS coverage. To achieve this, we drew data for 2003–2015 from the Reproductive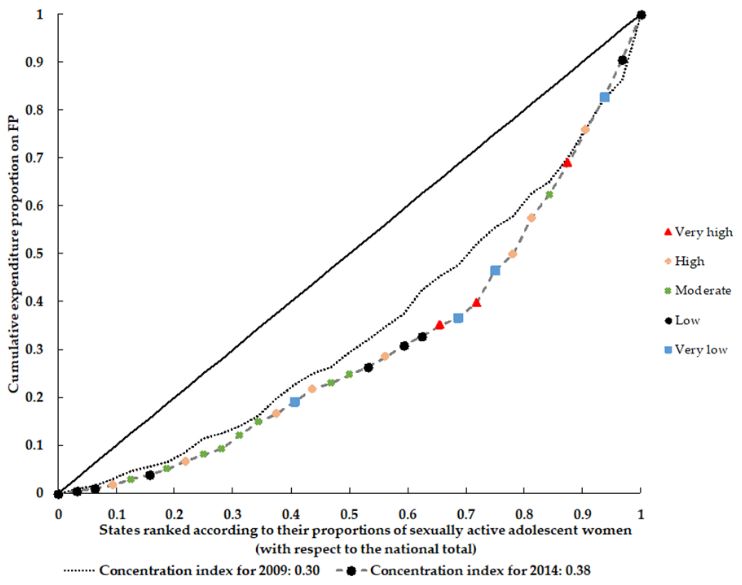
Int. J. Environ. Res. Public Health 2020, 17, 3097                                                   3 of 17

Health Accounts [21], constructed according to the OECD System of Health Accounts [24] and the World
Health Organization’s Guide to Producing Reproductive Health Subaccounts [25].

2.1. MHFP Expenditure for Adolescents
      Analysis included government strategies aimed at the population without SS coverage, namely
the Seguro Popular insurance and care providers, the State Health Services, and the IMSS PROSPERA
Program [19,21]. Expenditure for adolescents was grouped according to care providers, specifically
hospitals and ambulatory-care centers [21,24]. The selection of beneficiaries focused on young people
between 10 and 19 years old, the age range for adolescence established by the Specific Action Program
for the Sexual and Reproductive Health of Adolescents [26].
      To estimate expenditure for the adolescent population, we carried out the following procedures.
First, we identified the number of MH and FP consultations offered by ambulatory-care centers to 10-
to 19-year-olds without SS coverage. Calculations were undertaken by type of service (MH or FP), year,
and state. Subsequently, we estimated the proportions of these consultations with respect to the total
number of MH and FP consultations offered to the total population without SS coverage. Likewise,
we weighted MH and FP expenditures incurred by hospitals using the proportions of in-hospital
days and consultations offered to adolescents without SS coverage. Based on OECD and WHO
methodology [24], we used these proportions to weight the MH and FP expenditures sustained by
ambulatory-care centers and hospitals for the total population lacking SS coverage. The underlying
assumption was that spending was similar for comparable types of in-hospital days and consultations
regardless of the ages of patients. Analyses covered 131.9 million in-hospital days as well as 1571 million
general and specialized in-hospital consultations. We obtained the data from the General Directorate
of Health Information under the Federal Ministry of Health (DGIS) [27], and grouped them according
to the International Classification of Diseases, 10th Revision (ICD-10) [28].
      MH services included care during pregnancy, childbirth (vaginal or cesarean), and the postpartum
period, as well as abortion. FP services included counseling, consultations, the provision of CMs
(hormonal or otherwise), and the performance of definitive surgical procedures (tubal ligation and
vasectomy) for the entire adolescent population, 10 to 19 years old. Consultations were grouped by
provider (hospital or ambulatory-care center).
      We calculated MHFP expenditure in constant US dollars and converted the figures to 2015
international dollars (Purchasing Power Parity, PPP, 2015 US$1 = MXN 8.541) [29]. To establish a
comparison among states, we adjusted MHFP expenditure by adolescent women aged 10–19 according
to DGIS data [27].

2.2. Demand Indicators
     Demand has been defined as the proportion of a population experiencing health needs and
requiring health services to satisfy them. For the purposes of this study, we defined the demand
indicator for MH services as the number of pregnant adolescents without SS coverage, and for
FP services as the number of sexually active adolescent women without SS coverage. To estimate
these indicators, we used data from the 2009 and 2014 National Surveys of Demographic Dynamics
(ENADIDs) [30]. Although the ENADID design identifies fertility and pregnancy at the population
level, it captures information only on pregnancies among 15- to 54-year-old women. Thus, our demand
indicator for MH services included only 15- to 19-year-old adolescents who were pregnant at the time
of the surveys or the year before. Under the demand indicator for FP services, we included adolescent
women between the ages of 15 and 19 who were sexually active during the month prior to the surveys
and those aged 10 to 19 who became sexually active during the survey period.
     To ensure comparability, we constructed the MHFP indicators for adolescents in accordance with
international practices. For instance, we considered women as the basis of our CM demand indicators
given the distinct impact that the use/non-use of CMs exerts on their reproductive health and risk of
pregnancy. Moreover, female contraceptives offer a wider range of methods and costs compared to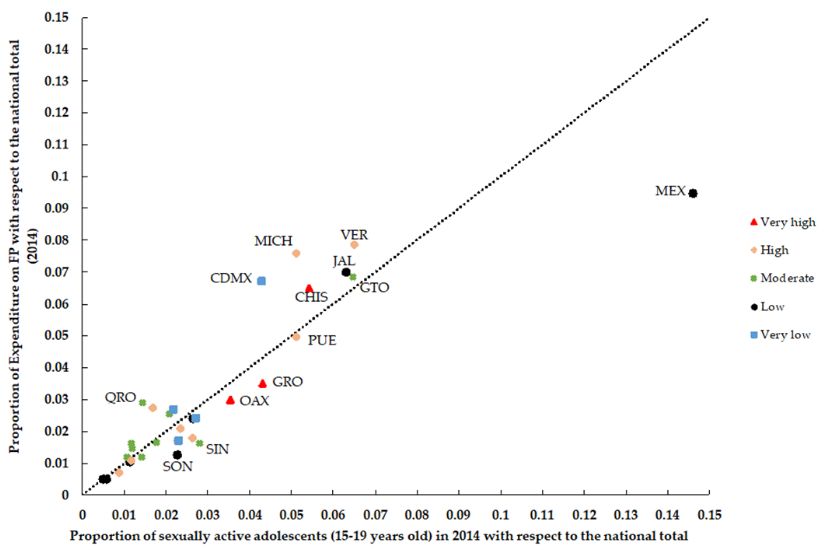
Int. J. Environ. Res. Public Health 2020, 17, 3097                                                  4 of 17

male contraceptives, limited mostly to condoms available at lower costs [31,32]. For these reasons,
most resource-tracking methodologies, including the Health Accounts, base their indicators of FP
spending on women as the common denominator [25]. Finally, international recommendations on
investment in adolescent FP activities also consider women as the basis, particularly in light of the
high-priority problem of adolescent motherhood [33]. We obtained data on the size of the adolescent
population lacking SS coverage for the period 2010–2018 from the DGIS databases [27]. As information
was unavailable for the period prior to 2010, we calculated data from 2003 to 2009 based on the average
annual growth of the adolescent population without SS coverage during 2010–2018. States were
grouped according to the State Marginalization Index of the National Population Council [34].

2.3. Analytical Strategy
      To assess growth in MHFP spending during the period 2003–2015, we estimated the average
annual percent change (AAPC) in MHFP expenditure through Jointpoint regression models [35].
Given the inertial allocation in the health budget [36], we adjusted the models using the logarithm
of expenditure with autocorrelated errors. For 2009 and 2011, we inserted nodes on the introduction
of the Healthy Pregnancy Strategy and its efforts to enroll the entire non-SS population in the SP,
respectively. For each program, we estimated the ambulatory-care center/hospital ratio as an indicator
of the relative growth in expenditure at ambulatory- and primary-care centers.
      To analyze the alignment of expenditure with the population requiring MH and FP services
among states, we calculated and assessed the concentration indices (CIs) for 2009 and 2014 based on
their concentration curves. This involved the following procedures: (a) we calculated the proportions
of public MH and FP expenditures spent in state j with respect to total MH and FP expenditures at the
national level, respectively; (b) we calculated the proportion of the population requiring these services
in state j with respect to the total population requiring these services at the national level; and (c) we
generated concentration curves by arranging the states on the x-axis according to the proportions of
populations needing these services, from the lowest to the highest, and connecting them with their
respective proportions of expenditures on the y-axis. The CI is the area between the concentration
curve and the diagonal, and its values range from −1 to 1, with zero denoting equality [37]. Finally,
we analyzed the expenditure and population data for 2014 by creating scatter plots and estimating
Spearman correlations to ascertain their relationships and statistical significance. We used STATA
version 13.0 for the analyses [38].

2.4. Ethical Considerations
     To obtain data on service production (in-hospital days as well as consultations offered at hospitals
and ambulatory-care centers), we used secondary public sources and the ENADID database, neither
of which contained personally identifiable information. For expenditures, we used the Reproductive
Health Accounts. This study was approved by the Research Ethics Committee of the National Institute
of Public Health (No. 577-2016).

3. Results
     In 2015, MHFP expenditure for the adolescent population without SS coverage totaled
US$428 million, 88% of which was spent on MH. Meanwhile, the AAPC for the period 2003–2011
amounted to 15.4% (CI95%: 14.3−16.5) (Figure 1b and Table 1). The MH/FP ratios stood at 21.3 in 2003
and 7.5 in 2015. At the national level, expenditure per adolescent woman in the 10–19 age group rose
from US$17 in 2003 to $64 in 2015 (Figure 1a,b and Table 1).
     MH and FP services demonstrated different rates of growth for expenditures, which modified the
distribution of funds among healthcare providers (Figure 2). From 2003 to 2011, spending on antenatal
care in ambulatory-care centers showed an AAPC of 29.3% (CI95%: 23.5–35.4). Accordingly, while
61% of expenditure in ambulatory-care centers was used to finance antenatal care in 2003, this figure
had grown to 85% by 2015. Spending on postpartum care grew at an annual rate of 9.3% from 2003 to
Int. J. Environ. Res. Public Health 2020, 17, 3097 5 of 17
2009 (CI95%: 5.4–7.8) and 5.5% during the rest of the period analyzed (CI95%: 4.2–6.8) (Table 1 and
Figure 2a).
Hospital spending on MH complications and childbirth registered an AAPC of 14.3% (CI95%:
13.2–15.5 and 11.9–16.8, respectively) from 2003 to 2009; the AAPC for the rest of the period analyzed
was lower. Meanwhile, hospital spending on antenatal consultations, at a lower level, showed an
annual growth rate of 8.1% (CI95%: 4.0–12.5) from 2003 to 2009, and 3.0% (CI95%: 1.5–4.5) from that
year until 2015 (Table 1 and Figure 2b). The ambulatory-care center/hospital ratio of expenditure on
MH services reflected a higher growth rate in ambulatory-care centers—in 2003, for each dollar spent
by hospitals on MH, ambulatory-care centers spent $0.3. By 2015, the ratio was 0.6.
In contrast with MH, FP expenditure was predominantly spent at ambulatory-care centers
(Figure 3). Until 2008, the trends and levels of FP expenditure at hospitals and ambulatory-care centers
were similar. However, from 2009 to 2011, spending by ambulatory-care centers experienced its period
of greatest growth, with an AAPC of 130.6% (CI95%: 25.5–323.7). Thus, although hospital spending
grew at an annual rate of 6.6% (CI95%: 3.7–9.5), by the end of the period analyzed, the ambulatory-care
center/hospital spending ratio for FP services was 11 (Figure 3 and Table 1).
Table 2 shows that national expenditure on MHFP per adolescent woman had an AAPC of 11.8%
(CI95%: 9.2–14.5) during the period 2003–2015. The increase in spending per adolescent woman
reduced the gap between states with higher and lower levels of spending by 48% (from 5.96 in 2003 to
3.15 in 2015). Furthermore, the expenditure gap between states with higher and lower levels of social
marginalization diminished by 13% (1.92 in 2003 and 1.68 in 2015). Although regions classified as
having moderate, high, and very high levels of marginalization increased their spending per adolescent
by 12% per year, no significant differences emerged in the annual rates among the five regions.Int. J. Environ. Res. Public Health 2020, 17, 3097 6 of 17
Int. J. Environ. Res. Public Health 2020, 16, x FOR PEER REVIEW 6 of 16
(a) MHPF expenditure in millions of US dollar (b) MHPF expenditure per adolescent woman aged 10–19, US
dollar
Figure 1.Maternal
Figure 1. Government Government Maternal
Health Health
and Family and Family
Planning Planning
(MHFP) (MHFP)for
expenditure expenditure
adolescentsfor adolescents
aged aged 10–19
10–19 without Socialwithout
SecuritySocial Security
coverage, coverage,
Mexico, Mexico, 2003–2015,
2003–2015,
US$
US$ (PPP 2015). (PPP 2015).
Table 1. Average annual percent change in government Maternal Health and Family Planning (MHFP) expenditure for the entire adolescent population aged 10–
19 without Social Security coverage, Mexico, 2003–2015.
2003–2009 2009–2011 2011–2015
AAPCa [CI 95%] AAPCa [CI 95%] AAPCa [CI 95%]
Government MHFP expenditure for adolescents 15.4b [14.3–16.5] 15.4b [14.3–16.5] 3.9 [−3.1−11.4]
16.1b [14.4–17.7] 11.6b [7.7–15.8] 3.2 [−2.2−8.8]
Government MH expenditure for adolescent women
Ambulatory-care centers
Antenatal care 29.3b [23.5–35.3] 29.3b [23.5–35.3] 6.1 [−17.4−36.4]
Postpartum care 9.7b [3.5–16.3] 5.5b [4.2–6.8] 5.5b [4.2–6.8]
Hospitals
Complications during pregnancy, childbirth and
14.3b [13.2–15.5] 8.3b [5.6–11.0] 1.3 −3.0−5.8]
puerperium
Childbirth care 14.3b [11.9–16.8] 2.7b [0.3–5.2] 2.7b [0.3–5.2]Int. J. Environ. Res. Public Health 2020, 17, 3097 7 of 17
Table 1. Average annual percent change in government Maternal Health and Family Planning (MHFP) expenditure for the entire adolescent population aged 10–19
without Social Security coverage, Mexico, 2003–2015.
2003–2009 2009–2011 2011–2015
AAPC a [CI 95%] AAPC a [CI 95%] AAPC a [CI 95%]
Government MHFP expenditure for adolescents 15.4 b [14.3–16.5] 15.4 b [14.3–16.5] 3.9 [−3.1−11.4]
Government MH expenditure for adolescent women 16.1 b [14.4–17.7] 11.6 b [7.7–15.8] 3.2 [−2.2−8.8]
Ambulatory-care centers
Antenatal care 29.3 b [23.5–35.3] 29.3 b [23.5–35.3] 6.1 [−17.4−36.4]
Postpartum care 9.7 b [3.5–16.3] 5.5 b [4.2–6.8] 5.5 b [4.2–6.8]
Hospitals
Complications during pregnancy, childbirth and puerperium 14.3 b [13.2–15.5] 8.3 b [5.6–11.0] 1.3 −3.0−5.8]
Childbirth care 14.3 b [11.9–16.8] 2.7 b [0.3–5.2] 2.7 b [0.3–5.2]
Antenatal and postpartum consultations 8.1 b [4.0–12.5] 3.0 b [1.6–4.5] 3.0 b [1.6–4.5]
Government FP expenditure for the entire adolescent population 9.3 b [2.2–16.9] 92.3 [-8.4-303.9] 16.5 [−7.3−46.5]
Ambulatory-care centers
FP consultations and counseling 4.6 [-0.4-9.8] 130.6 b [25.5–323.7] 19.1 [−0.5−42.5]
Hospitals
Definitive FP methods 6.6 b [3.8–9.5] 6.6 b [3.8–9.5] 6.6 b [3.8–9.5]
a AAPC: Jointpoint models adjusted for autocorrelated errors due to inertial spending behavior (95%). b p < 0.05 value.FP consultations and counseling 4.6 [-0.4-9.8] 130.6 [25.5–323.7] 19.1 [−0.5−42.5]
Hospitals
Definitive FP methods 6.6b [3.8–9.5] 6.6b [3.8–9.5] 6.6b [3.8–9.5]
a AAPC: Jointpoint models adjusted for autocorrelated errors due to inertial spending behavior (95%).b p < 0.05 value.
Int. J. Environ. Res. Public Health 2020, 17, 3097 8 of 17
(a) MH expenditure at ambulatory-care center (b) MH expenditure at hospital
Figure
Figure 2. 2. GovernmentMaternal
Government MaternalHealth
Health(MH)
(MH)expenditure
expenditure for
for adolescent
adolescent women
womenaged
aged10–19,
10–19,without
withoutSocial
SocialSecurity
Securitycoverage, byby
coverage, type of of
type healthcare provider,
healthcare provider, Mexico,
Mexico, 2003–2015,
2003–2015, US$(PPP
US$ million million (PPP 2015).
2015).Int. J. Environ. Res. Public Health 2020, 17, 3097 9 of 17
Int. J. Environ. Res. Public Health 2020, 16, x FOR PEER REVIEW 8 of 16
Figure 3.3. Government
Figure Government Family
Family Planning
Planning (FP)
(FP) expenditure
expenditure for
for the
the entire
entire adolescent
adolescent population
population aged
aged
10–19
10–19 without Social Security coverage, by type of healthcare provider, Mexico, 2003–2015,$$million
without Social Security coverage, by type of healthcare provider, Mexico, 2003–2015, million
(PPP 2015).
(PPP 2015).
Finally, Figure 4 shows the concentration curve for expenditures on MH and FP and the correlations
Finally, Figure 4 shows the concentration curve for expenditures on MH and FP and the
between expenditures and their respective demand indicators. In 2009 and 2014, half of the states (n = 16)
correlations between expenditures and their respective demand indicators. In 2009 and 2014, half of
concentrated less than 30% of the expenditures (concentration index = 0.32 for both years) (Figure 4a).
the states (n = 16) concentrated less than 30% of the expenditures (concentration index = 0.32 for both
However, for FP expenditure, the levels of inequality increased between 2009 and 2014 (CI = 0.30 and
years) (Figure 4a). However, for FP expenditure, the levels of inequality increased between 2009 and
CI = 0.38, respectively) (Figure 4b). On the other hand, although a positive and significant correlation
2014 (CI = 0.30 and CI = 0.38, respectively) (Figure 4b). On the other hand, although a positive and
emerged between expenditure on MH at the state level and its demand indicator (rho > 0.9476,
significant correlation emerged between expenditure on MH at the state level and its demand
p < 0.05), differences were observed in the distribution of spending. For example, states such as
indicator (rho > 0.9476, p < 0.05), differences were observed in the distribution of spending. For
Michoacan (MICH) and Guerrero (GRO) exhibited different levels of spending (Figure 4c) despite
example, states such as Michoacan (MICH) and Guerrero (GRO) exhibited different levels of
having comparable proportions of pregnant adolescents. The situation was similar for expenditure on
spending (Figure 4c) despite having comparable proportions of pregnant adolescents. The situation
FP (rho > 0.9016, p < 0.05), where Guerrero (GRO) and Mexico City (CDMX) presented comparable
was similar for expenditure on FP (rho > 0.9016, p < 0.05), where Guerrero (GRO) and Mexico City
proportions of sexually active adolescents (Figure 4d) but different expenditure levels. Likewise,
(CDMX) presented comparable proportions of sexually active adolescents (Figure 4d) but different
Figure 4c indicates that the MH expenditure levels in states with a low marginalization status, such
expenditure levels. Likewise, Figure 4c indicates that the MH expenditure levels in states with a low
as Jalisco (JAL) were similar to those of highly marginalized states and smaller populations, such as
marginalization status, such as Jalisco (JAL) were similar to those of highly marginalized states and
Tabasco (TAB) and San Luis Potosí (SLP).
smaller populations, such as Tabasco (TAB) and San Luis Potosí (SLP).Int. J. Environ. Res. Public Health 2020, 17, 3097 10 of 17
Table 2. Government MHFP expenditure per adolescent woman aged 10–19. States grouped by level of marginalization, Mexico, 2003–2015 ($ [PPP 2015]).
2003 2004 2005 2006 2007 2008 2009 2010 2011 2012 2013 2014 2015 AAPC a [CI95%]
National spending 17.0 19.3 21.7 26.4 31.1 37.5 41.0 42.8 57.1 64.3 68.9 68.5 64.4 11.8 [9.2–14.5]
Min (state) 7.0 6.5 8.9 11.6 19.8 22.9 26.0 26.3 37.1 38.2 44.8 44.2 38.0 17.2 [10.8–23.9]
Max (state) 42.0 48.9 61.7 84.3 96.6 112.2 106.1 88.9 114.8 158.4 113.8 125.4 119.7 10.1 [4.8–15.7]
Ratio Max/Min 5.96 7.55 6.91 7.25 4.89 4.91 4.08 3.38 3.09 4.15 2.54 2.84 3.15
Marginalization b
Very low 98 116 123 151 169 229 244 233 274 362 327 306 326 10.0 [6.5–13.6]
Low 198 236 226 289 338 393 460 451 520 569 592 595 572 9.6 [7.2–12.1]
Moderate 193 227 224 274 315 350 395 418 567 657 680 736 693 12.8 [11.3–14.4]
High 160 197 242 308 334 379 386 368 549 582 637 649 616 12.1 [9.8–14.4]
Very high 51 55 62 73 87 104 109 119 159 186 213 212 194 12.6 [9.5–15.8]
Ratio: very high/very low 1.92 2.09 1.98 2.07 1.95 2.19 2.24 1.96 1.72 1.95 1.54 1.44 1.68
a b
AAPC: (Average Annual Percent Change); Jointpoint models adjusted for autocorrelated errors due to inertial spending behavior (95%) States grouped by level of marginalization [31]:
very high marginalization: Chiapas (CHIS), Oaxaca (OAX) and Guerrero (GRO); high marginalization: Puebla (PUE), Hidalgo (HGO), Tabasco (TAB), Veracruz (VER), San Luis Potosi
(SLP), Campeche (CAMP), Michoacan (MICH) and Yucatan (YUC); moderate marginalization: Queretaro (QRO), Guanajuato (GTO), Tlaxcala (TLAX), Quintana Roo (QROO), Morelos
(MOR), Sinaloa (SIN), Zacatecas (ZAC), Durango (DGO) and Nayarit (NAY); Low marginalization: Jalisco (JAL), Mexico (MEX), Aguascalientes (AGS), Sonora (SON), Colima (COL),
Chihuahua (CHIH), Tamaulipas (TAMP) and Baja California Sur (BCS); very low marginalization: Baja California (BC), Coahuila (COAH) Nuevo Leon (NL), and Mexico City (CDMX).Int. J. Environ. Res. Public Health 2020, 17, 3097
Int. J. Environ. Res. Public Health 2020, 16, x FOR PEER REVIEW 10 of 16 11 of 17
(a) Distribution of MH expenditure for adolescent women. (b) Distribution of FP expenditure for adolescent women.
(c) Spearman’s rho for MH 2014 = 0.9476. (d) Spearman’s rho for FP 2014 = 0.9014.
Figure 4. Concentration curves and correlations: government MH and FP expenditure for adolescent
Figure 4. Concentration curves and correlations: government MH and FP expenditure for adolescent women (15–19 years old) without Social Security coverage but
women (15–19 years old) without Social Security coverage but with potential demand indicators
with potential demand indicators (Mexico, 2009 and 2014).
(Mexico, 2009 and 2014).
4. Discussion
The adolescent population is one of the groups where public policy could have the most
dramatic impact given the repercussions for health and wellbeing and the economic benefits these
policies would generate [1,4]. In a context of limited resources, it is crucial to identify the areas ofInt. J. Environ. Res. Public Health 2020, 17, 3097 12 of 17
4. Discussion
The adolescent population is one of the groups where public policy could have the most dramatic
impact given the repercussions for health and wellbeing and the economic benefits these policies
would generate [1,4]. In a context of limited resources, it is crucial to identify the areas of opportunity
in which investments in the healthy development of this population group would be most efficiently
used. In this regard, the results of this study indicate that efforts by the Mexican government to expand
healthcare coverage for the population without Social Security (SS) coverage benefited the non-SS
adolescent population. Thus, government expenditure on maternal health and family planning (MHFP)
showed an average annual percent increase of 15% for the period 2003–2011 but no significant change
in the remaining years. During 2003–2015, MHFP expenditure for non-SS adolescents represented
25% of government MHFP expenditure for the total population lacking SS coverage [21]. Nonetheless,
despite the growth in spending, inequalities in distribution persisted. The adolescent population living
in the most marginalized states and suffering from the greatest level of economic inequality, as well as
historical differences in resource allocation [16,17,39] continues to demonstrate below-average levels of
per capita spending.
In terms of sexual and reproductive health, it has been documented that the Mexican adolescent
population has low rates of contraceptive use and difficulty in planning their sexual lives [7,9,40].
For these reasons, the first contact this population has with health services is generally to receive
antenatal care, and their use of CMs frequently begins after the first pregnancy [8]. These patterns result
in a situation in which antenatal, childbirth, and postpartum care claim 88% of MHFP expenditure for
adolescents. The results show a greater increase in expenditure for MH services in ambulatory-care
centers than in hospitals. This difference is explained primarily by a surge in the volume of antenatal
consultations offered to adolescents without SS coverage (which rose from 66,436 in 2003 to 1.56 million
in 2015) [21]. Despite an improvement in antenatal coverage for pregnant adolescents rising from
61% to 71.8% between 2000 and 2012 [16], the figures continue to be lower, especially in marginalized
communities, than those achieved for pregnant adults (20 years and older) [16,41,42]. Because pregnancy
during adolescence increases the risk of obstetric complications [1], it is hardly surprising that a third
of MH expenditure was spent on hospital care for complications arising during pregnancy, childbirth,
and the postpartum period.
With regard to FP expenditure, the observed annual increase of 130% incurred by ambulatory-care
centers from 2009 to 2011 was a reflection of various events: (a) an increase in the number of people
enrolled in the Seguro Popular from 9.1 million in 2009 to 43.5 million in 2010, which enhanced
the coverage of health services, FP included, for the population lacking SS coverage [9,13,14,43];
(b) the strengthening of the FP program specifically for adolescents, leading to an increase in
post-obstetric-event contraception [42] and which boosted the percentages of sexually active adolescents
using a CM in their first sexual intercourse from 43% to 66% in women and from 70% to 85% in men,
where the latter was attributed to greater male condom use [44]; and (c) the centralization and increase
in the purchase of CMs [8]. As a result of higher FP expenditure, spending per adolescent woman
10–19 years old rose from US$0.8 in 2003 to $7.5 in 2015, reaching the threshold of $2.93 per woman
per year since 2011, as recommended by the Guttmacher Institute [33]. In spite of these advances,
however, deficiencies in CM coverage persist, and sexually active adolescents continue to be the group
with the lowest rate of CM use in Mexico [9,40]. Evidence indicates that investment in FP programs
generates significant monetary and social returns [34,45]. It has been estimated that each additional
dollar invested in satisfying the demand for modern CMs generates savings of US$2–6 in healthcare
spending for pregnant women and newborns [34]. If we also include the long-term effects of reducing
maternal and infant mortality and increased economic growth, savings rise to US$60–120 per dollar
spent on FP services [45]. This underlines the relevance of continuing to invest in FP for adolescents,
as well as the need to make more efficient use of these resources.
Our results document the growing importance of ambulatory-care centers as health-service
providers. These providers will no doubt continue to increase in importance, given that the currentInt. J. Environ. Res. Public Health 2020, 17, 3097 13 of 17
health reform in Mexico, which has replaced the Seguro Popular with the Health Institute for Wellbeing, is
oriented towards strengthening the primary-care model for the population lacking SS coverage [46,47].
Nonetheless, the heterogeneity that characterizes ambulatory-care providers in terms of resources and
the quality of services delivered [16,48,49] suggests that it will be necessary to improve their capacity
to respond, particularly with regard to their supply of modern CMs [49].
Although government MHFP spending has increased across the board nationally, discrepancies
persist in its distribution among states, since those with similar adolescent populations in need of MH
and FP services exhibit different levels of expenditure. This could be the result of various factors, such
as the persistence of inertial allocations: (a) in 2015, 33% of the Seguro Popular budget earmarked for
payroll continued to be allocated to State Health Services on the basis of long-established, routine
procedures [39]; (b) the concentration of infrastructure and personnel have traditionally privileged
some states at the expense of others; and (c) managerial capacities have diverged and continue to vary
widely among State Health Services [17,48,50].
Our study had the following limitations: (1) our analysis was restricted to government schemes
providing coverage for the population without SS coverage, which prevents generalizing results to
the entire public health system. However, these schemes provided coverage to 45% of the Mexican
population [13,14], and their expenditures represented 46% of total public health spending in 2016 [39];
and (2) using production data to estimate the distribution of expenditure among health conditions
and/or diseases, which could lead to estimation errors. Nonetheless, the OECD has evaluated this
methodology in various countries, demonstrating its validity and consistency [51]. The WHO [52],
as well as the OECD [53] encourage its use. (3) The age range considered for the demand indicators
of MH services was also 15–19 years. After reviewing a variety of data sources, such as the Birth
Information Subsystem, we decided to use data from the National Survey of Demographic Dynamics
(ENADID). We arrived at this decision because the Birth Information database omits deceased children
and abortions. Information from the ENADID thus provided the closest approximation to the adolescent
pregnancy phenomenon under study. In addition, it has been documented that pregnant women under
15 register their children with the appropriate authorities later than other women [54]. (4) Finally,
it should be noted that expenditure was analyzed at the state level, without considering the wide
variability in the distribution of local spending [17,50]. Future studies need to explore in greater detail
the relationship among MHFP resources, as well as their distribution and health outcomes at the
municipal level.
5. Conclusions
Governments around the world have recognized the need to invest in the sexual and reproductive
health of adolescents. Sustainable Development Goal 3.7 [55] calls upon countries to ensure universal
access to sexual and reproductive healthcare services, including for FP. This will require additional
resources. Financial evidence on the levels of expenditure allocated to these services and on its
distribution throughout the population is a key input for planning public investment. It serves as a
basis for governments and health authorities to define how much more they must invest, what types of
services should be prioritized, and which areas can be improved with regard to equity and efficiency.
The findings of this study fill an information gap on the levels of investment in sexual and
reproductive health services in Mexico for a group traditionally lacking visibility—the adolescents. Our
results demonstrate that the health policies implemented between 2003 and 2015 increased expenditure
on the sexual and reproductive health of adolescents without Social Security coverage; in spite of this,
however, problems persist in ensuring an equitable distribution of these resources. Looking ahead, the
implementation of specific policies for the prevention of adolescent pregnancy will require special
attention as the current health reform evolves. It will be necessary to monitor the financial implications
of the ensuing changes and their consequences for adolescent health services. Subsequent analyses
will also need to combine the allocation of expenditure with results indicators in this population in
order to understand the extent to which investments are provided equitably and efficiently.Int. J. Environ. Res. Public Health 2020, 17, 3097 14 of 17
Author Contributions: Conceptualization, L.A.-B.; data curation, formal analysis, J.C.M.-H.; validation,
methodology, L.A.-B. and J.C.M.-H.; critical review of the manuscript, writing-review and editing, L.A.-B.
and J.C.M.-H., I.H.-P., L.C.-H., P.H.-P. and A.V.; funding acquisition, I.H.-P. All authors have read and agreed to
the published version of the manuscript.
Funding: This work was supported by the CONACYT Sectoral Fund for Research in Health and Social Security in
Mexico (Grant No. 261230, year 2015). The funders had no role in study design, data collection and analysis,
decision to publish, or preparation of the manuscript.
Acknowledgments: We thank the National Center for Gender Equity and Reproductive Health of the Ministry
of Health for access to and use of data from the Reproductive Health Accounts. We also extend our thanks to
Luz Maria Montes Romero for her support in the search for and recuperation of the bibliography related to this
article, as well as to Patricia Solis Albarrán for her valuable contribution in the English translation and editing of
this work.
Conflicts of Interest: The authors declare having no conflict of interest.
References
1. World Health Organization. Adolescent Development. Maternal, Newborn, Child and Adolescent Health; WHO
Publishing: Geneva, Switzerland, 2018. Available online: http://www.who.int/maternal_child_adolescent/
topics/adolescence/development/en/ (accessed on 3 October 2019).
2. Taghizadeh Maghaddam, H.; Bahreini, A.; Ajilian Abbasi, M.; Fazli, F.; Saeidi, M. Adolescence Health:
The Needs, Problems and Attention. Int. J. Pediatr. 2016, 4, 1423–1438. [CrossRef]
3. Patton, G.C.; Sawyer, S.M.; Santelli, J.S.; Ross, D.A.; Afifi, R.; Allen, N.B.; Kakuma, R. Our future: A Lancet
commission on adolescent health and wellbeing. Lancet 2016, 387, 2423–2478. [CrossRef]
4. Ki-moon, B. Sustainability—engaging future generations now. Lancet 2016, 387, 2351–2478. [CrossRef]
5. World Health Organization. Strengthening the Health Sector Response to Adolescent Health and
Development. 2010. Available online: https://www.who.int/maternal_child_adolescent/documents/cah_
adh_flyer_2010_12_en.pdf?ua=1 (accessed on 22 January 2019).
6. Instituto Nacional de Estadística y Geografía (INEGI). Datos de Población; INEGI Publishing: Aguascalientes,
Mexico, 2015. Available online: https://www.inegi.org.mx/temas/estructura/ (accessed on 11 July 2019).
7. Hernández, M.F.; Muradás, M.C.; y Sánchez, M. Panorama de la Salud Sexual y Reproductiva, 2014.
CONAPO. La Situación Demográfica en México 2015. Available online: http://www.conapo.gob.mx/es/
CONAPO/Panorama_de_la_salud_sexual_y_reproductiva_2014 (accessed on 8 January 2019).
8. Gobierno de la República. Estrategia Nacional para la Prevención del Embarazo en Adolescentes; Gobierno
de la República: Mexico City, Mexico, 2018. Available online: https://www.gob.mx/inmujeres/acciones-y-
programas/estrategia-nacional-para-la-prevencion-del-embarazo-en-adolescentes-33454 (accessed on 20
December 2018).
9. Allen-Leigh, B.; Villalobos-Hernández, A.; Hernández-Serrato, M.I.; Suárez, L.; De la Vara, E.; De Castro, F.;
Schiavon-Ermani, R. Inicio de vida sexual, uso de anticonceptivos y planificación familiar en mujeres
adolescentes y adultas en México. Salud Publica Mex. 2013, 55, S235–S240. [CrossRef] [PubMed]
10. Instituto Nacional de Estadística y Geografía (INEGI). Encuesta Nacional de la Dinámica Demográfica
2014. In La Anticoncepción: Implicaciones en el Embarazo Adolescente, Fecundidad y Salud Reproductiva en
México; Instituto Nacional de Estadística y Geografía INEGI: Aguascalientes, Mexico, 2017. Available
online: http://coespo.qroo.gob.mx/Descargas/doc/8%20FECUNDIDAD/La%20anticoncepci%C3%B3n%
20inplicaci%C3%B3n%20en%20el%20embarazo%20en%20adolescentes%20ENADID%202014.pdf (accessed
on 12 July 2019).
11. Menkes, C.; Sosa-Sánchez, I.A. Características del Embarazo y de la Fecundidad de las Adolescentes en México.
In Retos del Cambio Demográfico de México; Avila, J., Bringas, H., López, M., Eds.; UNAM: Mexico City, Mexico,
2016; pp. 179–209. Available online: https://www.researchgate.net/publication/316981804_Caracteristicas_del_
embarazo_y_de_la_fecundidad_de_las_adolescentes_en_Mexico (accessed on 1 July 2019).
12. Organización Panamericana de la Salud, Fondo de Población de las Naciones Unidas, Fondo de las
Naciones Unidas para la Infancia. Acelerar El Progreso Hacia La Reducción Del Embarazo En La Adolescencia En
América Latina y El Caribe; Organización Panamericana de la Salud: Washington, DC, USA, 2018. Available
online: https://www.unicef.org/lac/informes/acelerar-el-progreso-hacia-la-reducci%C3%B3n-del-embarazo-
adolescente-en-am%C3%A9rica-latina-y-el (accessed on 1 July 2019).Int. J. Environ. Res. Public Health 2020, 17, 3097 15 of 17
13. Knaul, F.M.; Frenk, J. Health insurance in Mexico: Achieving universal coverage through structural reform.
Health Aff. 2005, 24, 1467–1476. [CrossRef] [PubMed]
14. Frenk, J.; Gonzalez-Pier, E.; Gomez-Dantes, O.; Lezana, M.A.; Knaul, F.M. Comprehensive reform to improve
health system performance in Mexico. Salud Publica Mex. 2007, 49, S23–S36. [CrossRef] [PubMed]
15. Gobierno de la República. Los Objetivos de Desarrollo del Milenio en México; Informe de Avances 2010; Presidencia
de la República: Mexico City, Mexico, 2011. Available online: http://www.objetivosdedesarrollodelmilenio.org.
mx/Doctos/Inf2010.pdf (accessed on 19 September 2019).
16. Saavedra-Avendaño, B.; Darney, B.G.; Reyes-Morales, H.; Serván-Mori, E. El Aseguramiento Público en
Salud Mejora la Atención en los Servicios? El caso de la Atención Prenatal en Adolescentes en México. Salud
Publica Mex. 2016, 58, 561–568. [CrossRef] [PubMed]
17. Rodríguez-Franco, R.; Serván-Mori, E.; Gómez-Dantés, O.; Contreras-Loya, D.; Pineda-Antúnez, C. Old
principles, persisting challenges: Maternal health care market alignment. PLoS ONE 2018, 13, e0199543.
[CrossRef] [PubMed]
18. Instituto Nacional de Salud Pública (INSP). Encuesta Nacional de Salud y Nutrición de Medio Camino 2016;
Informe de Resultados INSP: Mexico City, Mexico, 2016. Available online: https://www.gob.mx/cms/uploads/
attachment/file/209093/ENSANUT.pdf (accessed on 20 February 2019).
19. Avila-Burgos, L.; Cahuana-Hurtado, L.; Montañez-Hernandez, J.; Servan-Mori, E.; Aracena-Genao, B.;
del Río-Zolezzi, A. Financing Maternal Health and Family Planning: Are We on the Right Track? Evidence
from the Reproductive Health Subaccounts in Mexico, 2003–2012. PLoS ONE 2016, 11. [CrossRef] [PubMed]
20. Grupo de Trabajo de la Fundación Mexicana Para la Salud. Universalidad en los servicios de salud en
México. Salud Publica Mex. 2013, 55, EE1–EE64. [CrossRef]
21. Ávila-Burgos, L.; Montañez-Hernández, J.C.; Cahuana-Hurtado, L.; Ventura-Alfaro, C.E. Cuentas en Salud
Reproductiva y Equidad de género; Estimación 2014 y 2015 y evolutivo 2003–2015; Instituto Nacional de Salud
Pública (MX)/Secretaría de Salud (MX): Cuernavaca, Mexico, 2017. Available online: https://www.gob.mx/
cms/uploads/attachment/file/293674/CuentasSR2014_22enero.pdf (accessed on 12 January 2020).
22. Servan-Mori, E.; Avila-Burgos, L.; Nigenda, G.; Lozano, R. A Performance Analysis of Public Expenditure on
Maternal Health in Mexico. PLoS ONE 2016, 11, e0152635. [CrossRef] [PubMed]
23. Cahuana-Hurtado, L.; Avila-Burgos, L.; Pérez-Núñez, R.; Uribe-Zúñiga, P. Analysis of reproductive health
expenditures in Mexico, 2003. Rev. Panam Salud Publica 2006, 20, 287–298. [CrossRef] [PubMed]
24. Organisation for Economic Co-Operation; Development, Eurostat; World Health Organization. A System of Health
Accounts 2011: Revised Edition; OECD Publishing: Paris, France, 2017. Available online: https://ec.europa.eu/
eurostat/documents/3859598/7985806/KS-05-19-103-EN-N.pdf/60aa44b0-2738-4c4d-be4b-48b6590be1b0 (accessed
on 11 April 2019). [CrossRef]
25. World Health Organization. Guide to Producing Reproductive Health Subaccounts within the National Health
Accounts Framework; World Health Organization: Geneve, Switzerland, 2009. Available online: https:
//apps.who.int/iris/handle/10665/44181 (accessed on 24 November 2019).
26. Gobierno de la República. Programa de Acción Específico. Salud Sexual y Reproductiva Para Adolescentes
2013–2018. Available online: https://www.gob.mx/salud/acciones-y-programas/programa-de-accion-
especifico-salud-sexual-y-reproductiva-para-adolescentes-2013-2018-10072 (accessed on 24 October 2019).
27. Dirección General de Información en Salud, Secretaría de Salud. Cubos Dinámicos. Available online:
http://www.dgis.salud.gob.mx/contenidos/basesdedatos/BD_Cubos_gobmx.html (accessed on 24 July 2019).
28. Organización Panamericana de la Salud. Clasificación Estadística Internacional de Enfermedades y Problemas
Relacionados con la Salud, 10th, ed.; PAHO, Ed.; Organización Panamericana de la Salud: Washington, DC, USA,
1995; Volume 2, Available online: http://ais.paho.org/classifications/Chapters/pdf/Volume2.pdf (accessed on
16 January 2020).
29. Organisation for Economic Co-Operation and Development, OECD Statistics, National Accounts, PPPs and
Exchanges Rates. Available online: https://stats.oecd.org/ (accessed on 24 October 2018).
30. Instituto Nacional de Estadística y Geografía, INEGI. Encuesta Nacional de la Dinámica Demográfica 2009 y 2014.
Available online: https://www.inegi.org.mx/programas/enadid/2014/default.html (accessed on 30 June 2019).
31. United Nations; Department of Economic and Social Affairs; Population Division. Contraceptive Use
by Method 2019: Data Booklet (ST/ESA/SER.A/435); United Nations: New York, NY, USA, 2019; p. 13.
Available online: https://www.un.org/development/desa/pd/sites/www.un.org.development.desa.pd/files/
files/documents/2020/Jan/un_2019_contraceptiveusebymethod_databooklet.pdf (accessed on 12 April 2020).Int. J. Environ. Res. Public Health 2020, 17, 3097 16 of 17
32. The DHS Program. The Demographic and Health Surveys (DHS) Program. DHS Stat Compiler. Available
online: https://www.dhsprogram.com/data/STATcompiler.cfm (accessed on 12 April 2020).
33. Guttmacher Institute. Adding It Up: Investing in Contraception and Maternal and Newborn Health 2017;
Guttmacher Institute: New York, NY, USA, 2017. Available online: http://progress.familyplanning2020.org/
content/finance (accessed on 21 May 2019).
34. Consejo Nacional de Población; CONAPO; Secretaría de Gobernación. Índices de Marginación por Entidad
Federativa y Municipio 2010. Available online: http://www.conapo.gob.mx/es/CONAPO/Indices_de_
Marginacion_2010_por_entidad_federativa_y_municipio (accessed on 24 July 2019).
35. Division of Cancer Control & Population Sciences. Joinpoint Regression Program Version 4.2.0.1. Statistical
Methodology and Applications Branch, Surveillance Research Program; National Cancer Institute: Bethesda, MD,
USA, 2015.
36. Consejo Nacional de Evaluación de la política de Desarrollo Social (CONEVAL). El Ramo 33 en el Desarrollo
social en México: Evaluación de Ocho Fondos de Política Pública. Available online: https://www.coneval.
org.mx/Informes/Evaluacion/Estrategicas/Ramo_33_PDF_02032011.pdf (accessed on 8 July 2019).
37. Wagstaff, A.; Paci, P.; Van Doorslaer, E. On the measurement of inequalities in health. Soc. Sci. Med. 1991, 33,
545–557. [CrossRef]
38. Stata. Stata Corp. Release 11; Stata Press: College Station, TX, USA, 2009; Volume 1–4.
39. Secretaría de Salud. Dirección General de Información en Salud. Gasto en Salud en el Sistema Nacional de
Salud. 2019. Available online: http://www.dgis.salud.gob.mx/contenidos/sinais/gastoensalud_gobmx.html
(accessed on 17 December 2019).
40. Villalobos, A.; Hubert, C.; Hernández-Serrato, M.I.; de la Vara-Salazar, E.; Suárez-López, L.;
Romero-Martínez, M.; Ávila-Burgos, L.; Barrientos, T. Maternidad en la adolescencia en localidades
menores de 100,000 habitantes en las primeras décadas del milenio. Salud Publica Mex. 2019, 61, 742–752.
[CrossRef] [PubMed]
41. Suárez-López, L.; de Castro, F.; Hubert, C.; de la Vara-Salazar, E.; Villalobos, A.; Hernández-Serrato, M.I.;
Shamah-Levy, T.; Ávila-Burgos, L. Atención en salud materno-infantil y maternidad adolescente en
localidades menores de 100,000 habitantes. Salud Publica Mex. 2019, 61, 753–763. [CrossRef] [PubMed]
42. Heredia Pi, I.; Serván Mori, E.; Reyes Morales, H.; Lozano, R. Brechas en la cobertura de atención continua
del embarazo y el parto en México. Salud Publica Mex. 2013, 55, 249–258. [CrossRef]
43. Comisión Nacional de Protección Social en Salud. Sistema de Protección Social En Salud: Informe de Resultados
Enero-Diciembre 2011; Comisión Nacional de Protección Social en Salud: Mexico City, Mexico, 2012. Available
online: http://www.transparencia.seguro-popular.gob.mx/index.php/planes-programas-e-informes/22-planes-
rogramas-e-informes/39-informes-de-labores-de-la-cnpss (accessed on 20 October 2019).
44. Gutiérrez, J.P.; Rivera-Dommarco, J.; Shamah-Levy, T.; Villalpando-Hernández, S.; Franco, A.;
Cuevas-Nasu, L.; Romero-Martínez, M.; Hernández-Ávila, M. Encuesta Nacional de Salud y Nutrición
2012; Resultados Nacionales; Instituto Nacional de Salud Pública (MX): Cuernavaca, Mexico, 2012. Available
online: https://ensanut.insp.mx/encuestas/ensanut2012/informes.php (accessed on 13 April 2020).
45. FP2020 Family Planning’s Return on Investment. FP2020. 2018. Available online: https://www.
familyplanning2020.org/sites/default/files/Data-Hub/ROI/FP2020_ROI_OnePager_FINAL.pdf (accessed on
21 May 2019).
46. Gobierno de México. Senado de la República. Iniciativa 2019 Que Reforma la Ley General de Salud, de la Ley de
Coordinación Fiscal y de la Ley de los Institutos Nacionales de Salud en Materia de Acceso a los Servicios de Salud y
Medicamentos Asociados Para las Personas Que no Poseen Seguridad Social; Gaceta de la Comisión Permanente:
Mexico City, Mexico, 2019. Available online: https://infosen.senado.gob.mx/sgsp/gaceta/64/1/2019-07-03-1/
assets/documentos/Ini_Delgado.pdf (accessed on 27 January 2020).
47. Secretaría de Salud. Programa Sectorial de Salud 2019–2024; Secretaría de Salud: Mexico City, Mexico,
2020. Available online: http://saludsinaloa.gob.mx/wpcontent/uploads/2019/transparencia/PROGRAM_
SECTORIAL_DE_SALUD_2019_2024.pdf (accessed on 27 January 2020).
48. Dirección General de Información en Salud (DGIS). Unidades de Primer Nivel de Atención en los Servicios
Estatales de Salud; Evaluación 2008; Secretaría de Salud: Mexico City, Mexico, 2008. Available online: http:
//www.dged.salud.gob.mx/contenidos/dess/descargas/upn/upna_sesas_2008.pdf (accessed on 21 July 2019).
49. Torres-Pereda, P.; Heredia-Pi, I.B.; Ibañez-Cuevas, M.; Avila-Burgos, L. Quality of family planning services in
Mexico: The perspective. of demand. PLoS ONE 2019, 14. [CrossRef]Int. J. Environ. Res. Public Health 2020, 17, 3097 17 of 17
50. Pérez-Pérez, E.; Servan-Mori, E.; Nigenda, G.; Ávila-Burgos, L.; Mayer-Foulkes, D. Government expenditure
on health and maternal mortality in México: A spatial-econometric analysis. Int. J. Health Plann. Manag.
2019, 34, 619–635. [CrossRef] [PubMed]
51. Organisation for Economic Co-operation and Development (OECD). Extension of Work on Expenditure by
Disease, Age and Gender. Eu Contribution Agreement 2011 53 01; OECD Health Division: Paris, France, 2013.
Available online: https://www.oecd.org/els/health-systems/Extension-of-work-on-expenditure-by-disease-
age-and-gender_Final-Report.pdf (accessed on 29 January 2020).
52. World Health Organization (WHO). Global Health Expenditure Database. SHA Methodology. Disease
Manual Distribution Ratios. Available online: https://apps.who.int/nha/database/DocumentationCentre/
Index/en (accessed on 29 January 2020).
53. Organisation for Economic Co-Operation and Development (OECD). Estimating Expenditure by Disease,
Age and Gender. 12 April 2016. Available online: https://www.oecd.org/els/health-systems/estimating-
expenditure-by-disease-age-and-gender.htm (accessed on 29 January 2020).
54. Consejo Nacional de Población. Fecundidad en niñas y Adolescentes de 10 a 14 Años, Niveles, Tendencias
y Caracterización Sociodemográfica de las Menores y de los Padres de Sus Hijos(as), a Partir de las
Estadísticas del Registro de Nacimiento, 1990–2016. Available online: https://www.gob.mx/conapo/
documentos/fecundidad-en-ninas-y-adolescentes-de-10-a-14-anos (accessed on 28 November 2019).
55. United Nations. Objetivos de Desarrollo Sostenible. Goal 3: Ensure Healthy Lives and Promote Well-Being
for all at all Ages. Available online: https://www.un.org/sustainabledevelopment/health/ (accessed on 29
January 2020).
© 2020 by the authors. Licensee MDPI, Basel, Switzerland. This article is an open access
article distributed under the terms and conditions of the Creative Commons Attribution
(CC BY) license (http://creativecommons.org/licenses/by/4.0/).You can also read